

Abstract
Colombia's agriculture, forestry and other land use sector accounts for nearly half of its total greenhouse gas (GHG) emissions. The importance of smallholder deforestation is comparatively high in relation to its regional counterparts, and livestock agriculture represents the largest driver of primary forest depletion. Silvopastoral systems (SPSs) are presented as agroecological solutions that synergistically enhance livestock productivity, improve local farmers' livelihoods and hold the potential to reduce pressure on forest conversion. The department of Caquetá represents Colombia's most important deforestation hotspot. Targeting smallholder livestock farms through survey data, in this work we investigate the GHG mitigation potential of implementing SPSs for smallholder farms in this region. Specifically, we assess whether the carbon sequestration taking place in the soil and biomass of SPSs is sufficient to offset the per-hectare increase in livestock GHG emissions resulting from higher stocking rates. To address these questions we use data on livestock population characteristics and historic land cover changes reported from a survey covering 158 farms and model the carbon sequestration occurring in three different scenarios of progressively-increased SPS complexity using the CO2 fix model. We find that, even with moderate tree planting densities, the implementation of SPSs can reduce GHG emissions by 2.6 Mg CO2e ha−1 yr−1 in relation to current practices, while increasing agriculture productivity and contributing to the restoration of severely degraded landscapes.
Export citation and abstract BibTeX RIS

Original content from this work may be used under the terms of the Creative Commons Attribution 3.0 licence. Any further distribution of this work must maintain attribution to the author(s) and the title of the work, journal citation and DOI.
1. Introduction
The agriculture, forestry and other land use (AFOLU) sector accounts for 23% of net global anthropogenic greenhouse gas (GHG) emissions [1]. In order to achieve global climate targets, land use (LU) GHG emissions must decrease along a nonlinear trajectory and reach carbon neutrality by 2050 [2]. Although commercial agriculture expansion [3] is now considered the main driver of deforestation, subsistence agriculture still plays a major role in deforestation dynamics in many regions [4].
The GHG emissions of Colombia's AFOLU sector are comparatively high, accounting for 46% of its total [5]. To attain its recent commitments resulting from the Paris Agreement [6], Colombia has pledged through its Nationally Determined Contributions (NDC) to prioritize this sector by simultaneously curbing deforestation rates while improving the efficiency of its agriculture sector. Reducing deforestation rates will not only present climate benefits but also protect Colombia's world-renowned biodiversity [7].
Although deforestation rates (figure 1) and drivers vary across Colombia [8, 9], commonly cited causes are related to the expansion of agriculture, in particular pastureland growth [10, 11] and illicit crop production [12, 13], and to the persistence of logging [14] and mining [13, 15]. The importance of small-scale deforestation in Colombia, which represents around 80%, is comparatively high in relation to other South American countries [16, 17]. In the past decades, its deforestation drivers were framed and influenced to a large extent by the context of Colombia's armed conflict [18], which determined a large part of rural and urban population dynamics [19].
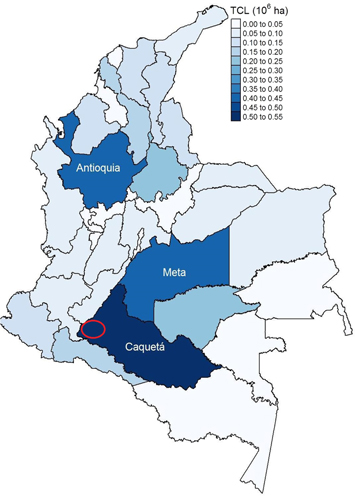
Figure 1. Deforestation in Colombia: tree cover loss occurring in Colombia's main departments during the 2001–2015 period. As observed, the largest deforestation took place in the department of Caquetá, which is the region the farms are located (red), followed by Antioquia and Meta. 197 275 ha were affected by deforestation during this period in Caquetá [23].
Download figure:
Standard image High-resolution imageThe department of Caquetá's deforestation is highlighted in continental-scale land use change (LUC) studies [10], attributed to the expansion of pasturelands. These LUC dynamics are largely associated with a colonization front produced by smallholder farms, which predominantly convert primary forest to pasture land by means of fire [14]. The colonization front emerged from strong demographic pressures in recent decades, originating from the densely populated Andean region in search of land and economic opportunities [20]. Today, highly degraded pasturelands prevail in the wake of the deforestation front, and cattle graze freely on very unproductive pasture [21]. As in many pasturelands across the tropics, a deficient establishment of pasture, poor maintenance and inadequate management with overgrazing represent the main causes of land degradation [22].
Sustainable intensification of forage-based agricultural systems promises not only to improve the productivity of tropical forage-based systems and local livelihoods but also to reduce the carbon footprint of livestock production while providing a wide range of ecosystem services [24]. The implementation of agroecological practices in degraded landscapes of deforested Amazonia thus holds the potential to revert the general negative trade-off existing between human development and natural capital [25].
Silvopastoral systems (SPSs) comprise a variety of agroforestry arrangements that combine fodder plants, such as grasses and leguminous herbs, with shrubs and trees for animal nutrition and complementary uses [26]. The potential of SPSs are explicitly mentioned in Colombia's NDC [5]. They provide economically attractive solutions to farmers, since they can enhance livestock productivity up to four times in relation to conventional, extensive livestock systems [27, 28]. At the same time they offer environmental services such as the recovery of degraded areas [26] through improved soil quality [29], reduced erosion or the uptake of CO2 through carbon (C) sequestration [24]. About a third of Colombia's entire territory is used for livestock production [30]: different forms of sustainable intensification hold the potential to reduce pressure on tropical forests of the region [30, 31], if complemented with appropriate policies [32–35].
Although multiple studies have examined the GHG mitigation potential of different forms of SPSs per unit of product (e.g. kg of meat, liters of milk) [36, 37], few have attempted to evaluate the GHG mitigation potential per hectare (ha) while accounting for soil and aboveground carbon (C) sequestration taking place in these systems, nor the GHG emissions arising from deforestation that can potentially be avoided [30]. As stocking rates increase in SPSs higher levels of livestock GHG emissions from enteric fermentation and manure are emitted per ha. Since it is still unclear under what conditions different forms of LU intensification can actually curb deforestation rates in the region [35], it is important to conservatively assess the GHG mitigation potential per unit of space.
In this paper we estimate the GHG mitigation potential of the implementation of SPSs in the department of Caquetá, Colombia's top deforestation hotspot [38]. To this end, we calculate, firstly, the GHG emissions arising from current practices in unproductive smallholder livestock farms of the region, including annual deforestation rates occurring within these farms. Secondly, we estimate the GHG mitigation potential of three different scenarios of progressively-increased SPSs complexity. Thirdly, we assess whether the carbon sequestration taking place in the SPSs scenarios, together with the avoided deforestation in the farms, is sufficient to offset the per-hectare GHG increase which occurs as stocking rates rise.
2. Methods
2.1. Survey data and farm characteristics
We use survey data on livestock population characteristics and deforestation rates from dual-purpose livestock systems obtained from 158 smallholder farms. The purpose of the household-level survey (see section A1 of the supplementary appendix, available at stacks.iop.org/ERL/14/114007/mmedia) was to understand and document the current socioeconomic conditions and farming practices of the Colombian Amazon. Sampling was stratified across the four municipalities of Morelia, San José del Fragua, Belén de los Andaquíes and Albania. The study prioritizes one landscape unit (hill) according to its relevance in terms of the area, deforestation and the main productive activity. The survey was composed of 14 modules. A total of 158 households were interviewed from the cattle ranching area. The sample is representative at a municipality level, according to the percentage of rural households in the 2005 national census. The information was collected from March 2016 to October 2016.
The range of farm sizes found in the study region was relatively large (4.9–254 ha), with an average farm size of 56.0 ha (figure 2(a)). Pasture represented by far the most frequent LU found within farms (69.8%), followed by fallow area and forest, which represented 9.4% and 8.8%, respectively (figure 2(b)).
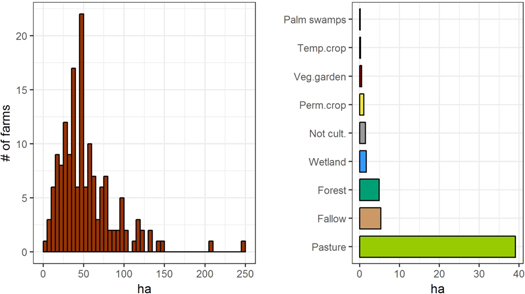
Figure 2. Size distribution of farms (ha) (a) and average LU types found (b): pasture, fallow, forest, wetland, area not cultivable, permanent crops, vegetable garden, temporary crops and palm swamps ('cananguchales').
Download figure:
Standard image High-resolution image2.2. SPS scenarios
For the estimation of the GHG mitigation potential of smallholder farms in Caquetá we consider four different livestock system scenarios (figures 3(a)–(d)): one baseline scenario depicting current practices of smallholder livestock farms in the region, and three progressively-increased SPSs that are in the process of being implemented (section 2.2), which no longer include deforestation practices. Each of the future implementing scenarios maintains the traits of the previous scenario and presents one new characteristic, which is described in the following sections. For this assessment we use annual LUC rates and livestock population data from 158 farms, located within the municipalities of Belén de los Andaquíes, Albania, San José del Fragua and Morelia.
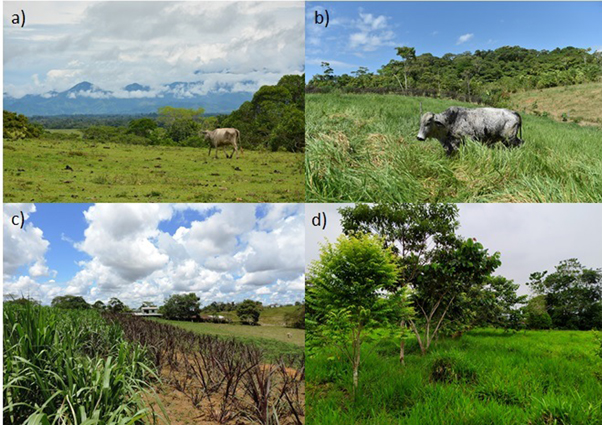
Figure 3. Range of scenarios considered in the study: (a) degraded pasture (baseline), (b) improved pasture, (c) fodder banks and (d) shade trees.
Download figure:
Standard image High-resolution image2.2.1. Degraded pasture (DP) scenario
The DP scenario represents the baseline scenario in the case-study region, i.e. current practices of participating livestock farms, with cattle grazing on very unproductive pastures dominated by the African grass Brachiaria spp [20]. In the context of highly degraded soils in the region [21], we observe very low stocking rates, 0.73 animal units (AU) per ha (one AU corresponds to 450 kg of live weight). Many farms choose to clear large amounts of forest each year to extend the area of their cattle ranching operations, therefore contributing significantly to deforestation and GHG emissions in the region.
2.2.2. Improved pasture (IP) scenario
In the IP scenario new grass species with increased quality and productivity are introduced to the pasture (figure 3(b)), following a one-time soil preparation that includes the introduction of lime as a soil amendment, with an upper limit application of 1.5 t ha−1.
Although a wide range of species are considered [39] some examples are Megathyrsus maximus, Brachiaria humidicola and Axonopus scoparius. The use of these species in the context of an adequate rotation and soil fertilization lead to a higher digestible energy (DE). A greater DE percentage in the diet of ruminants leads to a higher milk production and reduces significantly the GHG emissions per product [40]. In addition, introducing IPs increases substantially dry matter (DM) production per hectare in relation to a the baseline scenario, which means that it may support higher stocking rates.
2.2.3. Fodder banks (FB) scenario
The implementation of FB (figure 3(c)) is done to complement the previous IP scenario. FB are harvested to complement the diet of ruminants, which further improve their milk productivity. At the same time the use of FB increases stocking rates further. FB can contribute up to 30% to the ruminants' diet. An example of a fodder bank design is presented in the supplementary appendix (figure A2).
2.2.4. Shade trees (ST) scenario
The ST scenario continues to increase the complexity of the SPSs in relation to the two previous scenarios. Different tree species are planted in rows directly on the IP (figure 3(d)). In addition to the IP and to the existence of a fodder bank, two medium-fast growing tree species are considered, Calycophyllum spruceanum and Gmelina arborea, within a tree planting design of 104 trees ha−1. By substantially reducing temperatures under the canopy, trees provide shade for livestock and contribute to mitigate heat stress [26], which in turn offers a further increase in milk productivity. This constitutes as well an important measure for climate change adaptation, particularly given that the increasing temperature variability expected in the Amazonia [41] could further exacerbate heat stress in livestock systems. The leaves and branches of the trees themselves offer as well a supplementary supply of feed for the cattle, while the sale of timber can provide an additional source of income for the farmer.
2.3. Estimation of GHG emissions
For the estimation of GHG emissions arising from the livestock farms and the different modeled scenarios we consider three different components: firstly, the GHG emissions arising from deforestation, e.g. the emissions resulting from the LUC of forest to pasture land. Secondly, for the case of the modeled scenarios of SPSs, negative GHG emissions are considered in the form of carbon sequestration in both the soil and in the aboveground biomass. The amount of carbon sequestration taking place as a result of the changes in LU is estimated with the CO2 fix model [42], which can be used in the context of tropical agroforestry systems [43]. Thirdly, we consider the GHG emissions arising directly from livestock production, which include enteric fermentation and manure emissions. The one-time application of lime amendment is not included in the estimation of GHG emissions due to the lack of data. This exclusion however is expected to have a negligible impact on the results, given that other studies have found fertilizer application in livestock smallholder farms to be highly irrelevant in relation to total emissions [44]. The three components analyzed are described in further detail in the following sections.
2.3.1. Deforestation GHG emissions
Farms reported the nature (e.g. forest to pasture or cropland) and quantity of LUCs since 2010. From this information we obtained, for each farm, yearly rates of deforestation. For the estimation of LUC GHG emissions we consider mean aboveground C values for forest and pasture land of 172.17 Mg C ha−1 and 1.8 Mg C ha−1, respectively, based on reported average measurements [45]. C stocks considered in this section are then converted to CO2 emissions by multiplying them by a factor 44/12, their respective molecular weights. We assume 0 Mg C ha−1 for cropland, since it does not represent a permanent aboveground C gain. Soil organic carbon (SOC) changes occuring as a result of LUC in the topsoil (0–30 cm depth) are also included: an average forest SOC value of 59.37 Mg C ha−1 was considered for the study region [46] and SOC changes are calculated based on mean percentage changes recorded in the literature across the tropics [47]. A summary of carbon stock value changes resulting from different types of LUC used in this study are summarized in the supplementary appendix (table A2).
2.3.2. LU emissions
The carbon sequestration that occurs in the SPSs scenarios is modeled with the CO2 fix Model, v3.2 [42]. It is a carbon bookkeeping model with several modules (e.g. biomass and soil modules) and a temporal resolution of one year. Within each scenario multiple cohorts for each grass/plant/tree species can be created, which allows for individual modeling of their growth and indirectly of their planting density. The key parameter for each cohort is the current annual increment (CAI), which is the yearly increase of stem volume (m3 yr−1 ha−1). It is typically a curve that reaches a peak in the first few years after planting and then asymptotically approaches zero. The other growth compartments—foliage, branches and roots—are all parameterized relative to the stem growth. A model is created for a DP, an IP, a fodder bank, and for tree row planting. Further details on the parameterization of the models can be found in the supplementary appendix (section A2.2). These modeled components are combined with the livestock and deforestation GHG emissions to create the three implementation scenarios. C stocks considered in this section are converted to CO2 emissions by multiplying them by a factor 44/12, their respective molecular weights.
2.3.3. Livestock GHG emissions
Data on livestock population characteristics is taken from a survey covering 158 farms. For each of the four scenarios the GHG emissions arising from enteric fermentation and manure are calculated following the IPCC, Tier 2 enhanced characterization method [48]. All the parameters used in the calculations for each scenario can be found in the tables of the supplementary appendix (section A2.3).
2.4. Total GHG emissions
We combine the three GHG emissions components presented in the previous sections. For the baseline scenario (i.e. DP) we cover, based on survey data, GHG emissions arising in each farm from deforestation and livestock enteric fermentation and manure. In contrast, for the three future implementation scenarios (IP, FB, ST) we cover livestock GHG emissions and negative GHG emissions taking place through carbon sequestration in the different SPSs scenarios. It is expected that the restoration of DPs and the farm productivity increases will make forest conversion less attractive, hence GHG emissions arising from deforestation are no longer included in these three scenarios.
Through the IPCC formulas [48] we obtained the livestock GHG emissions arising from each animal category. These are then multiplied by the number of animals present in each category and summed up to obtain the total livestock GHG emissions per farm. The conversion factors suggested by the IPCC [49] were used to calculate CO2e emissions from CH4 (×28) and N2O (×265). The average stocking rate for the baseline scenario was determined by first calculating the AUs in each farm.

where:
- AUi are the AUs in farm i.
- mj is the average weight in animal category j.
- xj is the number of animals in animal category j.
The stocking rate calculation (AU ha−1) for each farm is then calculated as follows:

where:
- SRbase,i is the baseline stocking rate on farm i.
- AUi are the AUs in farm i.
- Apast,i is the pasture area on farm i.
- Aforest,i is the forest area on farm i.
Forest area (Aforest) is considered in the total area for the baseline scenario because farmers reported that their livestock also use it for grazing and as a relief from heat stress. On average the baseline SRbase was 0.73 AU ha−1, or 0.83 AU ha−1 if excluding the forest area from the total grazing area. This latter SR was calculated in order to correctly upscale the livestock population in the other scenarios using values found in the literature (table A17). This is done because in the three implementation scenarios the cattle will only graze on pasture land, and forest land will remain undisturbed. The livestock composition was not changed for the three implementation scenarios.
The yearly carbon sequestration of the future IP implementation was calculated as follows:

where:
- LUscen,i is the yearly carbon sequestration by LU per ha on farm i.
- △Cscen is the carbon sequestration by LU.
- Apast,i is the area of pasture on farm i.
- Atotal,i is the total area on farm i.
In both the FB and ST scenarios an area of the pasture is reserved for the implementation of a fodder bank, designed to supplement up to 30% of the cattle's diet in each farm. In the following expression the carbon sequestration of the FB scenario is presented.
where:
- △CFB is the carbon sequestration by LU (FB).
- AFB,i is the area of fodder bank on farm i.
- △CIP is the carbon sequestration by LU (IP).
- Apast-FB,i is the area of pasture minus the area of fodder bank on farm i.
- Atotal,i is the total area on farm i.
Resizing of the fodder bank area for each farm was done through the procedure shown in the appendix (section A2.2.3) and using yearly DM production values for shrubs [50] (table A9).
Finally, through sensitivity analyses we assess the influence of six key parameters and assumptions made on the overall results. Specifically, we include the assumption that no deforestation takes place in the SPSs; the aboveground forest carbon value; the tree planting density design of the ST scenario; the DE parameters; the stocking rates; and the liters of milk produced.
3. Results
3.1. LUC in the study region and GHG emissions from deforestation
Our survey data indicates that 12.0% of farms acknowledged carrying out deforestation practices recently. Specifically, 109 ha of forest were converted across all farms during the 2010–2015 time period, which represents 12.3% of the forest cover present in 2010. The business-as-usual GHG emissions arising from deforestation amounted to 1.4 Mg CO2 ha−1 yr−1 (12 036.4 Mg CO2 yr−1 across a total farm area of 8850.2 ha). Through the implementation of more intensive SPSs the farmers have agreed to stop deforestation practices within their farms, hence GHG emissions arising from tree cover loss are no longer present in the three SPSs implementation scenarios.
According to satellite-based deforestation datasets [23], 1.88% of forests were depleted in the four municipalities the farms are located in during the same time period. The difference in deforestation rates between the farms and the municipality scale is expected, since the targeted farms of our study are one of the driving forces of deforestation in the region, i.e. the sampled farms will show proportionally higher tree cover loss rates in relation to the entire municipalities. This highlights however an important fact: in order to reduce GHG emissions arising from deforestation, smallholder-focused solutions to deforestation are essential in this region.
3.2. Soil and aboveground carbon sequestration
The carbon sequestration of the three modeled technologies (IP, FB and ST) (figures 4(a)–(c)) differed substantially in relation to the baseline scenario (figure A1). The increase in total C stocks amounted to 0.57, 6.24 and 2.06 Mg C ha−1 yr−1, respectively, for the IP, FB and ST technologies over the 25 year period considered. However, it should be stressed that, despite its strong performance, the FB technology will only represent a small part of the farm.
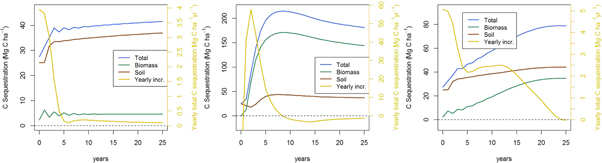
Figure 4. Carbon sequestration of silvopastoral systems technology: the figures represent the carbon sequestration (Mg C ha−1) taking place in an improved pasture (IP) (a), a fodder bank (FB) (b) and with tree row planting (ST) (c). The carbon sequestration of each technology is broken down in soil, biomass and total. Moreover, the yearly carbon sequestration is presented in yellow. Overall, there is a moderate initial gain of carbon in the IP model in the first few years, which then stabilizes rapidly. There is a large sequestration potential per ha for the FB, although its total area in the farm will be relatively small. Finally, the ST technology presents a large sequestration potential per ha, which starts to even out only after 20 years. The soil and biomass compartments of all three technologies part from the baseline scenario (figure A1).
Download figure:
Standard image High-resolution imageOverall, for the IP technology total C stocks fluctuated from an initial 27.4 to 41.6 Mg C ha−1 after 25 years, which represents 52.1 Mg CO2 ha−1 of CO2 sequestration. The implementation of an IP (Cynodon plectostachyus) resulted in a rapid increase in SOC during the second and third year (figure 4(a)). This period is followed by a much slower, but steady growth, illustrated by the yearly increment curve (yellow). A higher DM production of the IP produces more root and foliage litter, which in turn increases SOC. The biomass C stock is also slightly increased, but as expected over time it does not represent a relevant accumulation of C. The parameters used for this model can be found in the supplementary appendix (table A6).
The FB technology's total C stocks fluctuated from an initial 25.1 to 181.2 Mg C ha−1 after 25 years, which represents 572.4 Mg CO2 ha−1 of CO2 sequestration. The fodder bank technology is the first one that presents more than one cohort, which means that multiple plant species are parameterized (tables A7, A8). For the first three years total C stocks increase rapidly as a result of CO2 sequestration (figure 4(b)), presenting the highest slope roughly at year two (maximum CAI). This is then followed by a second period with a more moderate CO2 sequestration. In the first 2–3 years a small dip in the soil C stocks occurs because the newly planted shrubs and crops do not produce enough litter to support the initial soil C stock levels. Later on the plants grow rapidly and with them the soil C stock rises again, until the biomass C stock reaches its maximum. From that point onward SOC levels decrease again due to reduced quantities of litter incorporated into the soil.
Finally, the ST technology's total C stocks fluctuated from an initial 27.4 to 79.0 Mg C ha−1 after 25 years, which represents a cumulative sequestration of 189.2 Mg CO2 ha−1 (figure 4(c)). In this case three different cohorts are implemented: Cynodon plectostachyus, the pasture species previously used for the IP technology, and two different tree species (Calycophyllum spruceanum and Gmelina arborea) planted with a density of 104 st ha−1 (figure A3). Total C stocks present a prolonged, steady rise over time until they level out after 20 years. Observing the total yearly carbon sequestration rates (in yellow), three distinct sections can be observed. The first section (0–5 years) is characterized by a high, yet falling yearly carbon sequestration rate, from 5 to 2.5 Mg C yr−1. The sequestration rate then remains somewhat constant for the next ten years at around 2.5 Mg C yr−1. In the last ten years it steadily falls until it reaches 0 Mg C yr−1.
3.3. Livestock GHG emissions
Average GHG emissions arising from cattle production, which considers enteric fermentation and manure, amounted to 2.0 Mg CO2e ha−1 yr−1 in the baseline scenario of DP. For the three different scenarios of progressively-increased SPSs complexity, livestock GHG emissions increased to 2.7, 4.6 and 6.6 Mg CO2e ha−1 yr−1 (figure 5—second boxplot of each scenario group). GHG emissions from livestock rise as SPSs allow for higher stocking rates. However, this relationship is sublinear, i.e. the GHG efficiency per AU improves despite an overall GHG emissions increase is observed per ha. This is largely due to a greater DE percentage in the diet of ruminants, which significantly reduces the GHG emissions per feed intake [40]. The main factor determining the baseline livestock GHG emissions across farms are the number of livestock heads grazing per ha. The GHG emissions variability across farms reflects the existing stocking rates present, which ultimately depend on the state of degradation of the pasture—less degraded areas will present larger GHG emissions per ha.
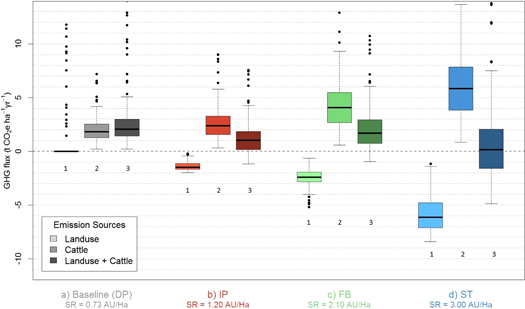
Figure 5. GHG emissions distribution of the farms for the (a) baseline scenario (DP) and the three different implementation scenarios considered—(b) improved pasture (IP), (c) fodder bank (FB) and (d) shade trees (ST). For each scenario three GHG components are shown: (1) land use / land cover change emissions (e.g. forest land use conversion to pasture land and carbon sequestration in soil and aboveground biomass), (2) cattle emissions (enteric fermentation and manure emissions) and (3) total. As the complexity of the scenarios progresses we observe the cattle GHG emissions component increasing as a result of higher stocking rates. However, carbon sequestration taking place in soil and aboveground biomass compartments offsets this increase and produces an overall emission reduction in relation to the baseline scenario.
Download figure:
Standard image High-resolution image3.4. Overall GHG assessment
The baseline scenario's total GHG emissions amounted to 3.4 Mg CO2e ha−1 yr−1. In contrast, the SPSs evaluated presented 1.3, 2.2 and 0.8 Mg CO2e ha−1 yr−1 for the IP, FB and ST scenarios, respectively. This demonstrates that, even on a per ha basis, these systems hold the potential to reduce GHG emissions in highly degraded landscapes. The three GHG emissions components discussed in earlier sections are now brought together to assess the overall performance and differences existing across SPSs.
The total GHG emissions per ha of farmland of the baseline scenario (grey) and of the three implementation scenarios are shown in figure 5—IP (red), FB (green), and ST (blue). Each scenario presents three box plots; the first box of each group refers to the emissions arising from LU and LUC. For the baseline scenario it includes positive deforestation emissions (section 3.1), while for the three implementation scenarios negative emissions are represented as a result of the CO2 capture and C storage in the biomass and soil compartments that takes place in SPSs (section 3.2). The second box of each group presents the livestock emissions generated (section 3.3), while the third component represents the total—the addition of the LULUC and livestock emissions. We observe that for every one of the future scenarios total GHG emissions are reduced in relation to the DP baseline scenario. Assessing exclusively the carbon sequestration component of the SPSs, IP, FB and ST scenarios present a mean GHG mitigation potential of −1.4, −2.4 and −5.8 Mg CO2 ha−1 yr−1.
The FB scenario's total emissions do not follow the overall trend described by the others, but present a small increase in GHG emissions in relation to the IP scenario. This happens mostly because even though FB have a very high carbon sequestration per ha (section 3.2) they cover a relatively small space on each farm: overall, the carbon sequestration taking place on a small area does not compensate for the livestock GHG emissions rise resulting from a higher stocking rate.
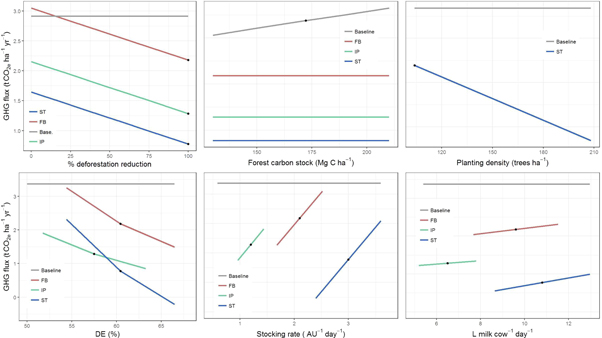
We perform sensitivity analyses to gauge the influence of six key input parameters and assumptions made on the overall results. Regarding the LUC component we test the assumption of no deforestation in SPSs and the value of C stock used for forests (172.17 Mg C ha−1). For the former, we find that if deforestation practices were only partially reduced (e.g. a 50%–75% reduction instead of 100%), we still would observe substantial net GHG emissions reductions—particularly for the ST and IP scenario (figure 6(a)). Regarding the latter, we find that relatively small changes of forest C stock do translate into a strong impact on the baseline scenario and therefore on the overall results (figure 6(b)). Our measured value (172.17 Mg C ha−1) is in the range provided for the municipalities by global aboveground carbon datasets [51]. Interestingly, our study region presents C stocks that are in the lower end of the potential forest C storage range—e.g. Belén de los Andaquíes presents an average value of 185 t C ha−1 [51], while a neighboring municipality not included in the study (Solano) offers 276 t ha−1. This highlights that GHG mitigation potential of SPSs can be much larger in carbon-dense forest regions. Furthermore, in this study we use relatively low tree planting densities (104 trees ha−1)—the GHG mitigation potential would rise substantially if it were moderately increased (figure 6(c)). Regarding the livestock component, we find the DE(%) and the stocking rate to exert strong effects on the overall results (figures 6(d)–(e)). This clearly stresses the importance of selecting IP and fodder bank species with high DE and of avoiding overgrazing in SPSs. In contrast, the amount of liters of milk assumed has little impact on the overall results (figure 6(f)).
Figure 6. Sensitivity analyses of total GHG flux results to key parameters and assumptions: silvopastoral systems reduce deforestation completely (100% reduction); forest carbon stock (172.17 Mg C ha−1); planting density (104 trees ha−1); digestible energy (DE) (50%, 57.5%, 60.4% and 60.4% for the baseline), improved pasture (IP), fodder bank (FB) and shade trees (ST), respectively; stocking rate (0.73, 1.20, 2.10 and 3.00 for the baseline, IP, FB and ST, respectively); and liters of milk (4.5, 6.5, 9.6 and 10.8 for the baseline, IP, FB and ST, respectively). The black dots represent the values used to obtain the overall GHG results reported.
Download figure:
Standard image High-resolution image
4. Discussion
In this study we evaluate the GHG mitigation performance of SPSs in highly degraded pasturelands of Caquetá. Through the examination of three different scenarios of progressively-increased SPSs complexity, we find that SPSs hold the potential to reduce GHG emissions compared to current practices, besides simultaneously reverting severely degraded landscapes and improving local livelihoods [25, 26]. In highly degraded landscapes deforested in the past, they present a notable GHG mitigation potential. Our analysis includes, not only the GHG assessment related to stocking rate changes as SPSs scenarios intensify but also avoided deforestation CO2 emissions and, crucially, carbon sequestration taking place in these systems. Carbon sequestration is very relevant in SPSs, to the point that they offset the livestock GHG emissions increase that occurs as a result of the system's intensification. Our study provides evidence to inform regional policy regarding the ability of SPSs to offset GHG emissions and is relevant in view of Colombia's discussion of its national livestock policy, which attempts to pursue sustainable livestock systems and zero-deforestation supply chains. To facilitate the proliferation of these systems incentives could be generated through milk and meat prices, since SPS products are obtained through an environmentally-sustainable production approach. The implementation of SPSs is also highly relevant for the broader tropics region, given the amount of similarly degraded environments and overgrazing occurring in deforested landscapes [52]. In order to optimize its GHG mitigation potential it is important to avoid overgrazing by using adequate stocking rates, to select high DE pasture and fodder species and to implement high tree-planting density designs.
Previous literature has focused on the relevance of carbon sequestration over a large range of different LU options in livestock-dominated landscapes [53], or addressed exclusively the livestock GHG emissions component of SPSs [36]. In our work, we show that evaluating only one component might lead to an incomplete picture, and therefore both the LU carbon sequestration and livestock GHG emissions components are important to obtain a balanced understanding of the overall GHG performance. It is estimated that 250 Mha of deforested land in the humid tropics could be converted to agroforestry at a rate of 3% per year, with an average potential sequestration rate of 3.1 Mg C ha−1 yr−1, the highest of any LU activity described by the IPCC apart from restoration of forest land [31]. Our most favorable SPSs scenario with tree row planting presented a carbon sequestration potential of 1.6 Mg C ha−1 yr−1 (5.8 Mg CO2 ha−1 yr−1), and an overall GHG mitigation potential of 2.6 Mg CO2e ha−1 yr−1 when considering the livestock component. This is particularly noteworthy considering it relates to livestock systems, while agroforestry includes also different types of non-livestock LU. However, the results for SPSs with a tree planting density of 104 st−1 ha−1 can be further improved, considering that substantially higher tree planting density designs of up to 500 st−1 ha−1 are possible [54]. In addition to substantially higher GHG emission reductions, increasing the tree canopy density favors climate change adaptation through heat stress mitigation in livestock systems. Furthermore, as a result of this LU intensification, many farmers implementing SPSs agreed not only to halt deforestation but to engage in reforestation practices. These practices have been conservatively left out of the calculations, but could provide even stronger GHG mitigation results in this region [53]. In a subsequent work we will include an economic analysis of SPSs and will explore the potential to upscale these systems at a larger, spatial scale.
Our work presents a number of limitations. Firstly, the number of SPSs scenarios does not do justice to the variation of SPSs designs that can be found under this definition [30]. Although in this work we have presented conservative designs for SPSs systems, further work could explore a broader palette of SPSs, including a larger range of tree species and planting densities. Secondly, our study assumes that more intensive forms of SPSs are implemented across the entire pasture. This not a problem for the calculations, since they are provided per ha. However, given the fact that smallholders will not have the means to increase their livestock population 4-fold, a very realistic possibility of setting aside large areas for reforestation should be considered. Future research could tackle this reforestation potential through a 'whole landscape' approach [55] while including a range of policies that could simultaneously address the expansion of the deforestation front by new settlers. Furthermore, there is a persistent limitation in Colombia regarding place-specific emission factors, which also applies to this region; bridging this issue will allow for the validation of mitigation strategies that are more specific to local conditions. The scenarios modeled in this paper are in the process of being implemented in pilot farms, which will allow for such measurements and for a better understanding of long-term dynamics of SPSs in Caquetá.
In our study we show that SPSs also hold the potential to avoid deforestation GHG emissions taking place in forest LU within established farms. Farmers implementing SPSs might be willing to conserve forests in the context of achieving higher livestock productivity in their pasture and of obtaining alternative sources of wood products found in these systems [31]. However, special care should be considered when extrapolating these farm-scale, deforestation-avoided results (section 3.1) to a wider region. Firstly, there is still little evidence that suggests that agriculture intensification reduces the expansion of regional deforestation fronts, particularly when the underlying causes of forest land conversion are driven by complex socioeconomic factors. For instance, smallholder deforestation in Caquetá has been largely driven by the expectation of future land value and land titles [11]—settling farmers convert the forest to achieve informal tenure, which in time may render formal titles.
Secondly, our case study includes farms in regions that were cleared in many cases decades ago. It is unclear however whether smallholder farmers would engage in intensification practices in a context of abundant forests, and of low labor and capital availability [35, 56]: the average investment required for the SPSs technologies for these farms were 911 $ ha−1, 3277 $ ha−1 and 1522 $ ha−1 for the IPs, FB and ST, respectively [57]. Additionally, in an opposite context of financial support, a deforestation rebound effect could take place, i.e. increases in agriculture profitability could render forest land clearing more attractive to local actors: the implementation of the IPs, FB and ST technology produced benefit-cost ratios of 1.05, 1.31 and 1.12, respectively [57].
To sum up, SPSs are suitable to restore degraded lands, reduce GHG emissions through carbon sequestration and improve local livelihoods, but should be complemented with appropriate 'whole landscape approach' policies [55] to tackle inequality, potential deforestation rebound effects and the underlying drivers of LUC in the region [33, 58]. This may allow to combine the benefits of an increased agriculture productivity with the conservation and restoration of natural environments [34].
Acknowledgments
The Sustainable Amazonian Landscapes project (42206-6157) is part of the International Climate Initiative (IKI). The Federal Ministry for the Environment, Nature Conservation and Nuclear Safety (BMU) supports this initiative on the basis of a decision adopted by the German Bundestag. The funders had no role in the design, data collection and analysis, decision to publish, or preparation of the study.
Data availability
The data that support the findings of this study will be openly available following a delay of 12 months from the date of publication. This delay is for legal and/or ethical reasons.