

Abstract
Increased shrub cover on the Arctic tundra is expected to impact ecosystem-atmosphere exchanges of carbon and energy resulting in feedbacks to the climate system, yet few direct measurements of shrub tundra-atmosphere exchanges are available to corroborate expectations. Here we present energy and carbon dioxide (CO2) fluxes measured using the eddy covariance technique over six growing seasons at three closely located tundra sites in Canada's Low Arctic. The sites are dominated by the tundra shrub Betula glandulosa, but percent cover varies from 17%–60% and average shrub height ranges from 18–59 cm among sites. The site with greatest percent cover and height had greater snow accumulation, but contrary to some expectations, it had similar late-winter albedo and snow melt dates compared to the other two sites. Immediately after snowmelt latent heat fluxes increased more slowly at this site compared to the others. Yet by the end of the growing season there was little difference in cumulative latent heat flux among the sites, suggesting evapotranspiration was not increased with greater shrub cover. In contrast, lower albedo and less soil thaw contributed to greater summer sensible heat flux at the site with greatest shrub cover, resulting in greater total atmospheric heating. Net ecosystem exchange of CO2 revealed the potential for enhanced carbon cycling rates under greater shrub cover. Spring CO2 emissions were greatest at the site with greatest percent cover of shrubs, as was summer net uptake of CO2. The seasonal net sink for CO2 was ~2 times larger at the site with the greatest shrub cover compared to the site with the least shrub cover. These results largely agree with expectations that the growing season feedback to the atmosphere arising from shrub expansion in the Arctic has the potential to be negative for CO2 fluxes but positive for turbulent energy fluxes.
Export citation and abstract BibTeX RIS

Original content from this work may be used under the terms of the Creative Commons Attribution 3.0 licence.
Any further distribution of this work must maintain attribution to the author(s) and the title of the work, journal citation and DOI.
Introduction
The Arctic has warmed considerably in past decades, bringing about a host of environmental changes (Hinzman et al 2005, Post et al 2009). Increasing shrub abundance is one of the most demonstrable and widely documented changes occurring (Tape et al 2006, Elmendorf et al 2012). Existing shrub communities have increased productivity leading to greater canopy heights and densities, while the expansion of shrubs on to herbaceous tundra has led to changes in community composition (Tremblay et al 2012, Moffat et al 2016). The impact of this 'shrubification' on the tundra environment involves a complex web of potential feedback effects among soil-plant-atmosphere interactions including ecosystem-atmosphere exchanges of energy, water vapor and carbon dioxide (CO2) (Myers-Smith et al 2011). Shrubs decrease albedo (ratio of reflected to incoming solar radiation) of the tundra, thus increasing net radiation at the surface and leading to greater heat fluxes to the atmosphere (Beringer et al 2005, Chapin et al 2005, Sturm et al 2005a, Pearson et al 2013). As suggested by recent modelling studies, more shrubs could result in higher transpiration rates, thereby increasing atmospheric moisture content leading to a positive climate feedback (Swann et al 2010, Bonfils et al 2012). Shrub cover also affects the soil microclimate, where soils under denser, taller shrubs are reported to be warmer in winter under deeper snow (Sturm et al 2005b), but cooler and with shallower thaw depths in summer when compared to soils with non-shrub cover (Myers-Smith and Hik 2013, Blok et al 2010). Modelling studies suggest that in future this effect may be negated by evolving tundra-climate feedbacks resulting in deeper thaw depths (Lawrence and Swenson 2011, Bonfils et al 2012).
Increases in shrub cover can also impact C and nutrient cycling processes (Buckeridge et al 2010) and alter the tundra-atmosphere exchange of CO2 (Sweet et al 2015). Although an increase in leaf area with more shrub cover should increase gross ecosystem production and uptake of CO2 (Street et al 2007, Shaver et al 2007), the impact on ecosystem carbon losses is less clear (Myers-Smith and Hik 2013, Ge et al 2017). In winter ecosystem respiration is likely to increase with increased shrub cover due to the increased insulating capacity of the shrub-trapped snow creating a warmer soil environment (Sturm et al 2005a). However, in summer when soils are cooler and soil thaw is shallower below dense shrub cover respiration rates were found to be similar (Myers-Smith and Hik 2013) or higher compared to non-shrub tundra (Ge et al 2017). Thus, the overall effect on the net ecosystem exchange of CO2 (NEE) is unclear. Despite these discrepancies, it is almost certain that increased shrub cover is expected to impact ecosystem-atmosphere exchanges and thereby potentially initiate feedbacks that will influence the future Arctic climate. Despite the overwhelming importance of these interactions there are few examples of direct observations of tundra-atmosphere exchanges of energy and carbon under differing amounts of shrub cover.
Here we present observations of tundra-atmosphere interactions from three closely located tundra sites with varying shrub cover in the Low Arctic of central Canada. Soil microclimate and fluxes of energy, water vapor and CO2 were measured over six growing seasons. The main goal of the study was to examine differences in spring through summer fluxes among the sites and test the hypothesis that growing season atmospheric heating and net CO2 uptake increase with increasing shrub abundance.
Materials and methods
Study sites
Flux measurements were conducted near the Daring Lake Tundra Ecosystem Research Station in the low Arctic of central Canada (64°52'N, 111°34'W). The region is located in the Southern Arctic ecozone of the Northwest Territories and is characterized by geologically controlled topography with bedrock outcrops, boulder fields, eskers and interspersed lowlands and lakes. Climate is continental Arctic. The mean annual temperature is −8.9 °C, with January being the coldest month (−30.0 °C) and July the warmest month (13.2 °C) (Lafleur et al 2012). Annual precipitation is ~250 mm, about half falls as rain in the short summer season from June to August. Permafrost is continuous in the region up to depths of 160 m depending upon local conditions (Dredge et al 1999).
The three study sites, located within 3 km of each other, were described and named based on the Circumpolar Arctic Vegetation Map classification (CAVM, Walker et al 2005). The mixed tundra (MT) is represented by CAVM designations S1 and G4, the dwarf shrub site (DS) represents the S1 designation, and the low shrub site (LS) followed designation S2. Although there were minor differences in soil characteristics and understory vegetation composition, the sites differed most in terms of their shrub cover. The dominant shrub is Betula glandulosa Michx. and percent cover was 17%, 45%, and 64% for MT, DS and LS, respectively (table 1 and see supporting information SI 1 stacks.iop.org/ERL/13/055001/mmedia for vegetation characterization methods and site photos). All sites had a minor amount of willow shrubs (Salix sp.) and the common understory species were Vaccinium uliginosum L., Rhododendron tomentosum Harmaja, Empetrum nigrum L., Vaccinium vitis-idaea L., Andromeda polifolia L., Rubus chamaemorus L., and some unidentified graminoids. Leaf area index of the tundra plant canopy increased with increasing shrub cover (table 1). Another important difference among sites was the non-vascular ground cover. The LS site understory was dominated by mosses (table 1). At the DS and MT sites, shrub cover was less uniform and there was a mix of moss and lichen cover depending on microtopography with more lichen and less moss in well drained locations. Soil organic carbon did not vary greatly between the sites with a range of 10–14 kg C m−2 to a depth of 30 cm (Campeau et al 2014).
Table 1. Vegetation characteristics for the three study sites. Values in brackets indicate ± 1 standard error from the mean over three plots (biomass), five plots (moss and lichen cover), ten plots (LAI), four transects (shrub cover) and on 40, 107, and 153 shrub individuals along these transects at the mixed tundra, dwarf shrub and low shrub sites, respectively.
| Mixed tundra | Dwarf shrub | Low shrub | |
|---|---|---|---|
| Aboveground vascular plant biomass (g dry weight m−2) | 349.5 (50.9) | 378.6 (45.9) | 1146.9 (241.6) |
| Plant canopy leaf area index (LAI) (m2 m−2)a | 0.52 (0.05) | 0.78 (0.04) | 1.49 (0.15) |
| Mean shrub height (m) | 18.2 (1.32) | 21.6 (0.83) | 58.5 (2.02) |
| % shrub cover | 16.7 (0.04) | 44.6 (0.01) | 63.8 (0.04) |
| % moss cover | 16.5 (4.9) | 91.7 (2.0) | 96.5 (1.1) |
| % lichen cover | 78.9 (5.0) | 6.7 (1.9) | 0.0 (0.0) |
aGap fraction method includes leaf and stem area for plant parts taller than ~5 cm and thus does not include prostrate species, moss, etc.
Instruments and measurements
Fluxes of sensible heat (H), latent heat (LE) and CO2 were measured with eddy covariance (EC) systems. With some minor differences, instrumentation was standard at all sites. Wind vectors and sonic temperature were measured with a 3-axis sonic anemometer (R3–50, Gill Instruments, Lymington, UK at MT and Windmaster Pro, Gill Instruments, Lymington, UK at DS and LS). Until 2014, CO2 and H2O concentrations were measured by open-path infra-red gas analyzer (LI-7500, LI-COR Inc, Lincoln, NE, USA) at all three sites. In 2014 and 2015, a LI-7200 enclosed path infra-red gas analyzer (LI-COR) was run alongside the LI-7500 at MT. All signals were scanned at 10 Hz and recorded on data loggers (CR5000 at MT and CR3000 at DS and LS, Campbell Scientific, Logan, Utah, USA) and in 2014 and 2015, on a USB storage device via the LI7550 (LI-COR) analyzer interface.
Thirty-minute fluxes were computed from high frequency signals using Eddy Pro v. 6.2.0, which included block averaging, a double coordinate rotation, and corrected multipliers for the WindMaster Pro vertical velocity (w). No angle of attack correction was included. Density fluctuations were addressed using the Webb et al (1980) approach when using the open-path IRGA. Mixing ratios were directly output by the enclosed-path IRGA converting CO2 and H2O densities with high frequency air inlet and outlet thermocouples temperature readings. Time lags in the CO2 and H2O signals were computed by maximizing the covariance of w and these signals. Default settings for spike removal and absolute limits were used. High-pass filtering effects were corrected following Moncrieff et al (1997) while low-pass filtering effects were corrected following Moncrieff et al (1997) when open-path IRGAs were used and following Ibrom et al (2007) when an enclosed-path IRGA was used in 2014 and 2015 at MT. Quality assurance was largely achieved by removing fluxes when either the sonic anemometers or the IRGAs indicated obstructed sensing paths from rain, dew, or fouling. CO2 fluxes at night and when the surfaces were snow covered were removed from the data record when friction velocity was below 0.1 m s−1 to avoid underestimating CO2 emissions from the ecosystem (Baldocchi 2003). Energy balance closure was evaluated by regressing 30 min. net radiation minus ground heat flux against the sum of H and LE (see SI 2—table S1 and figure S2). In July average closure, as determined by the slope of the regression lines, was 0.90, 0.94 and 0.94 at MT, DS and LS, respectively.
To address the apparent self-heating error associated with the LI-7500 open-path IRGA (Burba et al 2008), the concurrent 30 minute CO2 fluxes at MT measured with the LI-7500 and LI-7200 analyzers in 2014 and 2015 were examined. A bias of greater net uptake with the open path sensor was observed through the study period. We developed a site-modified Burba et al (2008) correction relating sensor temperature to air temperature, radiation and wind speed (see SI 3—figure S3 and table S2). The correction was applied to the open path IRGA-derived CO2 flux data from all three sites and increased CO2 fluxes by ~0.5 µmol m−2 s−1, on average.
Net ecosystem exchange of CO2 (NEE) was calculated as the sum of the CO2 fluxes and the rate of change in CO2 concentration measured at the height of the EC instrumentation (between 3 and 4 m at all three sites). Positive NEE fluxes indicate a net CO2 loss from the ecosystem. Positive fluxes of H and LE indicate turbulent transport of energy away from the surface.
Air and soil temperature, rainfall, and radiation were measured at all flux towers (see supporting information SI 4 for details). All of these measurements were recorded on data loggers and averaged every 30 min, except rain which was totaled over each 30 m inute period. End of winter snow depth and summer thaw depth was measured with a 40 point survey around each flux tower.
In this study we used measurements made during 2010–2015 between May 1 and Aug 31 of each year. During this period, microclimate measurements were filled using duplicate measurements or established relationships with other available variables. Short gaps of up to one hour in the NEE, H and LE flux time series were filled using linear interpolation. Longer gaps (several hours to days) were filled by relationships with solar radiation and temperature (for NEE) and incoming short-wave and net radiation (for LE and H) adjusted with a moving window through the season (see Humphreys and Lafleur (2011) for more details). There were long (multiple weeks) data gaps caused by instrument failure at the LS site in two of the years. Given the dynamic nature of these ecosystems, gap filling becomes very uncertain over these long gaps, so for analysis we only retained daily statistics for fluxes with at least 8 half hours of quality measurements and/or short gap linear interpolation. On average 34–37 half hours were available for each daily NEE statistic, with 93%, 92%, and 74% daily data coverage at MT, DS, and LS for the 4 month study period over the 6 study years. LE had very similar data coverage as NEE at all three sites, while H had on average 46 half hours per day with 96% daily data coverage at MT and DS and 87% at LS.
Table 2. Average daily albedo for late-winter (late April to beginning of snowmelt) and snow-free (snowmelt until end of August) seasons measured at the EC flux tower. Data were not available at all sites in winter 2013.
| Site | Late-winter | Snow-free | ||||||
|---|---|---|---|---|---|---|---|---|
| 2013 | 2014 | 2015 | Mean (st.dev.) | 2013 | 2014 | 2015 | Mean (st.dev.) | |
| MT | n/a | 0.745 | 0.792 | 0.763a (0.086) | 0.187 | 0.193 | 0.189 | 0.190a (0.046) |
| DS | n/a | 0.758 | 0.813 | 0.779a (0.052) | 0.159 | 0.155 | 0.155 | 0.156b (0.039) |
| LS | n/a | 0.754 | 0.823 | 0.780a (0.069) | 0.151 | 0.152 | 0.149 | 0.151b (0.032) |
Superscripts indicate statistical differences among sites as determined by analysis of variance and post-hoc comparisons. Late-winter and snow-free periods compared separately.
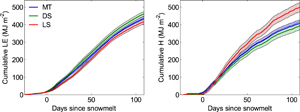
Figure 1. Cumulative LE (left) and H (right, thick lines) and uncertainty (shaded regions) propagated as the square root of the sum of squares of the standard deviation of daily fluxes through the 4 month period for all dates normalized to the average snowmelt date among sites in each year from 2010 through 2015.
Download figure:
Standard image High-resolution imageResults
Environmental conditions during the study
Mean air temperature during the 6 year study period varied from 6.9 °C in 2010 to 10.1 °C in 2012 (table S3). Daily mean temperature normally peaked in mid-July uniformly reaching maximum daily temperatures of 20 °C in each year (table S3). However, warm and cool periods with 8 °C–10 °C differences in average daily temperature could occur at any time during the summer months (figure S4). Total precipitation ranged from 102 mm in 2012 to 191 mm in 2013. Precipitation events were normally <10 mm d−1, but most summers experienced a few large (>25 mm) events (figure S4). Incoming short-wave radiation varied little between years (figure S5). Volumetric soil moisture in the top 15 cm varied little over the growing season and was similar at all three sites (figure S6).
The 6 year mean late-winter snow depth was 29.4 ± 3.3 (s.e.), 36.3 (±3.0) and 57.1 (±2.4) cm at MT, DS and LS, respectively. Snow depth tended to scale almost linearly with the mean height of shrubs at each site (figure S7). In some years, the date when the tundra was snow-free differed by only one or two days among all three sites. In other years, two of the sites would be largely snow-free earlier or later than the third site. For example, in 2015, the snow melt date was May 15 at the DS site and 5–6 days later at LS and MT sites. Although snow melt timing was similar among sites, the snow-free date varied by almost 20 days among years, from as early as May 11 in 2012 to as late as June 03 in 2010 (table S4).
Soil temperatures varied among sites as a result of vegetation cover and snow depth, such that summer maximum temperatures were warmest at the MT site and winter minimum temperatures were warmest at the LS site (figure S8). Late-summer thaw depth at MT and DS was similar with a 6 year average of 86 (±3) and 88 (±2) cm, respectively (figure S9). Thaw depth at the LS site was significantly smaller (56 ± 2 cm). This difference occurred in all study years.
Energy fluxes
Late-winter albedos measured at the EC towers were high, with mean values ranging from 0.76–0.78 and with peak daily values exceeding 0.90 at the three sites. There was no statistical difference in means among the sites. Albedo dropped rapidly during the melt period and reached seasonal low values immediately after snowmelt (figure S10). There was a small increase in albedo during the early part of the growing season in response to leaf out and surface drying. Snow-free season mean albedo was larger (0.19) at the MT site compared to DS and LS (~0.15) and there was little variation between years (table 2).
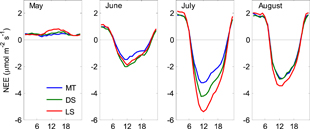
Figure 2. Monthly ensemble average diel NEE when concurrent good quality 30 min flux measurements were available for all three sites in 2010 through 2015.
Download figure:
Standard image High-resolution imageEnsemble trends in cumulative LE and H illustrated negligible differences between MT and DS sites (figure 1). In contrast, by the end of the measurement period LS tundra returned approximately 100 MJ m−2 more sensible heat to the atmosphere than the other sites. Contrary to expectations, LE was approximately the same among all sites, showing no evidence of greater cumulative evapotranspiration with increasing shrub cover. Timing of the start of substantial turbulent energy fluxes to the atmosphere in spring was also the same among the three sites, which was expected given the similar snow melt dates. However, LE at LS was slightly smaller and H slightly greater during the first 3 weeks after snowmelt compared to the other two sites. Sensible heat fluxes remained greater at LS throughout the measurement period while LE increased to values similar to those at DS and MT. Consequently, daily Bowen ratios in the first 3 weeks after snowmelt were 1.9 ± 0.4 (s.d.), 1.4 ± 0.3 and 1.5 ± 0.2 at LS, DS, and MT, respectively. Between 50–80 days post snowmelt (typically July), Bowen ratios were lower at 1.0 ± 0.4 (s.d.), 0.7 ± 0.2 and 0.7 ± 0.2 whereas mean daily LE was 4.5 ± 0.7 (s.d.), 4.5 ± 0.5 and 4.3 ± 0.5 MJ m−2 d−1 at LS, DS, and MT, respectively. The corresponding mid-day bulk surface conductance was similar among sites (6.6 ± 3.6 (s.d.) mm s−1 at LS, 7.0 ± 4.7 mm s−1 at DS and 5.9 ± 3.3 mm s−1 at MT). Bulk conductance at all sites showed large variability within and between years (figure S11).
Tundra-atmosphere CO2 exchange
Monthly patterns of 24 hour NEE illustrate the dynamic nature of CO2 exchange in the Arctic (figure 2). During the month of May, the tundra is usually snow covered or recently snow-free (mean snow-free date for all sites in all study years was 23 May, table S4), with little or no photosynthesis occurring, resulting in a persistent loss of CO2 to the atmosphere. Slightly greater losses occurred at the LS site. With leaf out beginning in June, all sites exhibited a distinct diurnal cycle of nighttime losses and daytime uptake, with only slightly smaller daytime uptake occurring at MT site. July was the warmest month with maximum tundra-wide leaf expansion/LAI increase. The diel cycle of NEE at all sites had the greatest amplitude at this time. In addition, the site with the greatest shrub abundance (LS) had more negative NEE during the day indicating greater CO2 uptake and slightly more positive at night indicating higher CO2 loss. Differences in peak daytime NEE were closely associated with percent cover at each site. July daytime NEEmax for MT and DS as a percent of NEEmax for LS was 60% and 78%, respectively. Equivalent values for nighttime fluxes (i.e. ER) were 84% and 88% for MT and DS, respectively. Daytime net CO2 uptake declined at LS and DS sites in August resulting in little difference in peak daytime NEE among the three sites. Soils in August remained fairly warm, hence nighttime NEE losses showed little variation between July and August.
Ensemble cumulative NEE patterns showed LS had greater CO2 losses immediately after snowmelt, but stronger growing season CO2 uptake compared to the other two sites (figure 3). Cumulative losses after snowmelt at DS and MT were similar in magnitude and reached about 70% of the maximum cumulative loss at LS. However, as growing season began and daily NEE became negative (CO2 uptake) the cumulative curves for MT and DS diverged, with stronger growing season uptake at DS. The total cumulative NEE over 135 days (25 days pre-snowmelt and 110 post-snowmelt) was −60 ± 6 g C m−2, −55 ± 6 g C m−2 and −30 ± 5 g C m−2 at LS, DS and MT, respectively.

Figure 3. Cumulative NEE (thick lines) and uncertainty (shaded regions) propagated as the square root of the sum of squares of the standard deviation of daily fluxes the 4 month period for all dates normalized to the average snowmelt date among sites for each year from 2010 through 2015.
Download figure:
Standard image High-resolution image
Discussion
Results from this field study show contrasting support for current lines of thinking about feedbacks to atmospheric heating resulting from increasing Arctic shrub cover. Chapin et al (2005) suggested that a small positive albedo feedback from shrub expansion would significantly impact summer warming, while others have suggested that the spring differences have a larger effect on regional climate (Bonfils et al 2012). Contrary to regional satellite-derived albedos (Loranty et al 2011), we found no difference in snow-covered (late-winter/spring) albedo among our sites. One reason for this is that at a local scale snow depth is influenced by wind redistribution and the vegetation canopy height (Pomeroy et al 2006). The shrubs at Daring Lake are relatively flexible leading to similar levels of vegetation burial and late-winter albedo among the sites. This situation has also been observed by others (Sturm et al 2005a). In addition, the Daring Lake shrubs are not tall. The average shrub height of about 60 cm at LS is considerably smaller than the 2 m canopy height set for low shrub tundra in the Bonfils et al (2012) modeling study. Such tall shrubs are more common in the warmer and moister areas of west Siberia and deltaic environments (Walker et al 2005), as well as along watercourses and protected exposures. Sturm et al (2005a) noted that for tall shrub canopies with stiff, thick-stemmed branches that did not get buried by snow in winter, albedo was 30% lower and snow melt was initiated earlier but did not proceed as quickly compared with shorter more flexible canopies. At the Daring Lake end-of-winter snow depth is closely related to shrub height (figure S7). As there were no differences in late-winter albedo among sites and snow melt dates were similar, we suggest greater rates of snow melt with increased shrub height. This is consistent with Marsh et al (2010), who explained similar findings by noting the influence 'spring-up' of the shrubs had during melt, while shrub branches reduce turbulent transfer and shortwave radiation at the snow surface, but increased longwave radiation with the overall result of enhancing melt.
Summer albedos are affected by shrub cover in our study, but the effect does not scale linearly with percent shrub cover. According to the analysis in Chapin et al (2005) the 0.03–0.04 difference in mean snow-free albedo between MT and DS/LS sites suggests that even a modest expansion of shrubs onto non-shrub tundra would have a significant positive effect on atmospheric heating. The sum of H and LE was indeed greater at the LS site, driven entirely by greater H through the summer months. Negligible differences in cumulative LE indicate that evapotranspiration did not increase with shrub greater cover. Similarly, McFadden et al (1998, 2003) found that evapotranspiration was not different between shrub and heath tundra sites, with all sites except the wettest ones having daily averages similar to the July means from our study. Similar cumulative LE at the LS site, despite greater LAI and shrub cover, potentially arises through a set of compensatory factors. For example, more transpiration could be expected as a result of the higher LAI, however, Arctic shrubs are known to conserve water loss by reducing stomatal conductance under high vapor pressure deficit, despite the fact they often grow in wet environments (Blanken and Rouse 1996). At the same time the shrub overstory can limit both radiation penetration and turbulent exchange at the moss surface to reduce below-canopy evaporation rates and if the surface moss layer at LS dries in summer, it acts as an effective barrier to any soil surface evaporation (Kurbatova et al 2002, McFadden et al 2003). The MT and DS sites have lower LAI with less moss ground cover, hence soil surface evaporation is likely more important at these sites and would increase with rising vapour pressure deficits. It is likely that as a result of these compensating factors bulk conductance did not vary greatly among our sites.
Greater (negative) summer NEE with increasing shrub cover, as found here, is consistent with previous comparisons of CO2 fluxes from Arctic tundra. McFadden et al (1998) compared mid-summer CO2 fluxes for five different tundra types and found the magnitude of daytime NEE at a shrub site (LAI = 1.45) to be greater than heath and sedge tundra NEE, but smaller than for tussock tundra types. In a more extensive comparison, McFadden et al (2003) observed mean mid-summer net CO2 uptake was greatest for shrub tundra sites (LAI 0.73–1.75) across a broad range of tundra ecosystems. In our study, cooler soils with less thaw may have limited heterotrophic respiration losses of CO2 at the site with greatest shrub cover. However, it is likely that the corresponding increase in LAI with increasing shrub cover at our sites is most responsible for the differences in NEE. LAI is strongly correlated with tundra photosynthesis (Street et al 2007) and NEE (McFadden et al 2003, Laurila et al 2001). The increase in net CO2 uptake with LAI is also consistent with Shaver et al's (2007) proposition that tundra displays strong functional convergences, such that after accounting for variations in climate (temperature and light, which were controlled in this study by proximity of the sites) LAI is the main determinant of spatial variation in NEE on Arctic tundra.
Conclusions
Our data suggest that the feedback to the atmosphere from increasing shrub cover would be negative for CO2 but positive for turbulent energy fluxes. There is, however, a cautionary note to the CO2 feedback. Our study, and many others, considered the snow-free period only. Gains in CO2 sequestration during these 4 months may be offset through the fall and winter with enhanced losses. Recent year-round NEE measurements at Arctic sites suggest that the winter C loss may be equivalent or even larger than the summer uptake, hence turning these systems into annual CO2 sources (Euskirchen et al 2012, Oechel et al 2014). Despite such uncertainty, the long-term impact on the C currently stored in tundra ecosystems resulting from vegetation change is important to consider. Model studies have suggested that the positive feedbacks from shrub expansion (albedo, ET and snow cover) will offset any summer cooling effect on soils and instead result in deeper thaw depths and permafrost loss (Lawrence and Swenson 2011, Bonfils et al 2012). One consequence of warmer soils and deeper thaw depths could be increased microbial decomposition and release of C to the atmosphere (Schuur et al 2008), which would decrease the C sink strength of Arctic tundra and amplify future climate warming.
Two recent modeling studies suggest that the LE feedback from shrub expansion will be strongly positive, i.e. greater transpiration rates from shrub cover increase atmospheric water vapour concentrations, which enhance downward longwave radiation and, subsequently, surface heating (Swann et al 2010, Bonfils et al 2012). Pearson et al (2013) also show that an increase in woody vegetation cover by up to 52% by 2050s at high northern latitudes will result in an overall positive feedback to climate although increases in evapotranspiration are minor compared to net shortwave radiation. Our results suggest there is no change in LE with increased shrub cover and instead a positive atmospheric heating effect through lower albedo and enhanced H. The discrepancy between the modeling results and our observations may lie in the model characterization of deciduous shrub traits, such as maximum stomatal conductance. Given that shrub expansion onto tundra is a well-documented phenomenon and is expected to continue into the latter half of this century, resolving the discrepancy between field measurements and model results should be a priority issue for Arctic science.
Acknowledgments
This research was funded through the Natural Science and Engineering Council of Canada. We are grateful to Steve Matthews and Karin Clark and the Daring Lake Terrestrial Ecosystem Research Station for logistical support. We thank our graduate and undergraduate students for assistance in the field and technical assistance from Michael Treberg and Robbie Hember.