

Abstract
Our results from playas, which are topographic low areas situated in closed-catchments in drylands, indicated that projected climate change in Southwestern USA would have a net positive impact over runon and groundwater recharge beneath playas. Expected increased precipitation variability can cause up to a 300% increase in annual groundwater recharge beneath playas. This increase will overshadow the effect of decreased precipitation amount that could cause up to a 50% decrease in recharge beneath playas. These changes could have a significant impact on groundwater and carbon storage. These results are important given that groundwater resources in Southwestern USA continue to decline due to human consumption outpacing natural recharge of aquifers. Here, we report on groundwater recharge rates ranging from less than 1 mm to greater than 25 mm per year beneath desert playas. Playas located in larger and steeper catchments with finer-textured soils had the highest rates of recharge. Vegetation cover had no effect on recharge beneath playas. We modeled catchment runoff generation and found that the amount of runon a playa receives annually strongly correlated to the rate of groundwater recharge beneath that playa. Runon occurred during precipitation events larger than 20 mm and increased linearly with events above that threshold.
Export citation and abstract BibTeX RIS
1. Introduction
Groundwater supplies ~40% of the agricultural and residential water needs in Southwestern United States of America (USA), which occupies 1.8 M km2 and ~20% of the USA (Maupin et al 2014). Consumption of groundwater in this large region continues to increase due to demand from growing populations (Sabo et al 2010). Concurrently, increasing drought frequency and intensity have decreased the reliability of surface water for human consumption (MacDonald 2010). Increased demand has outpaced recharge rates and caused groundwater storage to decline. Consequently, the lifespan of some aquifers in dryland regions of the USA is as short as 100 years (Scanlon et al 2012) and active groundwater banking during high-magnitude flow periods is one proposed solution for recharging dryland aquifers (Tiffany and Helen 2017). Groundwater recharge in drylands is limited to areas that receive surface-water runon such as ephemeral streams and lowland areas because wetting depth in upland ecosystems rarely goes beyond 100 cm (Sala et al 1992) and, in some cases, water-restrictive soil layers constrain percolation (Scanlon et al 2006).
Playas are wetlands located in the topographic low areas of hydrologically-closed catchments (Shaw and Bryant 2011). Playas can be categorized into two types determined by the source of their flood-water: groundwater playas and surface-water playas (Rosen 1994). In this paper, we focused solely on surface-water playas, which flood by precipitation and runon generated from upland areas during large rainfall events. We focused on surface-water playas because they are the only ones that have the potential to recharge ground water. In the Basin and Range physiographic province of Southwestern USA, the biophysical characteristics of the upland catchments that surround playas control differences in soil organic carbon and nutrient concentrations among playas (McKenna and Sala 2016). Playas found in the largest, steepest, and most highly-vegetated catchments contain the highest concentrations of soil carbon and nitrogen (McKenna and Sala 2016). These findings are indicative of the importance of surface-water runon in playa systems. Rare but important deluges of water may overwhelm playa soils and recharge groundwater (Scanlon et al 2006).
The most recent climate-change projections from the 2014 US National Climate Assessment were based on the 'Coupled Model Intercomparison Project phase 5' (CMIP5) (Wuebbles et al 2014). CMIP5 predicted changes in climate for different atmospheric CO2 concentration scenarios called representative concentration pathways (RCPs). In these scenarios, increased atmospheric CO2 concentrations will directly increase atmospheric temperatures that will influence precipitation in Southwestern USA in two ways: (1) increasing inter-annual variability and (2) decreasing the amount of annual precipitation (Melillo et al 2014). Increased atmospheric temperatures are predicted to increase the size of large precipitation events and decrease the size of small precipitation events (Sun et al 2007). Increased inter-annual precipitation variability has been shown to increase plant-available water availability in dryland ecosystems (Sala et al 2015). Despite these findings, the current consensus is that groundwater recharge in western USA is likely to decrease due to climate change (Meixner et al 2016).
The objectives of this work were to assess the rates and controls of recharge beneath playas in Southwestern USA and closing the well-documented knowledge gap pertaining to the effect of climate change on groundwater recharge in desert ecosystems (Scanlon et al 2006, Gurdak and Roe 2010). Our study specifically addressed three questions about controls of playa groundwater recharge and the effects of future climate change. (1) How much do playas contribute to groundwater recharge in Southwestern USA? To answer this question, we empirically estimated groundwater recharge beneath a subset of playas in the Jornada del Muerto aquifer, which is a representative area of the Basin and Range physiographic province. (2) How do the upland biophysical characteristics of a catchment above playas influence groundwater recharge beneath playas? To address this question, we used remotely sensed data to measure elevation along with soil and vegetation characteristics of each playa catchment and analyzed relationships between upland catchment characteristics and playa recharge rates. (3) How will climate change influence groundwater recharge beneath playas through changes in precipitation variability and amount? To answer this question, we first modeled playa runon events from a recent 20 year period and determined how runon controls groundwater recharge beneath playas. We used those modeling results to determine how the size of precipitation events controls playa-runon generation. We created two new 20 year rainfall time series in accordance with climate-change predictions of both increased precipitation variability and decreased precipitation amount. Finally, we used our best-fit runon-recharge relationship to assess how groundwater recharge beneath playas will change under different climate-change scenarios. Due to the water-limited nature of Southwestern USA, we only focused on how changes in precipitation, not evapotranspiration, could affect playa-mediated groundwater recharge (Newman et al 2006).
2. Methods
2.1. Study Site
We conducted both the empirical and modeling components of this study at the Jornada Basin long-term ecological research site (JRN). This site is located near Las Cruces, NM, USA (+32.5 N, −106.8 W, elevation 1188 m) and contains all of the ecosystem types and geomorphic landforms that are typical for systems in the Basin and Range province (Peters and Gibbens 2006). JRN is situated above the Jornada del Muerto aquifer with mean annual precipitation of 237 mm yr−1. (figure 1). The Jornada LTER is composed of two grassland and three shrubland ecosystem types and average temperature of 24 °C. The grassland ecosystems are upland Black Grama grasslands (Bouteloua eriopoda) and lowland playa grasslands co-dominated by Tobosa grass (Pleuraphis mutica), Alkali Sacaton (Sporobolus airoides) and Vine-mesquite grass (Panicum obtusum). The shrubland ecosystems are: Tarbush (Flourensia cernua) on lower piedmont slopes, Creosotebush (Larrea tridentata) on upper piedmont slopes and bajadas, and Honey Mesquite (Prosopis glandulosa) on the sandy basin floor (Peters 2013).

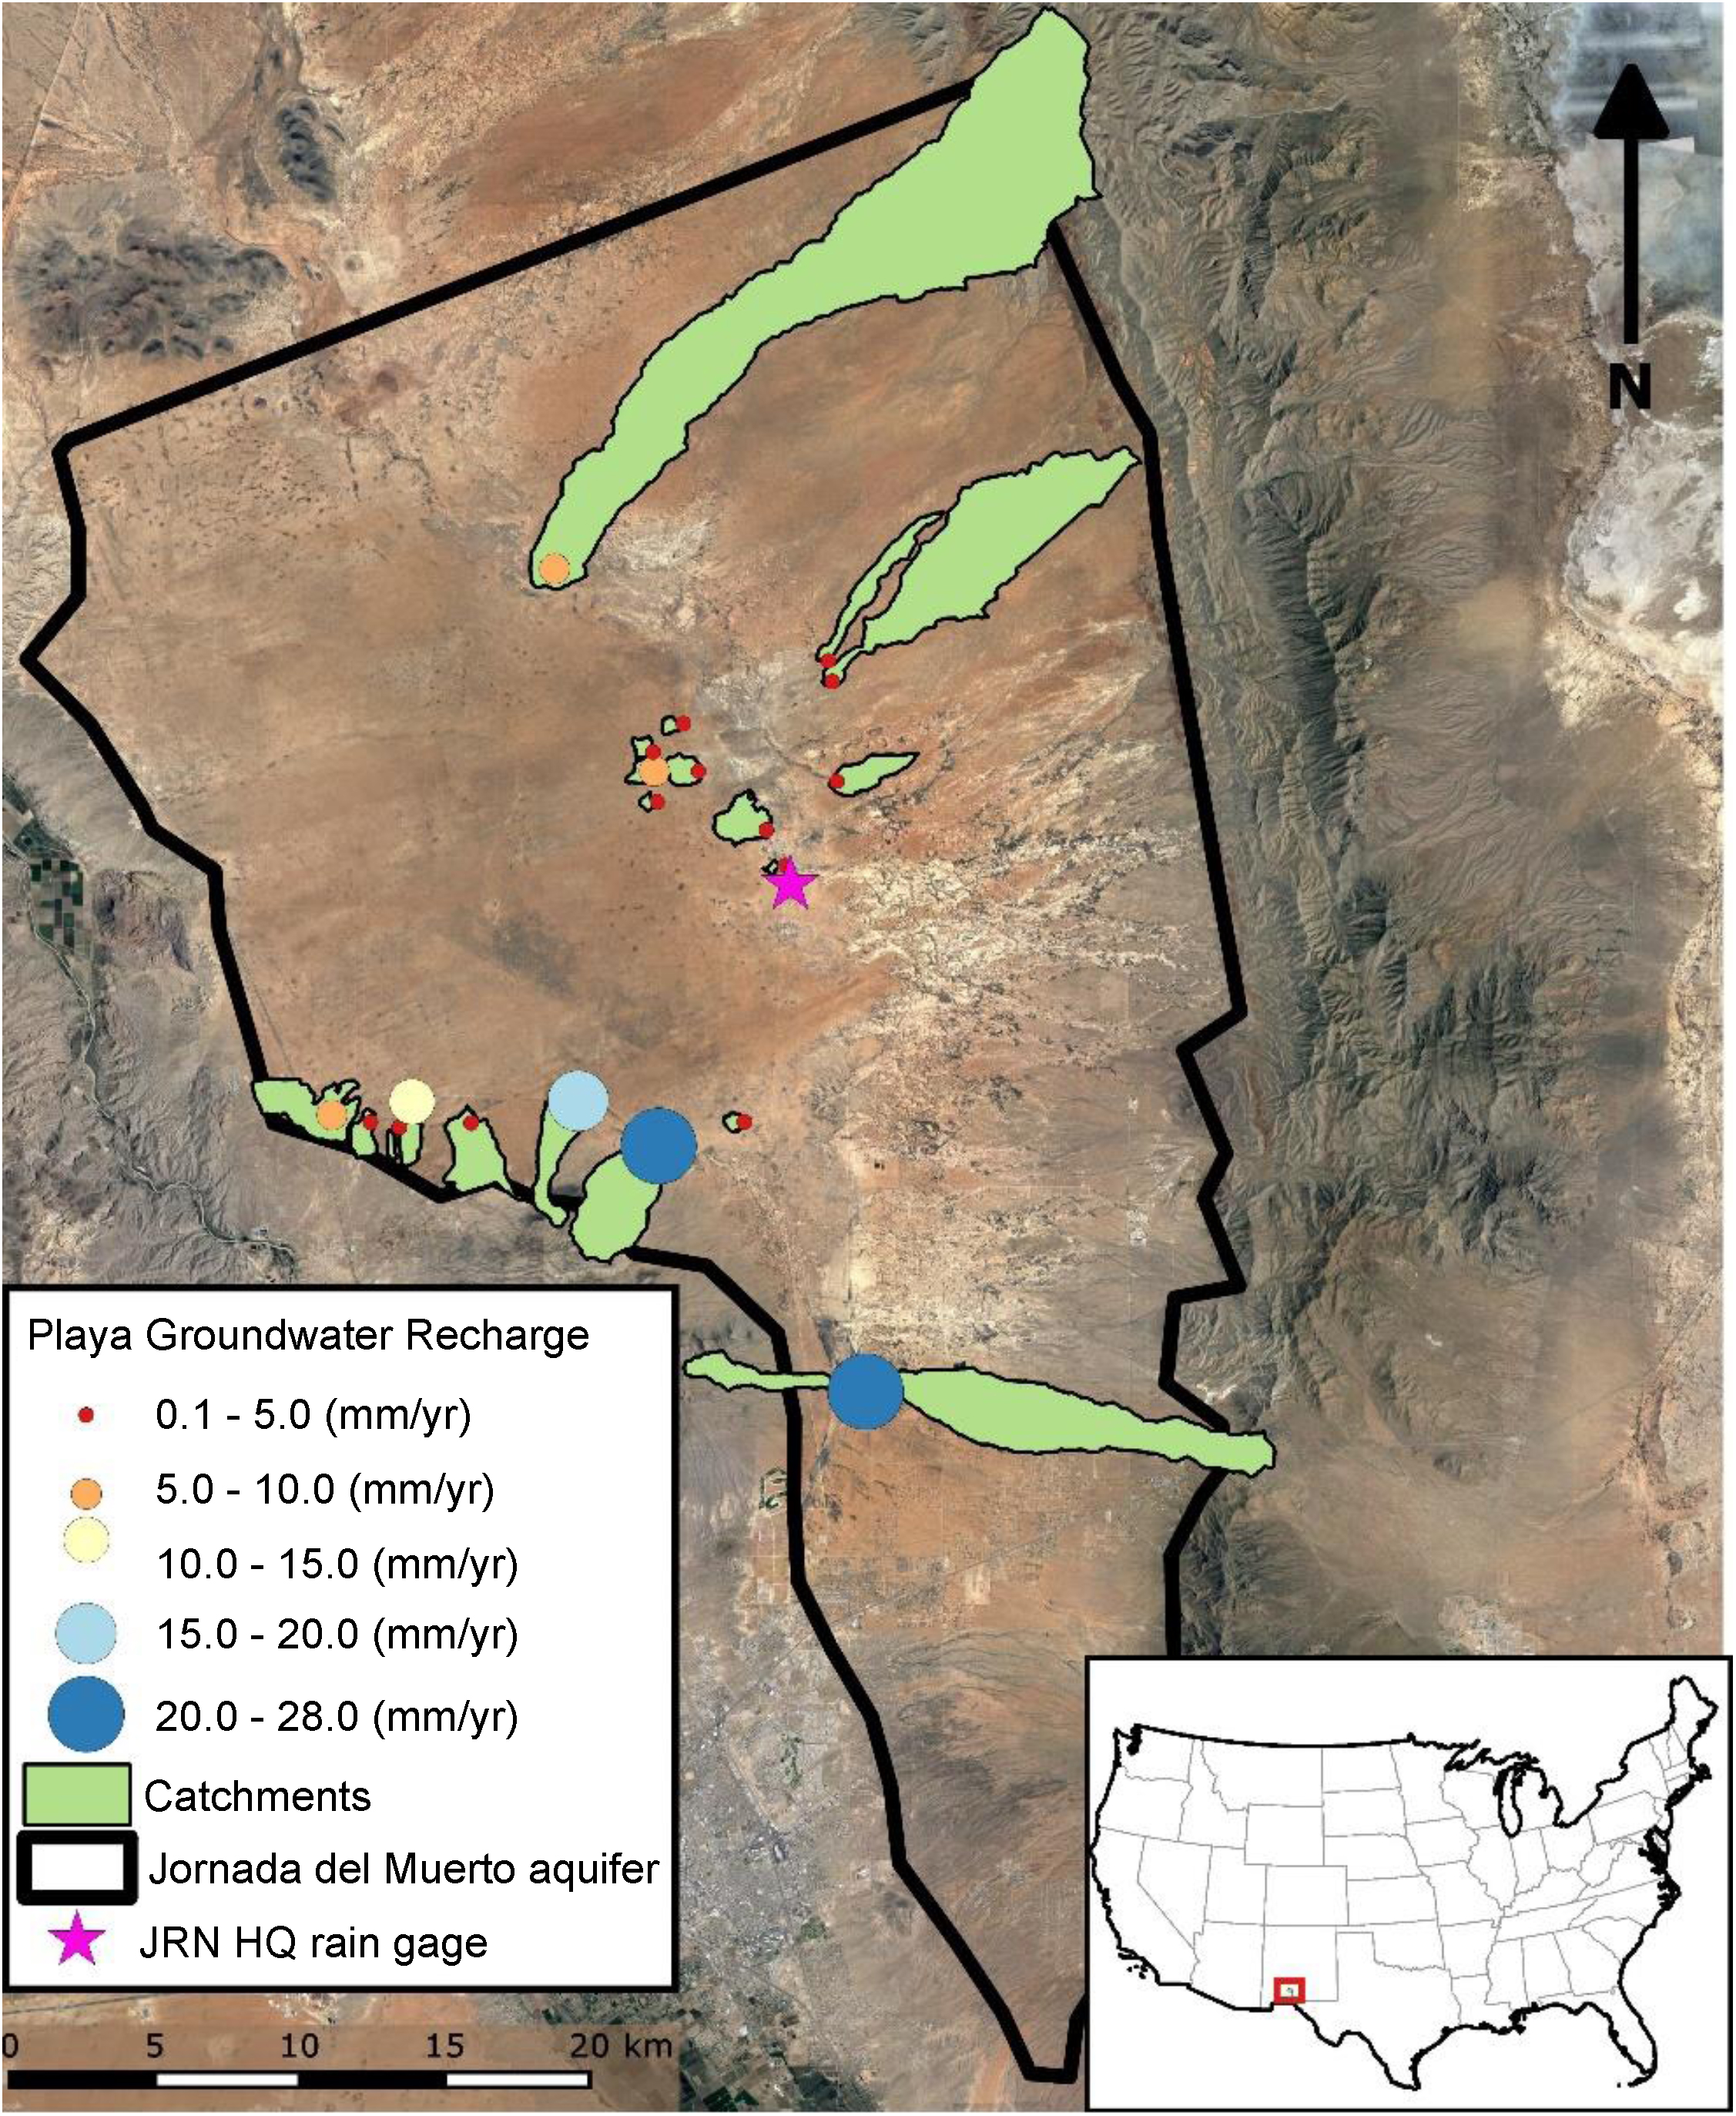
Figure 1. Spatial distribution of playas and catchments over the southern Jornada del Muerto aquifer in SE New Mexico, USA. The southern Jornada del Muerto aquifer is represented by the black outline. Jornada HQ rain gage location is represented with the pink star. Green polygons represent playa catchment location and extent and circles represent playa location. Circle color and size corresponds to the magnitude of recharge measured beneath each playa. Site location with USA is represented by the red box in the bottom right corner insert map. Aerial imagery provided by Global TruEarth® 15 meter imagery, August 15, 2015.
Download figure:
Standard image High-resolution imageThere are 100 playas that account for ~1% of JRN area (Gibbens et al 2005). Playa catchments are the upland drainage areas that contain grassland and shrubland ecosystem types. Playas in this region experience periodic flooding (Peters et al 2012) and they are the only known areas that do not contain water-restrictive petrocalic horizons (Havstad et al 2006). Playa soils are well-mixed vertisol soils that are high in clay content and contain Holocene aged lacustrine deposits of the derived mainly from monzonite, rhyolite, and andesite (Wondzell et al 1990).
2.2. Estimating groundwater recharge beneath playas
We used the chloride mass balance (CMB) approach to empirically estimate groundwater recharge rates beneath playa surfaces (Wood and Sanford 1995). CMB is the most common method for estimating groundwater recharge in unsaturated soil zones (Allison and Hughes 1978, Scanlon 1991). Although other more resource intensive tracer methods can be used, CMB is commonly used on its own to estimate groundwater recharge (Scanlon et al 2006, Gates et al 2008, Gurdak and Roe 2010). Scanlon et al (2006) provided many examples of estimating recharge with CMB well above the water table and assuming downward vertical flow of groundwater beneath the rooting zone. This approach was relevant to our study because of the thick (>10 m) unsaturated zone in the Jornada Basin (Havstad et al 2006). Surface inputs of chloride (Clp) (mg l−1) and precipitation (P) (mm yr−1) are balanced by the mass out beneath the playa via chloride in the unsaturated zone (Cluz) (mg l−1) and deep percolation that results in groundwater recharge (R) (mm yr−1) (equation (1)). We calculated recharge by solving equation (1) for R (equation (1)).
We collected one continuous 5 m soil core in the unsaturated zone from the center-low point of each study playa (n = 20). We sampled at the lowest topographic point of each playa, because this area is flooded most-frequently (Gurdak and Roe 2010, McKenna and Sala 2016). We collected each core in August 2014 when playas were not flooded. We took five 100 g soil samples from below the core at 1 m increments (1–5 m). Soils were homogenized and 3 subsamples were taken from each 1 meter depth. We combined gravimetric water content (g g−1) with soil bulk density (g m−3) measurements (Elliot et al 1999) to calculate volumetric soil water content. Cl− was measured (mg l−1) using an ion selective electrode. We measured average soil Cl− from across 1–5 m depths for each playa (figure S3). To calculate recharge with the CMB method, we used values of annual precipitation and wet and annual dry deposition values from JRN data. We calculated mean annual precipitation from the 100 year record (1914–2015) of the centrally located Jornada weather station (figure 1). We calculated annual rates of wet and dry Clp deposition (mg l−1) using a 30 year record (1983–2013). Wet and dry deposition of Clp were measured monthly at the same centrally located weather station using AeroChem Metrics collector (Havstad et al 2006).
Each playa served as an independent unit for our statistical analyses. Under this framework, adding more samples per playa would not have improved the statistical power. Taking several samples per playa and using them as independent replicates would have violated the independence criterion of multiple regression (Kutner 2005).
2.3. Characterizing catchment-biophysical variables
We used remotely sensed data to measure catchment biophysical characteristics for each of the study catchments. We defined a playa catchment as the upland area that drains into the playa. A playas catchment does not include the playa itself. We used Normalized Difference Vegetation Index (NDVI) data derived from 250 m2 resolution satellite Moderate Resolution Imaging Spectroradiometer (MODIS) to calculate average vegetation cover, specifically we used the vegetation continuous fields MOD44B product. Digital soil maps were used to estimate an average soil texture for each playa catchment (Soil Survey Staff 2016). We measured the area and slope of each catchment by analyzing 5 m digital elevation model (DEM) data from http://jornada.nmsu.edu/lter/data/spatial. We used multiple regression analysis to assess correlations between biophysical catchment characteristics and groundwater recharge in playas. All analyses were conducted using R version 3.0.2 (R 2016). The best-fit-model was chosen using Akaike information criterion (AIC) (Kutner 2005).
2.4. Modeling climate change impacts on playa recharge
We used the Limburg Soil Erosion Model (LISEM) (De Roo et al 1996) to simulate playa runon for 20 playa catchments over a 20 year period. LISEM is a well-known hydrologic model that has been successfully used to simulate runoff for a variety of catchments around the world (Cuomo et al 2015). This model has been used to simulate runoff during and immediately after rainfall events in dryland catchments from 0.1–100 km (De Roo and Jetten 1999, Hessel et al 2006, Baartman et al 2012). Runoff, infiltration, and interception were calculated in LISEM using data from spatially distributed soil, vegetation, and elevation maps for each catchment (De Roo et al 1996). Runoff occurs as infiltration excess Hortonian overland flow (Baartman et al 2012). Dry streambeds act as preferential flow paths for delivering upland runoff to playas (Havstad et al 2006). Catchment maps were created using PCRaster (Schmitz et al 2014). We calculated soil-physical characteristic using soil texture from (Soil Survey Staff 2016), and literature values (Rawls et al 1983). Saturated conductivity (mm hr−1), soil water tension (cm), and saturated volumetric soil moisture content for each soil type were derived from literature (Rawls et al 1989). Initial volumetric soil moisture values were gathered from monthly JRN soil moisture values (1979−1989) (Nash et al 1991). Literature values were used for Manning's surface resistance (n), random roughness coefficients, and vegetation height (cm) (Weltz et al 1992). We modeled playa runon using JRN hourly precipitation record 1992–2011. Throughout those 20 years, there were 560 unique rainfall events above 1 mm in size (figure S1 available at stacks.iop.org/ERL/13/014025/mmedia). To validate the model, we compared outputs of runon to observed playa flood volume for 14 rainfall events (figure S2). We then ran the model for all 560 rainfall events from 1992–2011.

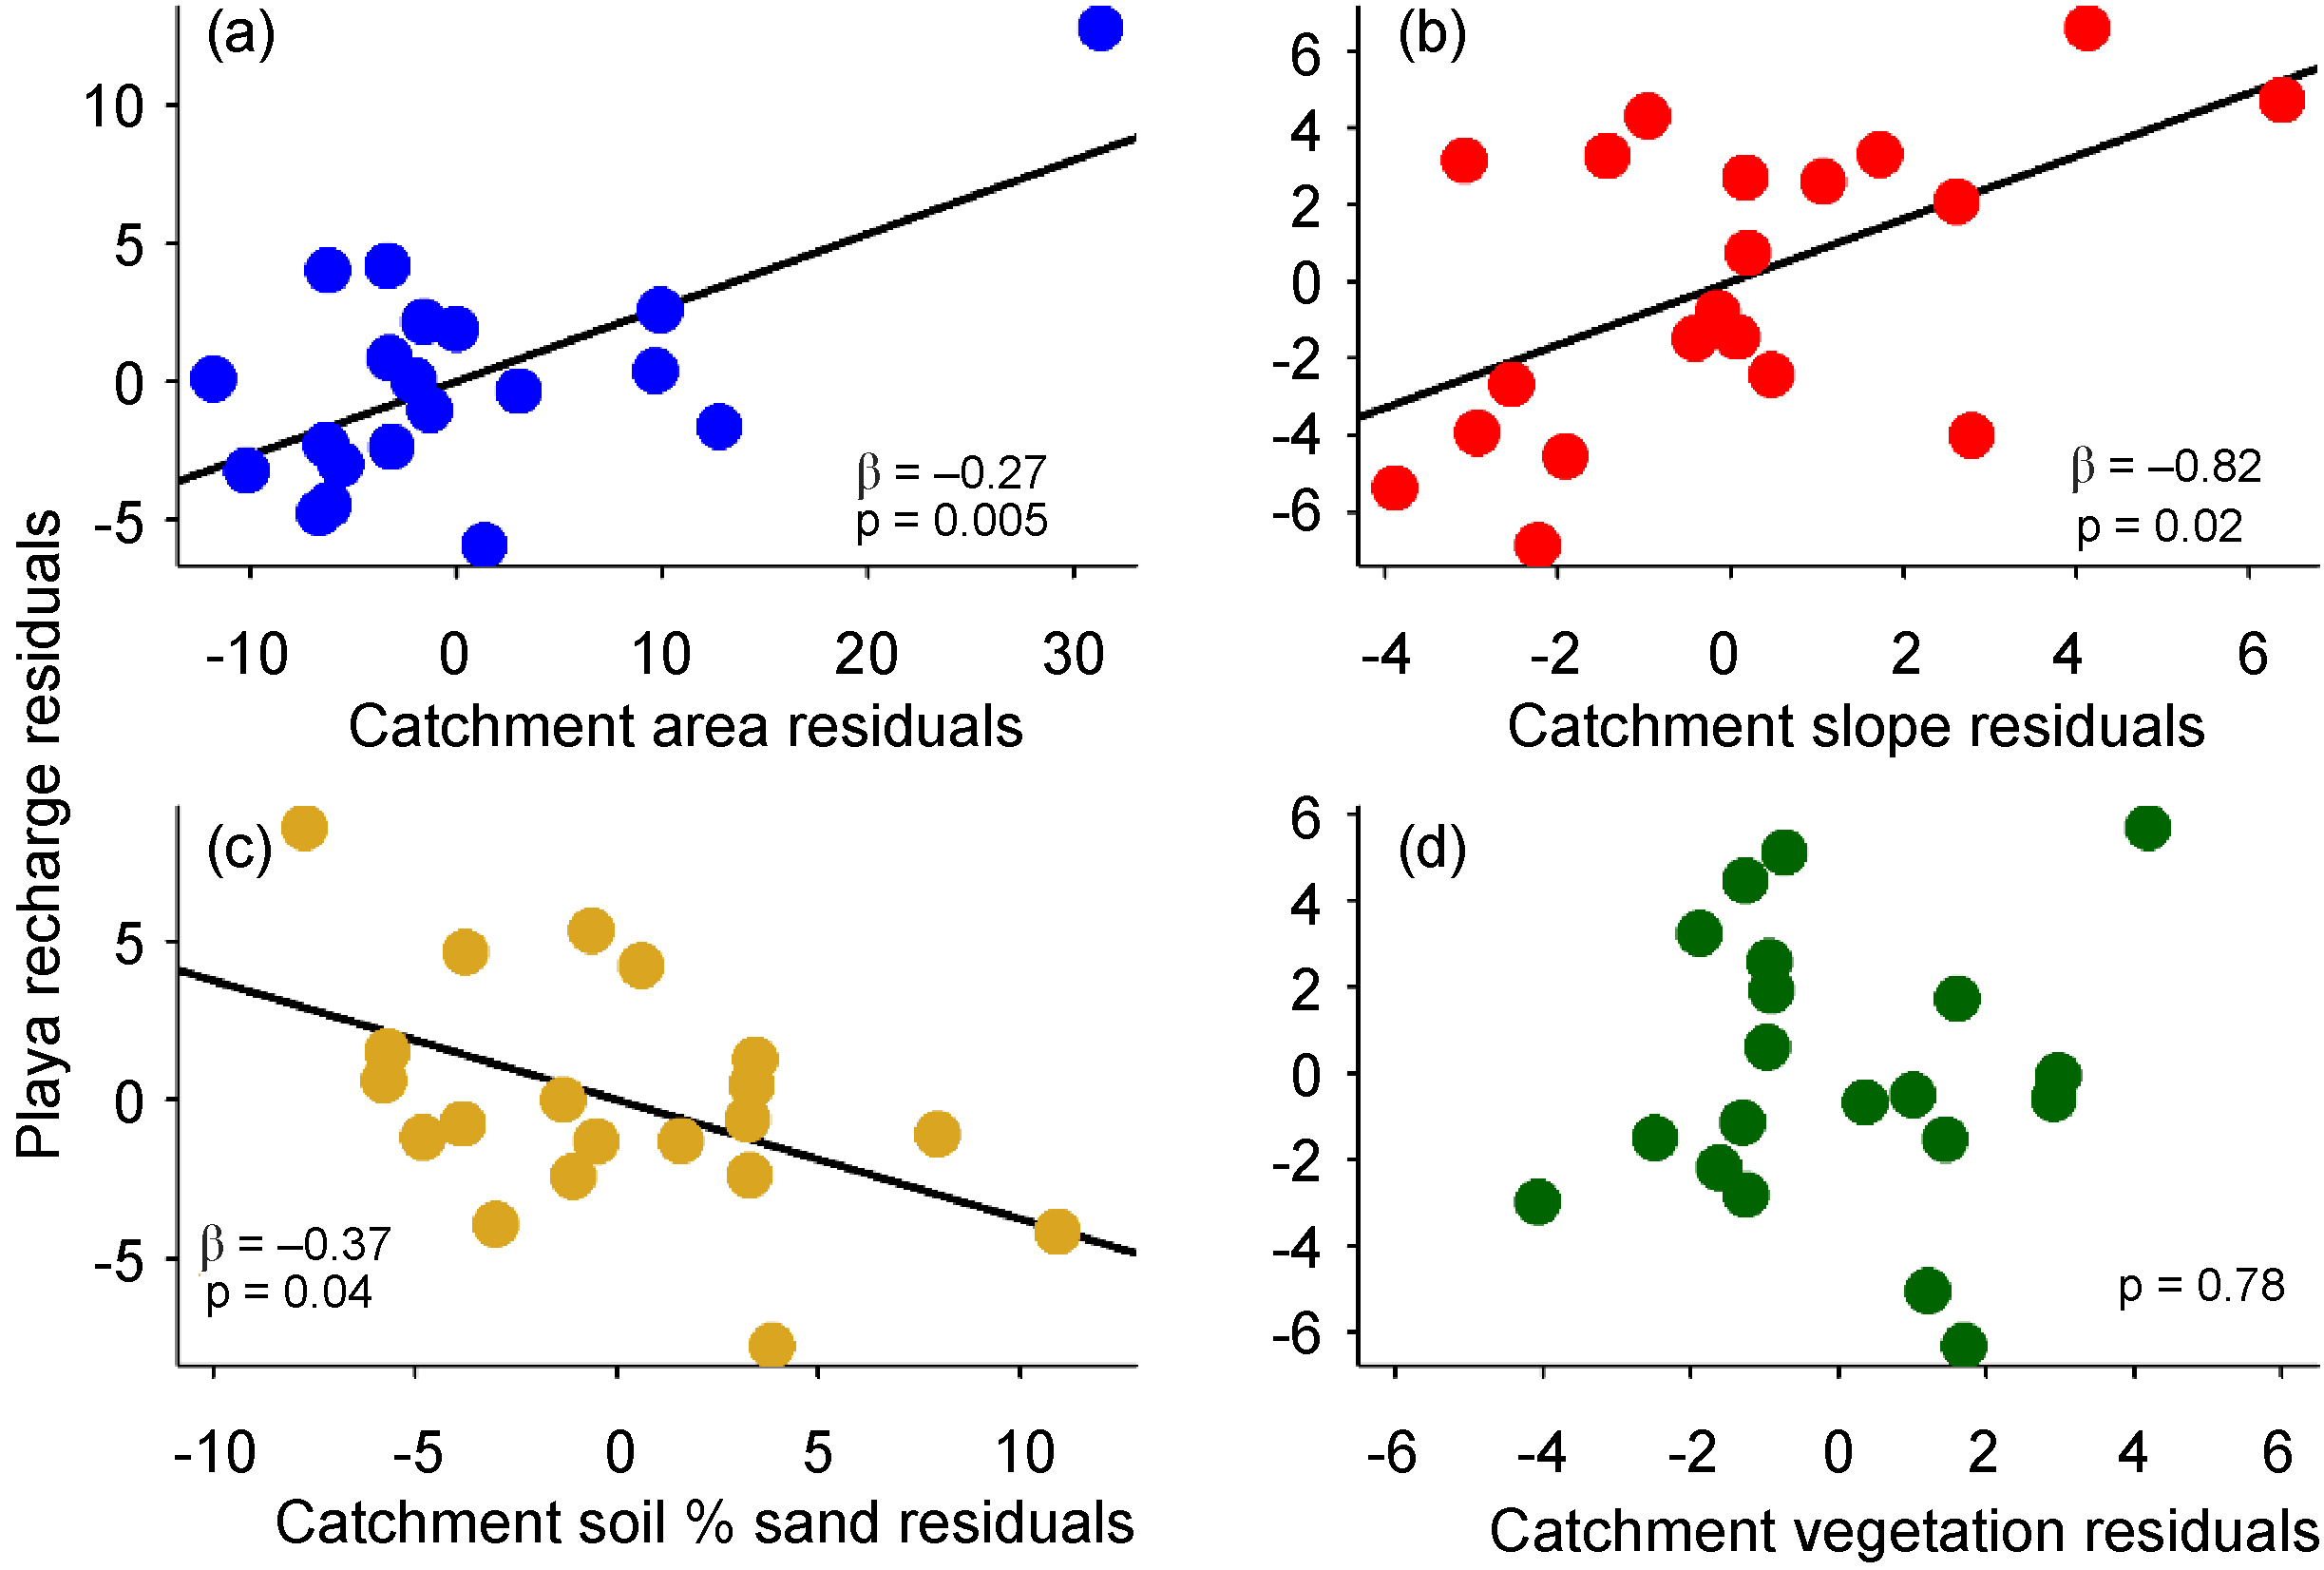
Figure 2. Pair-wise relationships derived from multiple regression analysis of each catchment biophysical variable and playa groundwater recharge. Panels (a), (b), and (c) are from the best-fit regression models, and panel (d) is from the full model. Partial regression plots were constructed by first regressing the explanatory variable of interest (e.g. catchment vegetation) against all other explanatory variables (e.g. catchment soil texture, slope and area) of the regression model. Next, the response variable (groundwater recharge) was regressed against all other explanatory variables (e.g. catchment soil texture, slope and area). The residuals of those two regressions (e = Yexpexted–Yobserved) were then plotted against each other to partial out the effect of each explanatory variable on the response variable. Each panel shows the partial regressions for all of the explanatory variables: catchment area (blue), catchment slope (red), catchment soil texture (yellow) and catchment vegetation cover (green). Black trend lines represent the best-fit model for each partial regression. The best-fit model for explaining groundwater recharge was: Groundwater recharge (mm yr−1) = 29.82 + 0.27⁎catchment area (ha) + 0.82⁎catchment slope (% rise) −0.38⁎catchment soil texture (% sand).
Download figure:
Standard image High-resolution imageAfter modeling runon from recent-past precipitation events, we independently evaluated the effect of increased precipitation variability and decreased mean annual precipitation. We used predictions of both precipitation variability and amount from three different CMIP5 representative concentration pathways (RCPs) (Wuebbles et al 2014). We manipulated the 560 rainfall events from our historical 20 year record and generated a new 560 event series for RCP 4.5, RCP 6.0, and RCP 8.5 scenarios. We chose a range of emission scenarios to document the largest potential effects on rainfall-runoff-recharge rates. Using modeled relationships from Sun et al (2007), we decreased 0–10 mm events (n = 406) by 2% per °C increase. We increased 10–20 mm events (n = 99) by 5%, 20–50 mm events (n = 53) by 6%, and >50 mm events (n = 1) by 7% per °C increase. These changes maintained mean annual precipitation constant and increased the standard deviation and mean event size (table S1). For this region, global circulation models predict precipitation amount to decrease 2% per °C increase in atmospheric temperature (Pierce et al 2013). To simulate a decrease in mean precipitation for RCPs, we reduced the size of all precipitation events accordingly. We used regression analysis to determine the relationships between playa groundwater recharge (mm yr−1) and modeled runon (m yr−3), as well as the playa runon (m event−3) and precipitation event size (mm event−1). We used the rainfall-runon and runon-recharge regression models to calculate how changes in both precipitation variability and mean precipitation amount affect recharge underneath playas.
3. Results
3.1. Playa groundwater recharge rates
Our empirical estimates of recharge showed evidence of groundwater recharge in the unsaturated zone beneath playas (figure 1) (table S2 and figure S2). We estimated groundwater recharge occurring beneath 100% of the sampled playas (figure 1). The average recharge of playas was 6 mm yr−1, which was 2% of the annual rainfall for the study area. Recharge beneath playas ranged from 0.10–28 mm yr−1, and 65% of the playas sampled had recharge rates below 5 mm yr−1 (figure 1). Recharge rates higher than 15 mm yr−1 occurred only in 15% of playas (figure 1).
3.2. Biophysical controls over groundwater recharge rates
We found that differences in groundwater recharge rates among playas were correlated to the size, slope, and soil texture of each catchment (R2 = 0.78, p < 0.001, AIC = 53.6). Recharge rate increased with area and slope, and decreased with percent sand of a catchment (figure 2). We found the best-fit model for predicting groundwater recharge to be: Groundwater recharge (mm yr−1) = 29.82 + 0.27⁎catchment area (ha) + 0.82⁎Catchment slope (% rise) −0.38⁎catchment soil texture (% sand). Catchment vegetation cover was not significantly correlated to playa groundwater recharge. These results suggest either vegetation cover did not physically affect runoff production or the range of vegetation cover in catchments existing in our study site was not large enough to capture the physical effect of vegetation on runoff production.
3.3. Climate change impacts on playa runon and recharge
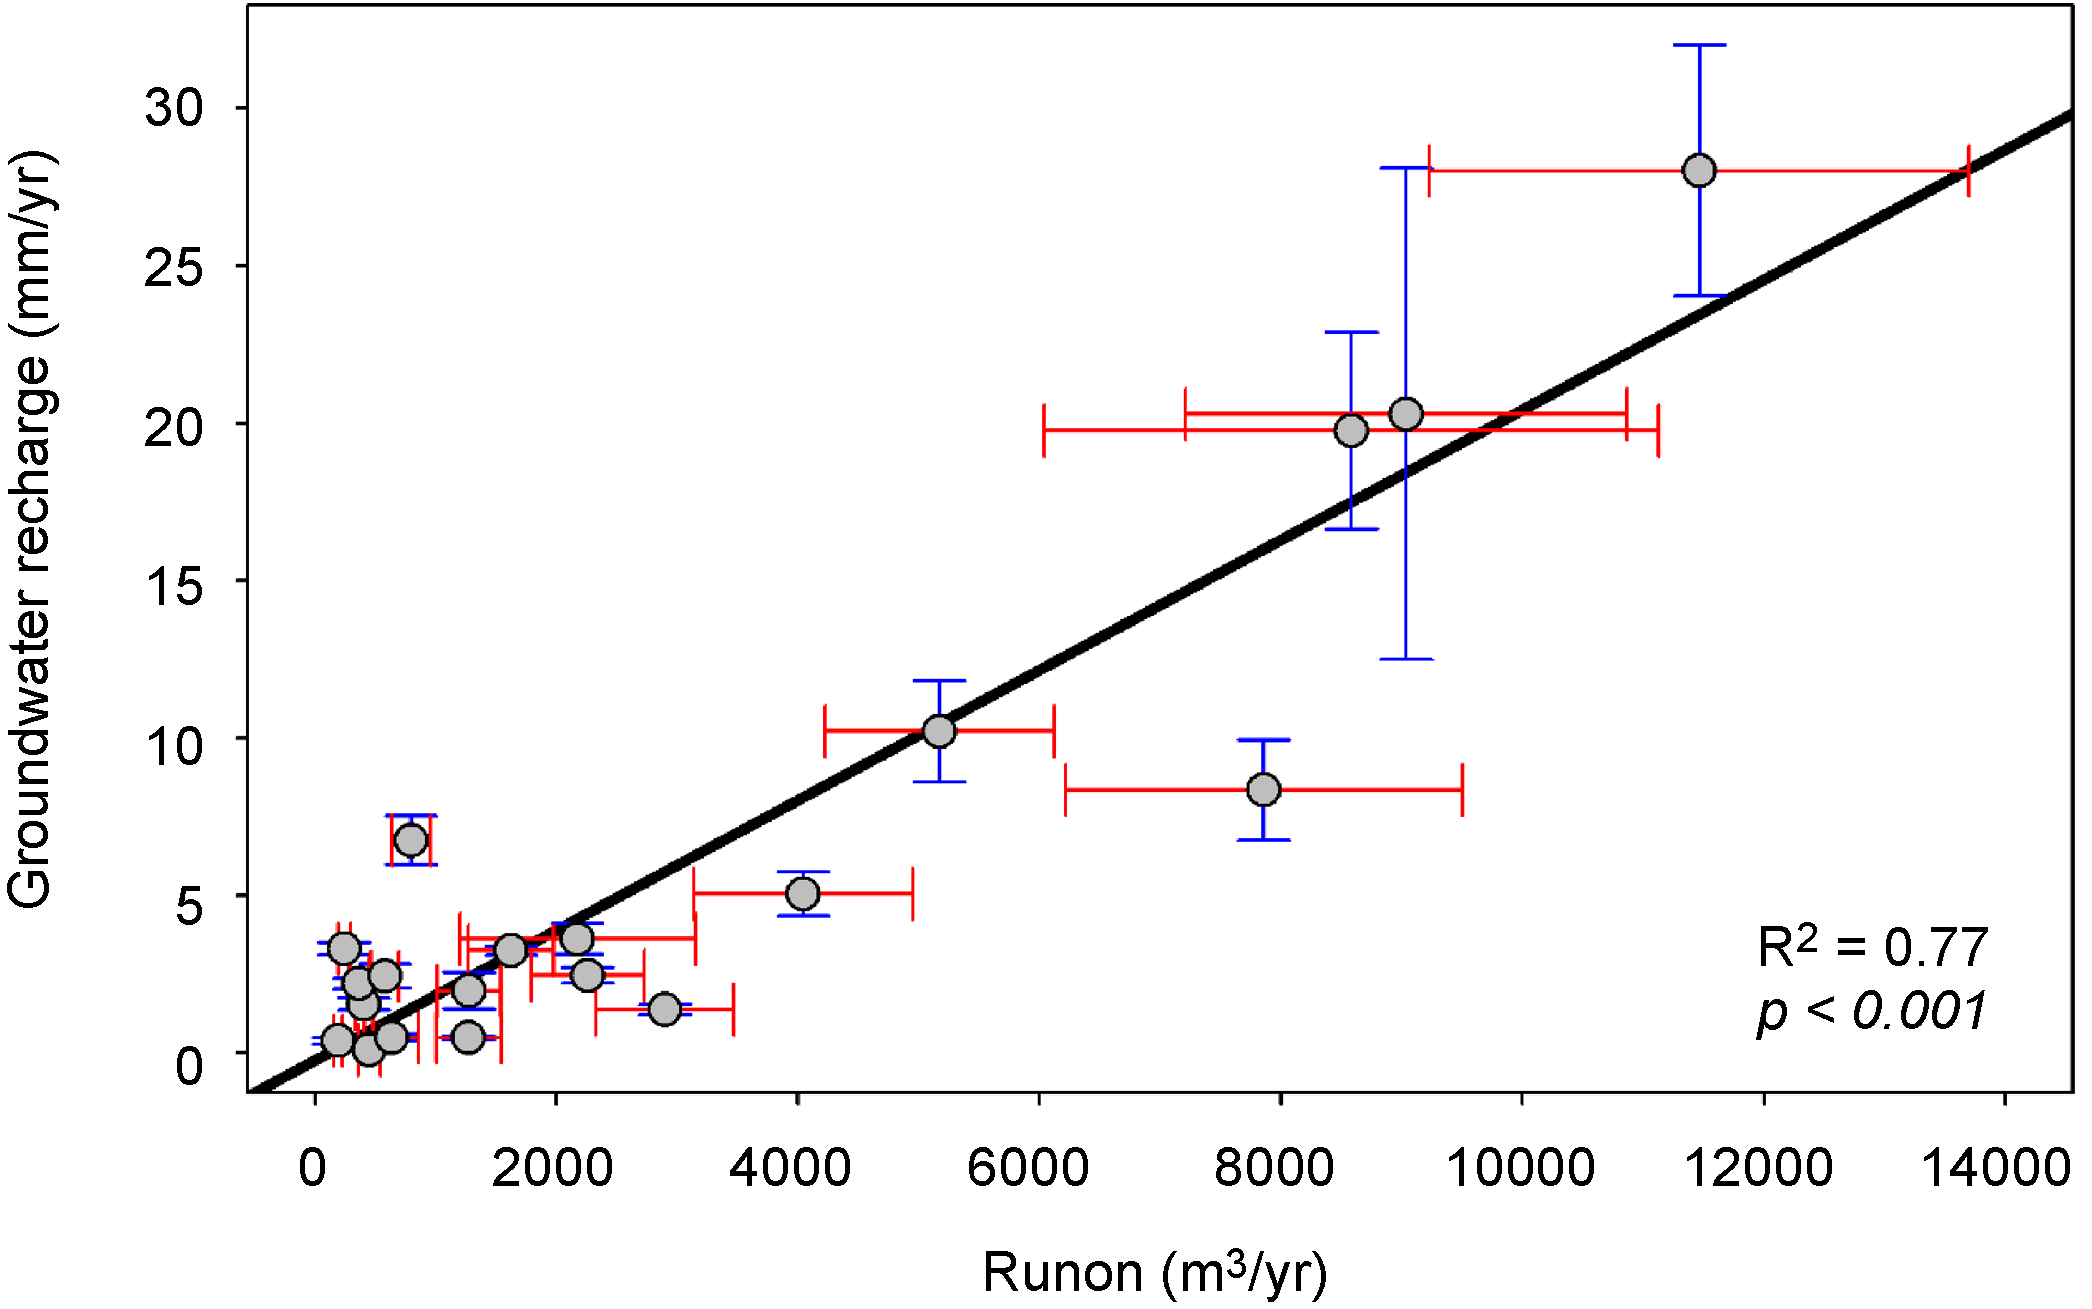
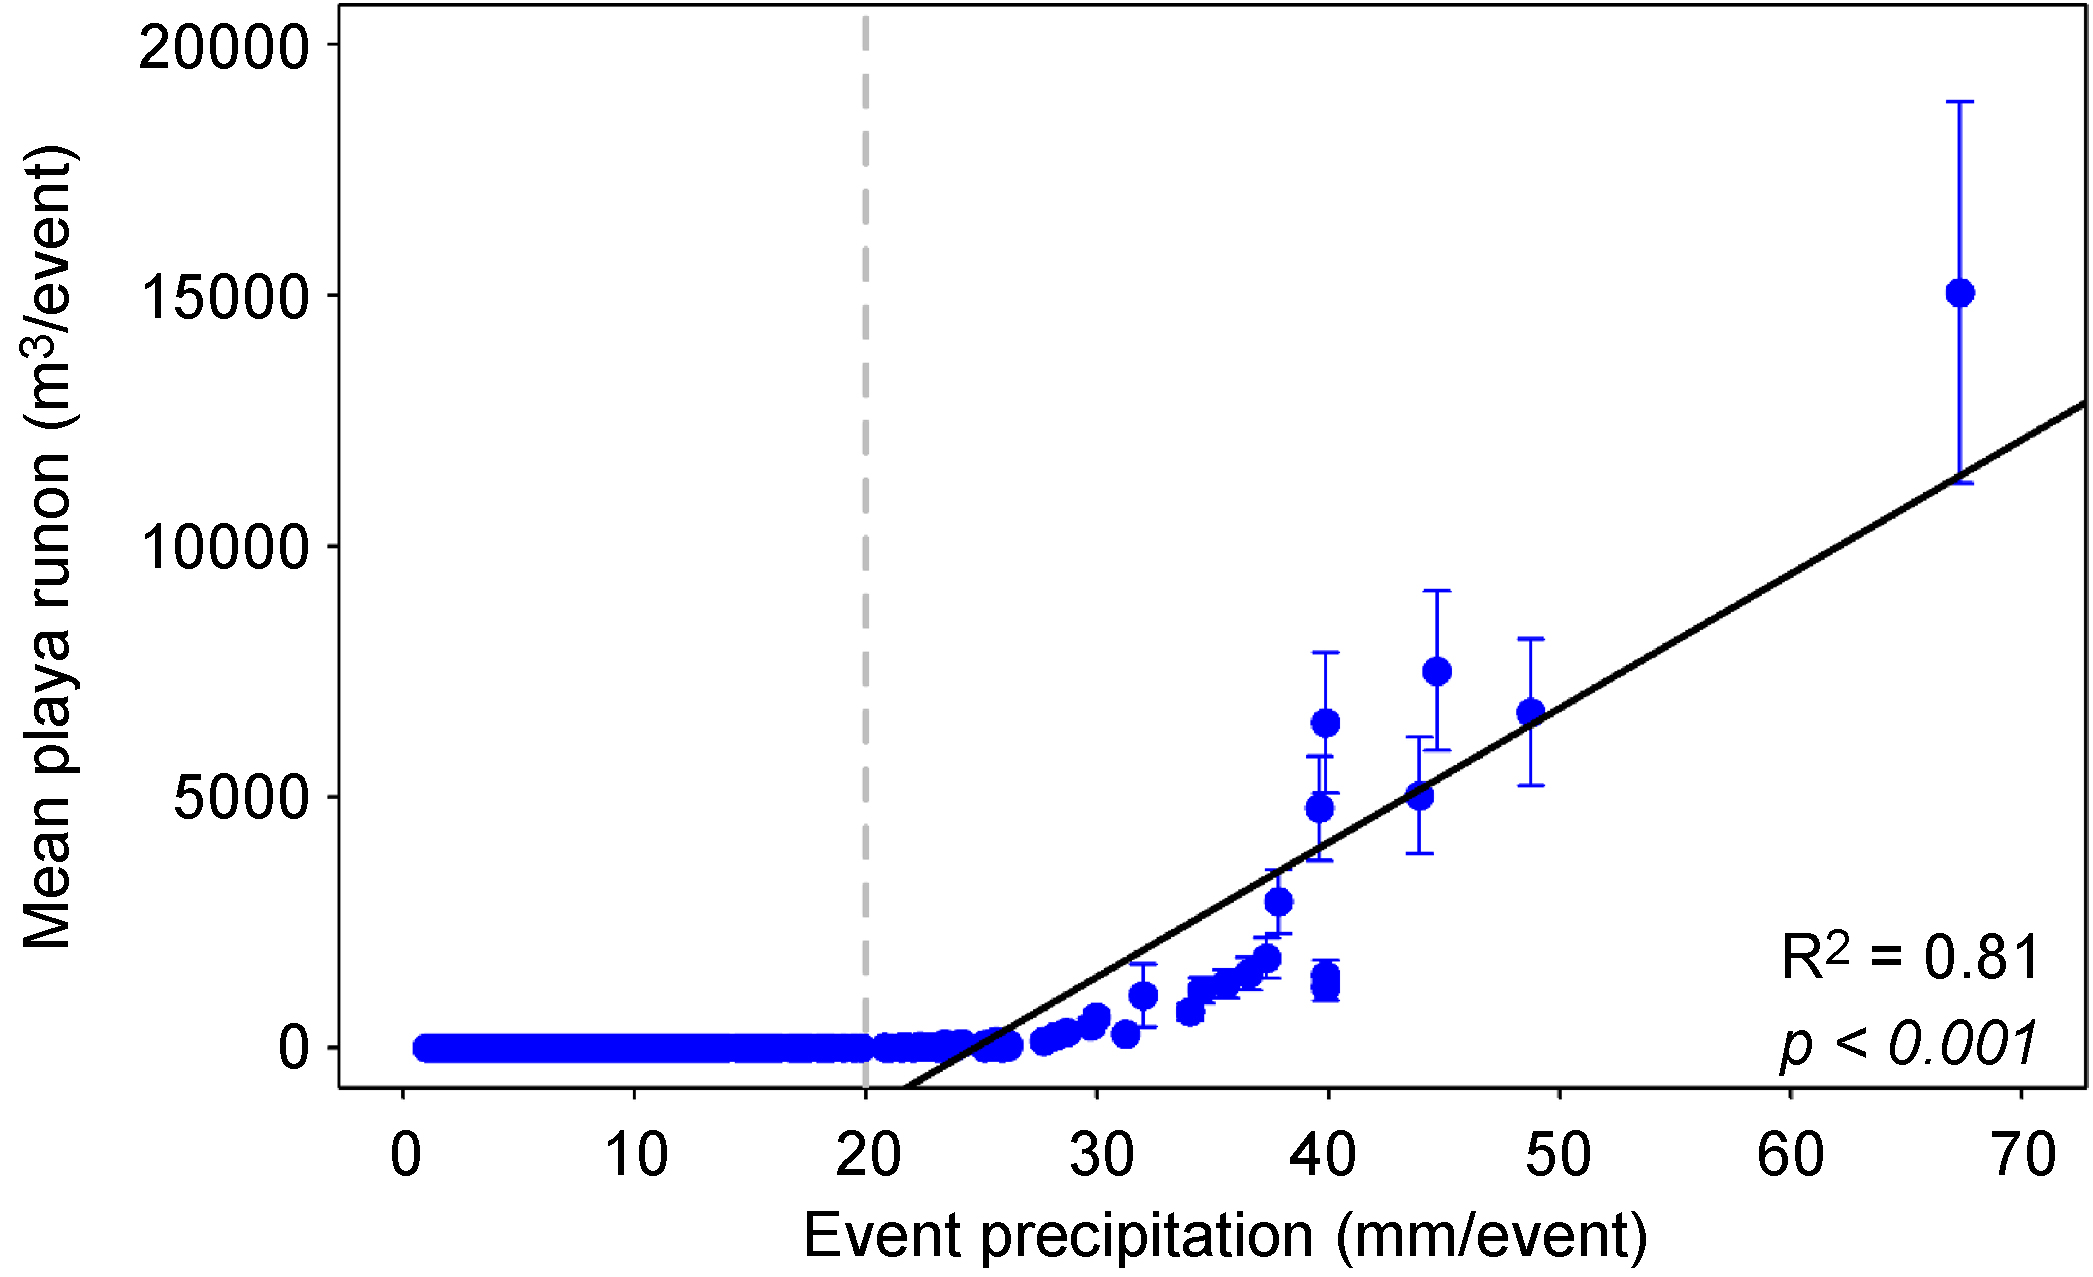
We found that there was a highly significant (R2 = 0.77, p < 0.05) linear relationship between the simulated amount of annual runon a playa received and the observed amount of annual groundwater recharge that occurred beneath that playa: Groundwater recharge = −0.23+ 0.0021⁎runon (m yr−3) (figure 3). From this relationship and our earlier correlations between catchment area, slope, and soil texture, we can also infer that a playa with a combination of the largest area, steepest slope, and least sand (figure 2) would produce the most runon for the adjacent playa. In order to estimate how changes in precipitation would affect groundwater recharge, we analyzed how the size of individual precipitation events controlled playa runon. Playa runon occurred when precipitation events were larger than 20 mm, which happened twice yearly on average, and only 8% of all rainfall events over a 20 year period were above 20 mm (figure 4). When rainfall events were above 20 mm, the size of a rainfall event correlated linearly (R2 = 0.81, p < 0.001) to the average amount of playa-runon generation: Mean playa runon = −6369.86 + 259.78⁎rainfall event size (mm) (figure 4). We used our empirically derived rainfall-runon (figure 4) and runon-recharge (figure 3) relationships to assess how projected changes in precipitation would influence runon and subsequently change groundwater recharge rates in playas.
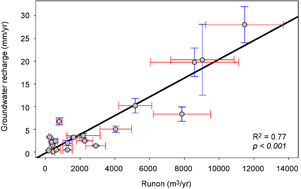
Figure 3. Relationship between modeled annual runon and observed annual groundwater recharge beneath playas. The amount of annual runon received by a playa was positively correlated with the annual rate of groundwater recharge beneath that playa. Gray circles represent empirically estimated average annual groundwater recharge rates beneath 20 pl ayas and modeled annual runon for each of the same 20 playas. Red error bars represent standard error in annual runon (n = 20 years) and blue error bars represent standard error in groundwater recharge rates (n = 5 depths) The best-fit model for predicting groundwater recharge was: Groundwater recharge = −0.23 + 0.0021⁎runon (m yr−3). The best-fit model of runon vs. recharge is represented by the black line.
Download figure:
Standard image High-resolution image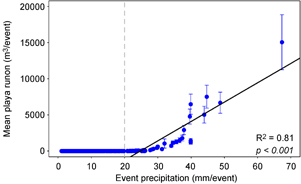
Figure 4. Relationship between rainfall event size and playa (n = 20) runon generated from each rainfall event. The vertical dashed gray line at 20 mm represents the runon production threshold. Rainfall events below the 20 mm threshold did not generate playa runon. Above 20 mm, precipitation-event size was positively correlated with playa runon. Closed blue circles represent the average runon produced on playas (n = 20) for 560 rainfall events (1992–2011). Blue error bars represent standard error of runon among 20 playas for each rainfall event. The best-fit model for predicting playa runon for precipitation events above 20 mm was: Mean playa runon = −6369.86 + 259.78⁎rainfall event size (mm). The best-fit model of rainfall vs. runon is represented by the solid black line. No runon occurred during rainfall events smaller than 20 mm.
Download figure:
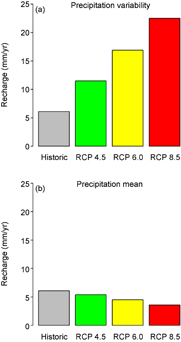
Standard image High-resolution imageAfter modeling runon from recent-past precipitation events, we independently evaluated the effects of increased inter-annual precipitation variability and decreased annual precipitation amount on playa groundwater recharge. We manipulated a 20 year rainfall record to reflect both increased precipitation variability and decreased precipitation amount. We then used our rainfall-runon-recharge models (figure 3 and figure 4) to calculate the response of groundwater recharge beneath playas to changes in precipitation variability and amount under RCP 4.5, RCP 6.0, and RCP 8.5 scenarios (figure 5). Climate models predict that increased atmospheric temperatures will increase precipitation variability and decrease precipitation amount in Southwestern USA (Melillo et al 2014). Under different climate-change scenarios for Southwestern USA, average atmospheric temperature would increase between 2 and 6 °C for RCP 4.5 and RCP 8.5 (table S1). A rise in temperature would increase precipitation variability between 5%–17% depending on the scenario (Wuebbles et al 2014). In turn, increased variability will increase the frequency of occurrence of large (>20 mm) rainfall events and the mean event size (Sun et al 2007) (table S1). We found that for every 1% increase in inter-annual precipitation variability, average playa groundwater recharge rates increased 18%. In the most-extreme scenario, average playa groundwater recharge rates increased 300% from 6 mm yr−1 to 22 mm yr−1 (figure 5).
Figure 5. Response of mean annual playa groundwater recharge to different climate-change scenarios that modify precipitation variability and amount. Grey bars represent average playa recharge under recent-past climate. Green, yellow, red bars represent average playa recharge under future concentration pathways (RCPs) scenarios of increased CO2 emissions. Panel (a) shows the response of increased precipitation variability under warmer climate while maintaining precipitation amount constant. Panel (b) shows the effect of decreased precipitation amount as predicted by global circulation models while maintaining precipitation variability constant.
Download figure:
Standard image High-resolution image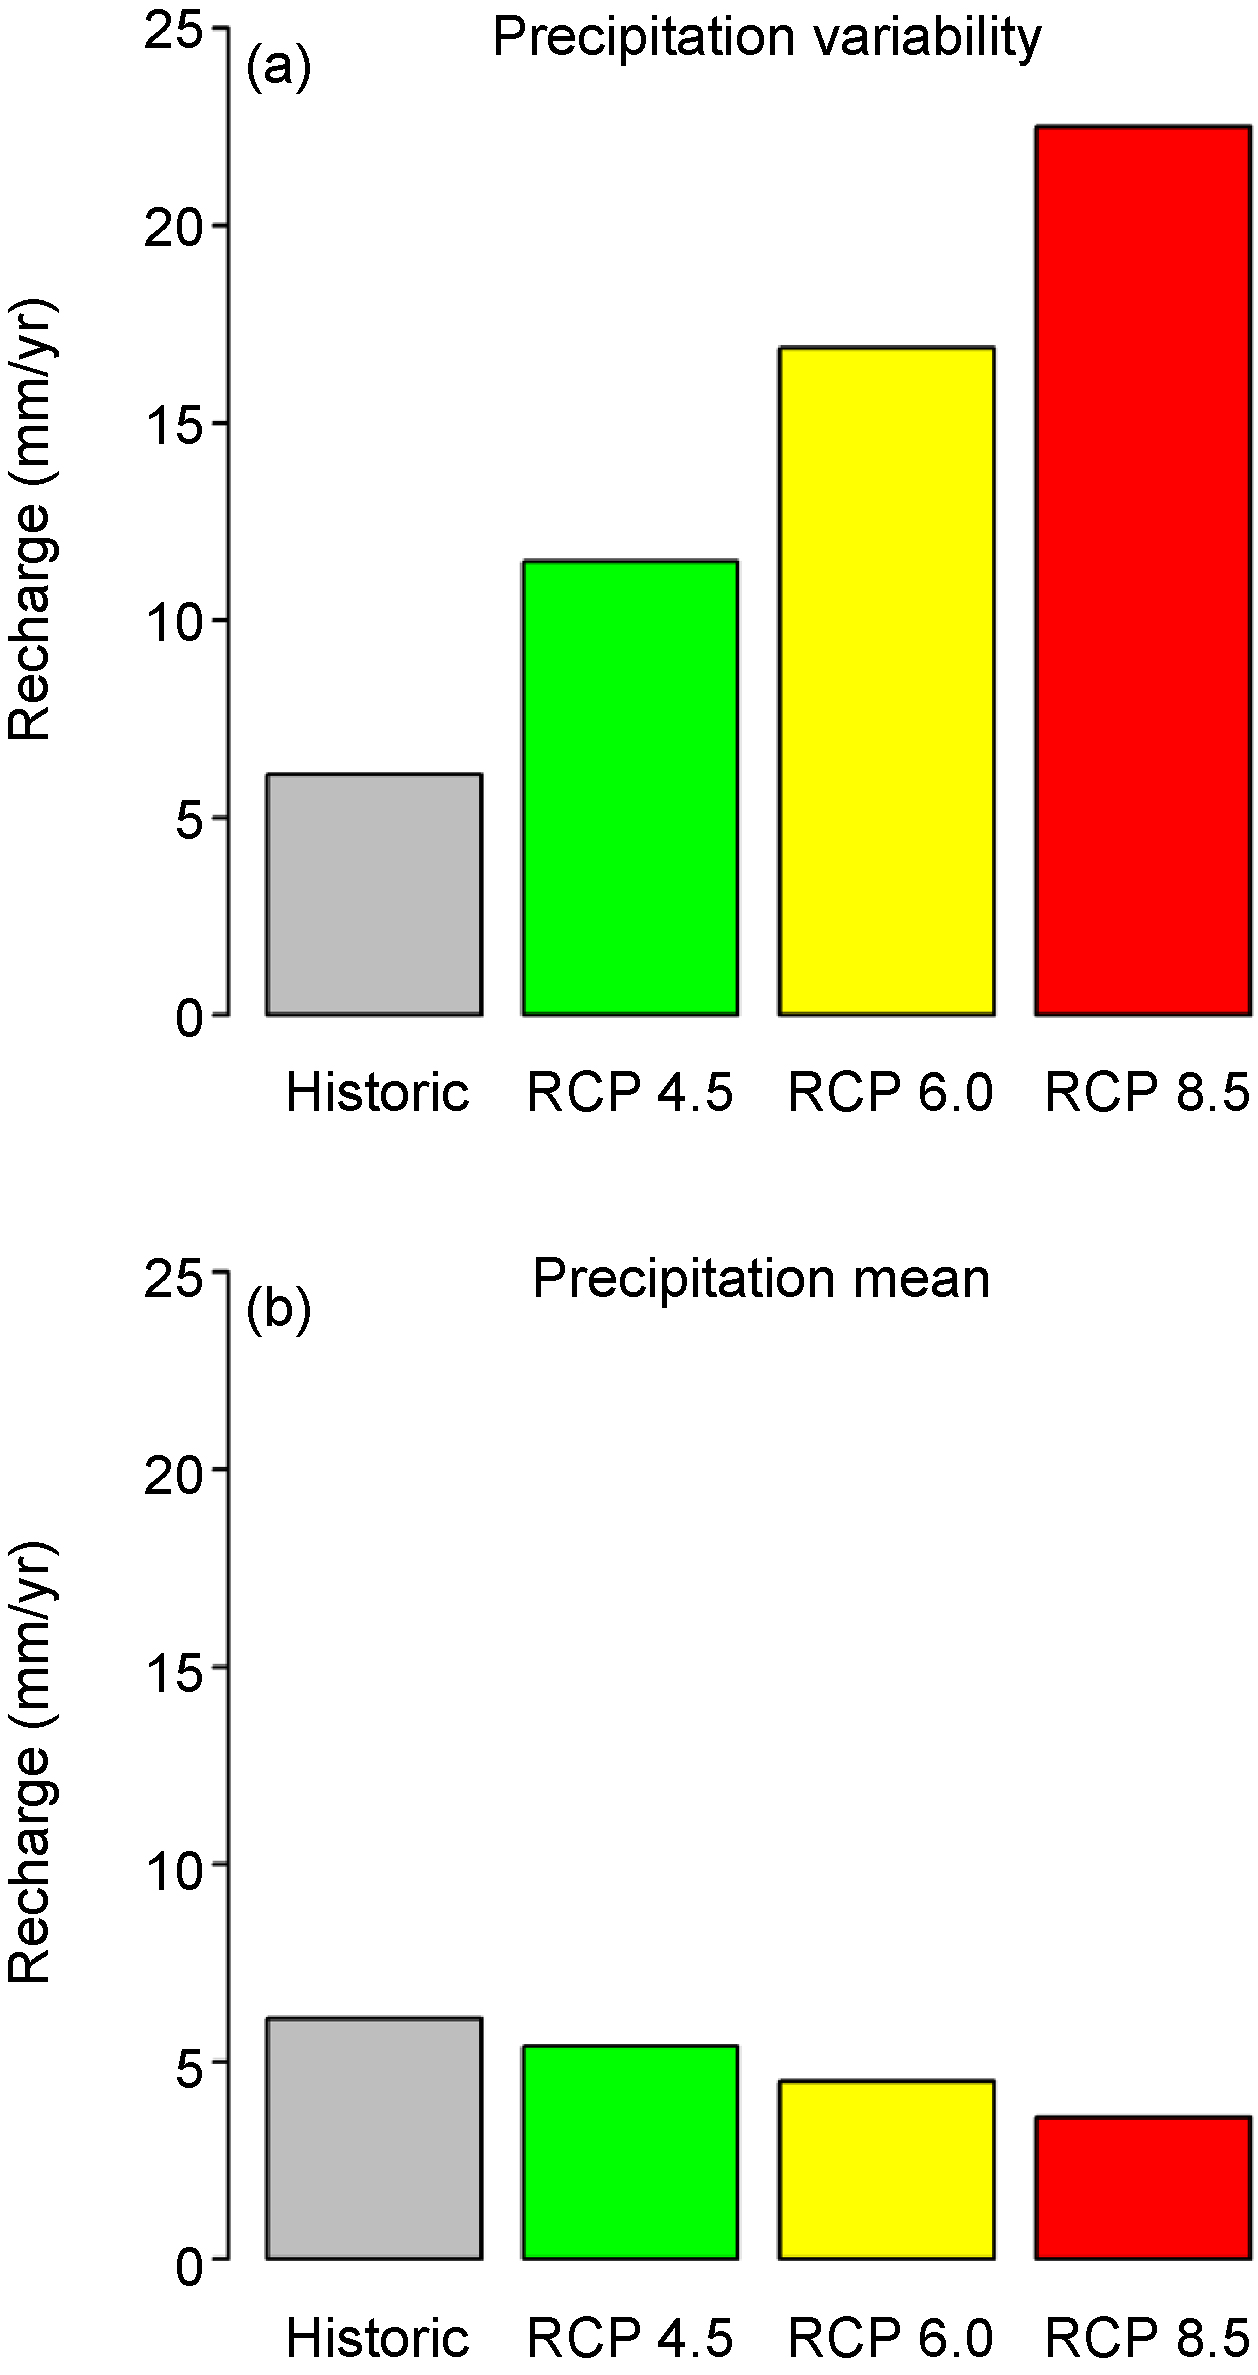
Climate change predictions for Southwestern USA call for a decrease in mean annual precipitation of 2% for every degree Celsius increase in temperature (Wuebbles et al 2014). Mean annual precipitation would decrease 4%–12% under the RCP 4.5–RCP 8.5 scenarios (Pierce et al 2013). We found that for every 1% decrease in precipitation amount, average playa groundwater recharge rates decreased 5%. In the extreme scenario, average playa groundwater recharge rates decreased 50% from 6 mm yr−1 to 3 mm yr−1 (figure 5). Overall, we found that climate change would have a net positive effect on playa groundwater recharge resulting mainly from an increased number of large runoff-generating rainfall events.
4. Discussion
Our results indicated that climate-change induced increases in precipitation variability would have a larger impact on playa groundwater recharge than projected decreases in mean annual precipitation. The positive effect of increased variability on ground water rechargeldwoud overshadow the negative effect of reduced amount of precipitation. The different responses of groundwater recharge to changes in precipitation variability and amount were due to the distribution of precipitation events in Southwestern USA. Precipitation records for the last 20 years showed that 92% of rainfall events were too small to generate runon (figure S1). From 1992–2011, there were only 47/560 precipitation events greater than 20 mm capable of generating run off and groundwater recharge. Increased temperature is projected to increase precipitation variability and consequently the frequency of large rainfall events that generate run off and ground water recharge (Sun et al 2007). On the contrary, decreasing precipitation mean would have a relatively smaller impact on large rainfall events. This finding runs counter to the current expectation that drylands would experience decreases in groundwater recharge under climate change (Meixner et al 2016). The conclusion of Meixner et al (2016) was based only on expected changes in amount of precipitation whereas our study evaluated both the effects of increases in variability and decreases in amount of precipitation. Regional climate phenomena such as El Niño/Southern Oscillation (ENSO) also influence precipitation and groundwater recharge events on a multi-year time scale. During the 'El Niño' periods, more frequent large rainfall events caused higher streamflow and groundwater recharge in Southwestern USA (Pool 2005, Kuss and Gurdak 2014). The current consensus is that continued anthropogenic warming would increase the frequency and strength of ENSO events (Cai et al 2015). Increased ENSO frequency would increase the amount of runon-generating rainfall events and cause more groundwater recharge beneath playas.
These findings confirm the need for playas to be included in future models of aquifer. In contrast, past efforts to model groundwater recharge rates in the Jornada del Muerto aquifer assumed no recharge beneath playas (Kambhammettu et al 2010). The groundwater recharge rates that we measured beneath high-recharge playas of ~20 mm yr−1 (table S3) were similar to estimates of mountain-front recharge of 22 mm yr−1 for the Jornada del Muerto aquifer (Kambhammettu et al 2010). Our estimates are also long-term estimates and during years with high amounts of runoff, recharge beneath playas is likely to become a larger component of the groundwater budget for the Jornada de Muerto aquifer. Increased runoff-recharge events in Southwestern USA can also elevate playa recharge rates to levels more comparable to the Ogallala Aquifer region (35 mm yr−1) of the USA Great Plains (Gurdak and Roe 2010). These relatively high rates of recharge could be especially important in desert basins in Southwestern USA that have larger playas such as the 130 km2 Willcox Playa of the Sonoran Desert. As we saw with the playas of the Jornada Basin, the amount of recharge a playa receives is dependent on certain catchment biophysical characteristics controlling runoff generation (figure 2). Groundwater banking as seen in other artificially waterlogged areas of desert systems (Sharma 2001, Behroozmand et al 2017) may be a feasible option in playas as well. If groundwater continues to be relied on by humans in Southwestern USA and playas are used for groundwater banking then salt accumulation issues in groundwater will need to be addressed as shown by both Sharma (2001) and Behroozmand et al (2017).
Watershed vegetation did not physically impede catchment-scale runoff generation (figure 2) although it affected the amount of carbon that reached playas (McKenna and Sala 2016). These results also indicated that decreases in dryland vegetation cover caused by increased precipitation variability or grazing (Gherardi and Sala 2015) would not have a major impact on playa groundwater recharge. Although upland vegetation did not correlate with playa recharge, vegetation density in playas may be influencing recharge beneath playas. Changes in playa-vegetation cover can influence transpiration and infiltration rates of water beneath the rooting zones in playas (Scanlon et al 2005, Kim and Jackson 2012). Increases in playa grazing intensity that affect plant cover could further increase groundwater recharge. On the contrary, overgrazing may also increase soil compaction, which can decrease infiltration rates in playa soils (Dlamini et al 2016). Playas already play a key role in sustaining livestock and wildlife during wet years since they produce high-quality biomass that allows animals an alternative to the low-quality forage characteristic of mixed grassland/shrubland uplands (Eldridge et al 2011). It has been estimated that over 50% of playas in the Southern High Plains of Texas are used for livestock grazing (Bolen et al 1989).
Predicted increases in the frequency and magnitude of large rainfall events would increase flood frequency in drylands with negative economic impact (Donat et al 2016). The upside of more frequent floods would be higher rates of groundwater recharge beneath playas that enhance the sustainability of drylands in Southwestern USA aquifers.
5. Conclusion
Groundwater resources in Southwestern USA are diminishing at an unsustainable rate. Playas are periodically flooded desert wetlands and have the potential to be important areas of groundwater recharge. We found that playa-mediated recharge would become greater in the future with a predicted increase frequency of runoff-producing storms. This finding is contradictory to current consensus that groundwater recharge will decrease under climate change in drylands (Meixner et al 2016). We found that desert playas are important areas for groundwater recharge althought they are not currently included in most groundwater budgets of desert aquifers. Our results also indicated that playas found in larger and steeper catchments with finer-textured soils coincided with the highest rates of recharge.
Acknowledgments
We would like to thank Laureano Gherardi, Josh Haussler, and Kelsey McGurrin for field and lab support. Thanks to Sharon Hall, Curtis Monger, and Dan Childers for invaluable input and contributions to this manuscript. Jornada basin LTER project provided soil data sets. US National Science Foundation (Grant DEB-1235828) and Arizona State University, Global Drylands Center and School of Life Sciences provided funding for this work. We would also like to thank the Jornada LTER and JER USDA personnel, especially Debra Peters, Kris Havstad, Brandon Bestelmeyer, David Thatcher, Joe Ramirez, and John Anderson for their incredible support. Special thanks to Natalie McKenna for her help with editing this manuscript.