


Abstract
Climate change projections for the last 30 years of the 21st century, for boreal summer precipitation in tropical America, have been made by developing a statistical downscaling (SD) model applied to the SLP outputs of 20 GCMs of CMIP5, for present climate (1970–2000), and for future (2071–2100) under the RCP2.6, RCP4.5 and RCP8.5 scenarios. For present climate, many SD GCMs faithfully reproduce the precipitation field in many regions of the study area. For future climate, as the radiative forcing increases, the projected changes intensify and the regions affected expand, with higher coherence between models. The zone between central and southeastern Brazil registered the most pronounced precipitation changes by a large number of SD models, even for the RCP2.6. Except for this region in Brazil, in general, the changes in rainfall range from moderate (± 25%) to intense (from ±70% to ±100%) as the radiative forcing increases from the RCP2.6−RCP8.5. For this latter scenario, all SD models present significant precipitation changes for more than 50% of the area, in some cases reaching 75% of area with significant changes. For the ensemble mean, the results show three extensive regions with significant changes under the three scenarios, the most highlighted changes being for the RCP8.5: a northwest-southeast band that extends from northern Mexico to eastern Brazil, crossing through northern Colombia, along with the regions in the south of the study area, with generally moderate precipitation increases; and a band that extends from eastern Ecuador to southeastern Brazil, with major decreasing changes. This pattern of change could be related with a possible strengthening in frequency in terms of La Niña events for the end of the century.
Export citation and abstract BibTeX RIS

Original content from this work may be used under the terms of the Creative Commons Attribution 3.0 licence.
Any further distribution of this work must maintain attribution to the author(s) and the title of the work, journal citation and DOI.
1. Introduction
The impact of climate change will differ and have greater or lesser severity depending on the region of the world. Tropical regions, which account for 50% of the earth's surface (between 30°N and 30°S), harbor some 75% of the world population (Thompson 2000). This region has rich biodiversity and presents unique meteorological and climatological features (Garreaud and Aceituno 2007), so that major shifts could be more devastating than in other areas. The seasonality of precipitation in the area is associated with the ITCZ migration, with boreal summer having large amounts of rainfall in Central America and northern South America, and minimum rates for central-eastern Brazil (Durán-Quesada et al 2012).
Climate change adaptation strategies involve future projections using climatic variables at local scales. General Circulation Models (GCMs) are the most suitable tools for modelling future global climate change. Currently, the Coupled Model Intercomparison Project Phase 5 (CMIP5, Taylor et al 2012), provides simulation results of more than 50 models. However, at the regional scale these models present a coarse spatial resolution. Downscaling techniques are required to provide high-resolution climate change scenarios (Christensen et al 2007, IPCC 2013a). Among these, the statistical downscaling (SD, Zorita and von Storch 1999, von Storch et al 2000) explores the statistical relationships between local variables (predictands) and observed large-scale atmospheric variables (predictors). One of the most commonly employed methods in SD includes principal component regression (PCR, Kistler et al 2001, Sankarasubramanian et al 2008, Palomino-Lemus et al 2015), applied to the predictor field, in which the leading principal components (PCs) are fed into a multiple linear regression model to generate the SD model, overcoming multicollinearity problems. There are several methodologies to obtain the leading PCs: by projecting the EOFs from calibration period using observational data onto the GCMs outputs (Li and Smith 2009, Palomino-Lemus et al 2015, 2017) or using common EOFs (Benestad 2001 2002). The fitted SD model is applied to the results from the GCMs outputs, providing high-resolution projections (Wilks 2006, Benestad et al 2008, Li and Smith 2009, Eden and Widmann 2014, Song et al 2014, Palomino-Lemus et al 2015, Mtongori et al 2016). An effective technique to reduce potential uncertainties in the projections is the use of the multi-model ensemble (Benestad 2002, Palmer et al 2005, Thomson et al 2006, Semenov and Stratonovitch 2010, Wilby and Harris 2006, Maurer 2007).
The IPCC AR5 (IPCC 2013a, 2013b) suggests both increases and decreases in rainfall for Central and South America by 2100, depending on the region, although with high uncertainties. However, few studies address climate projections in tropical America, and those available are either focused mostly on particular areas of South America (Ramírez et al 2006, Solman and Nuñez 1999, Mendes and Marengo 2010, Teichmann et al 2013, Guimberteau et al 2013, Palomino-Lemus et al 2015, 2017), based on GCM outputs (Giorgi and Bi 2005a, 2005b), or are dedicated to the intercomparison and validation of RCMs (Roads et al 2003, Rauscher et al 2007).
In the present study, we perform high-resolution projections in boreal summer precipitation over tropical America. For this, gridded observational precipitation data, sea level pressure (SLP) from NCEP reanalysis data, and SLP data from 20 CMIP5 GCMs have been used to develop a statistical downscaling model, for each grid point, to project the future changes of precipitation for the late 21st century, under three different emission scenarios.
2. Data and methods
The datasets employed were: (1) boreal summer (June–July–August average, JJA) observed precipitation over tropical America [30°N−30°S, 120°W−30°W] from the Global Precipitation Climatology Centre, GPCC version 6.0 (Schneider et al 2014), with a spatial resolution of 0.5° × 0.5°, covering the period 1950–2010 (2) The mean monthly sea level pressure (SLP) from the National Center for Environmental Prediction (NCEP reanalysis project, Kalnay et al 1996), covering a more extensive area [30°S−30°N, 180°W−30°W] for the same period. The seasonal JJA SLP was also computed. (3) The SLP outputs from 20 CMIP5 (Taylor et al 2012) GCMs (table S1 in supporting information available at stacks.iop.org/ERL/12/124011/mmedia). These data include simulations with historical atmospheric concentrations and future projections for the representative concentration pathways RCP2.6, RCP4.5, and RCP8.5 (Moss et al 2010, Taylor et al 2012). In the present study, the predictor variable is the SLP, the predictand is summer precipitation from GPCC, the period 1971–2000 is taken as representative of present climate, and 2071–2100 is used for generating climate change projections for summer precipitation. (4) For an additional validation of the precipitation predictions, TRMM monthly precipitation data (Shimizu et al 2001) for the period 1998–2015 has also been used.

Figure 1. Spatial distribution of the significant correlation coefficients between observed JJA precipitation and one predicted by the SD model for each grid point during: (a) 1950–2010 recalibration, and (b) 1971–2000 periods. (c) Difference in percentage between the observed JJA and the SD-modelled precipitation for the period 1971–2000.
Download figure:
Standard image High-resolution imageFollowing the scheme proposed by Li and Smith (2009) and Palomino-Lemus et al (2015), a statistical downscaling based on the Principal Component Regression (PCR) method is employed to achieve statistical relationships between the large-scale predictor (NCEP summer SLP) and regional rainfall. The PCs accounting for a high percentage of explained reanalysis SLP variance, and presenting significant correlations with precipitation (see text S1 and figure S1 in the supporting information for details) were considered as predictors in a multiple regression model, for each precipitation grid point, to establish the statistical downscaling (SD) model, using 1950–1993 and 1994–2010 as the calibration and validation periods, respectively. The SD model formulated was recalibrated using the total period 1950–2010 to take into account the more recent variability of the fields.
The SD model established was applied to the historical SLP outputs from the CMIP5 models for the period 1971–2000, and the skill of these SD GCM simulations for the present climate was examined by computing the differences between the simulated and observed precipitation values. Then, the SD model established is applied to the future SLP outputs from the CMIP5 GCMs, for the period 2071–2100, under the RCP2.6, RCP4.5, and RCP8.5 scenarios. The non-parametric rank sum test of Wilcoxon-Mann-Whitney (von Storch and Zwiers 2013) was applied to analyze the significance of the projected changes. Finally, as a means of improving the reliability of the projected precipitation changes by reducing simulation errors and uncertainties (Lambert and Boer 2001, Palmer et al 2004, Hagedorn et al 2005, Nohara et al 2006, Koriala et al 2014) the coherence of the results between the SD GCMs was analyzed, and the multi-model ensemble mean was computed using the arithmetic average of the 20 SD GCMs for each of the three scenarios considered.
3. Results
3.1. Downscaling of summer precipitation for present climate
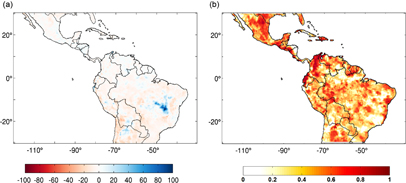
Figure 2. Differences in percentage (a) and correlation coefficients (b) between the TRMM and the SD-modelled precipitation for the period 1998–2015 in JJA.
Download figure:
Standard image High-resolution image
Figure 3. Differences (%) between the SD precipitation from 20 GCMs and the observed JJA precipitation for 1971–2000 period. The areas where the differences are significant at the 95% confidence level are marked by gray dots, and the numbers in brackets represent the percentages of these areas.
Download figure:
Standard image High-resolution image
Figure 4. Changes (%) in projected (2071–2100) JJA precipitation compared to the present (1971–2000) SD precipitation for each GCM under the RCP2.6 scenario. The areas where the differences are significant at the 95% confidence level are marked by gray dots, and the numbers in brackets represent the percentages of these areas.
Download figure:
Standard image High-resolution image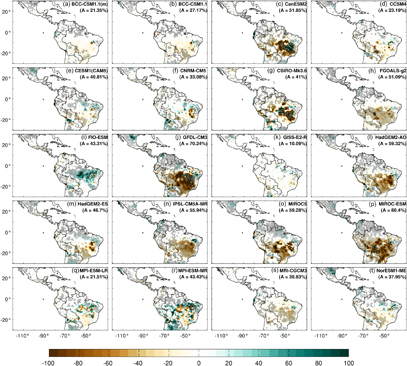
Figure 5. As in figure 4, but for the RCP4.5 scenario.
Download figure:
Standard image High-resolution image
Figure 6. As in figure 4, but for the RCP8.5 scenario.
Download figure:
Standard image High-resolution image
Figure 7. (a) Percentage of 20 SD GCMs that predict a positive or negative change in projected JJA precipitation with respect to the present. The positive or negative sign of the percentage corresponds to an increase or decrease, respectively, in the projected change, with a coherence higher than 55%. (b) Changes (%) in projected JJA precipitation compared to the present SD precipitation for the ensemble multi-model. The areas where the differences are significant at the 95% confidence level are marked by gray dots, and the numbers in brackets represent the percentages of these areas with positive (P), negative (N) and total (A) change.
Download figure:
Standard image High-resolution image
Figure 1 presents the spatial distribution of the correlation coefficients between observed JJA precipitation data and the SD modeled values during both the period of recalibration (1950–2010, figure 1(a)), and for the period considered as present climate (1971–2000, figure 1(b)). Similar spatial structures are shown for both periods, with high correlation values up to 0.8 over the Pacific coast from Central America to northern Peru, Atlantic coast of Colombia and Venezuela, Surinam, Guyana and French Guiana and several disperse areas over Brazil. The good performance of the SD model generated is verified in figure 1(c), which displays the difference in percentage between the observed JJA rainfall and the modeled one, for the period 1971–2000, presenting differences not exceeding 5% in almost the entire area. Additionally, in order to assess the quality of the data used in this work and to validate the SD procedure, the TRMM database has been used as independent base for validating the downscaling model during the period covered by this database (1998–2015). Figure 2(a) presents the differences in percentage between the TRMM and the SD-modelled precipitation for the period 1998–2015 in JJA, showing errors lower than 20% in most part of the analyzed region. Only for a region located at center and eastern Brazil, the errors presents high values, probably associated with a low number of stations with data in GPCC during last years. Therefore, this uncertainty source should be taking into account in the analysis of the results for this area. The agreement between TRMM and the SD-modelled precipitation is also confirmed by their correlation coefficients shown in figure 2(b).
Figure 3 shows the percentage of the significant differences (at the 95% confidence level using a Wilcoxon-Mann-Whitney test) between the SD precipitation from 20 GCMs and the observed JJA precipitation for 1971–2000 period. The results show a predominance of regions where the SD underestimates the rainfall, although this underestimation is often not significant. SD HadGEM2-AO (l), BCC-CSM1.1 (b), and CESM1(CAM5) (e) are the models that best simulate summer precipitation, presenting significantly low differences (around 25%) only over northern Chile and Paraguay, northeastern Argentina and some limited areas of Brazil. On the other hand, there are many models with noticeable deficiencies over the region around 10°S and between 60°W–40°W, previously mentioned as a region with a low number of observational data, with underestimations of around −90%. Generally, there are no statistically significant differences for a large number of models in many regions of the study area, indicating that the SD model applied to the SLP outputs of these GCMs has a strong ability to faithfully reproduce the precipitation field. The percentages of area with significant differences between the simulated and observed rainfall range from 8.46%−56.34% for the SD GCMs. Meanwhile, for the simulations performed directly by using non-downscaled outputs of GCMs (see figure S2 in the supporting information), these percentages oscillate between 73.41% and 91.91%. These strongly distort the precipitation field, since these GCMs can reproduce neither the values nor the spatial distribution of precipitation. Therefore, the SD applied to the 20 GCMs significantly improves the estimations of rainfall with respect to raw GCM results.
3.2. Projections of summer precipitation
Figures 4, 5, and 6 show the percentage of changes in projected JJA rainfall (period 2071–2100) compared to the present SD precipitation (period 1971–2000) for each GCM under the RCP2.6, RCP4.5, and RCP8.5 scenarios, respectively. Some SD models show, even for the RCP2.6 scenario, pronounced changes in precipitation over the region located between central and southeastern Brazil. These changes intensify and extend to more regions as the radiative forcing increases. Thus, for the RCP8.5 scenario (figure 6), all models present significant precipitation changes for more than 50% of the total area. Specifically, for some models [MIROC-ESM (p), FGOALS-g2 (h), GFDL-CM3 (j) and IPSL-CM5A-MR (n)] this percentage exceeds 75%, in some regions reaching 100%.
For the RCP2.6 (figure 4), nine models show small areas (less than 20%) with significant changes, presenting usually moderate decreases (around 20%). The SD models with more intense and extended changes are the MIROC-ESM (p), GFDL-CM3 (j), and CanESM (c), characterized by showing a wide region over central Brazil with sharp decreases (100%) for the latter two, and a slightly smaller for the first one (80%). Inside this region for these SD models, some areas with marked increases (surpassing 80%) also appear. GFDL-CM3 (j) and MIROC-ESM (p) also present a similar pattern for northern South America, Central America, and eastern Brazil, with a predominance of moderately significant increases (20%) in precipitation. The FIO-ESM (i) model, however, shows a pattern which is almost the opposite of the previous ones, with major increases in central Brazil that reach 100%.
For the RCP4.5 (figure 5), the aforementioned patterns tend to expand, becoming clearer and more intense for a greater number of models. Thus, 9 models (c, g, h, j, l, n, o, p, s) present significant decreases over the zone covering central to southeastern Brazil. Meanwhile, significant increases, around 20%–30%, appear over a large part of South America and Central America.
For the RCP8.5 (figure 6), all models register a large percentage of the area (≥50%) with significant changes. An intensification of the above-described change over Brazil is found. All models except the FIO-ESM (i), present decreases in this area, moderate as the case of BCC-ESM1.1(m) (a), or very intense as MIROC-ESM (p), GFDL-CM3 (j) or CanESM2 (c). The SD models MPI-ESM-LR (q), MPI-ESM-MR (r), CSIRO-Mk3.6 (g) or CanESM2 (c), show a more uneven spatial pattern in this zone, with opposite important changes (±100%) in nearby regions. The signal towards increased precipitation in northern South America and Central America can be also seen more clearly for all models, with northeastern Mexico being the most affected region, with increases of around 60% for CESM1(CAM5) (e), and 80%–90% for GFDL-CM3 (j) and NorESM1-LR (t). For the more meridional area, to the north of Argentina, almost half of the models predict increased precipitation, from around 30% for the HadGEM2-ES (m), FIO-ESM (i), and HadGEM2-AO (l) to around 90% for theCSIRO-Mk3.6 (g) and MPI-ESM-MR (r).
A quantitative determination of whether the changes found in precipitation are reliable requires a study about the coherence of the results between the 20 SD models, which is also the base for the multi-model ensemble mean. The percentage of models that agree in the sign of the projected change, at each grid point of the study area, was computed. The figure 7 depicts these results together with the changes predicted by the ensemble mean of the SD models. Figure 7(a) shows that the projected changes are highly consistent between the 20 SD models in most of the area, with positive or negative changes depending on the region considered but not the scenario. As radiative forcing increases, the percentage of models showing consistent changes, positive or negative, also does; for the more extreme scenario, 100% coherence is reached for many zones. Three well-determined regions can be distinguished regarding coherence, ranging from 80%–100%. The first of these regions is a band that extends from northern Mexico to the northeastern Brazil, crossing Central America from the Pacific coast towards northern Colombia, Venezuela, Guiana, Surinam, and French Guiana, together with a second region to the south of the study area, over northern Argentina, both showing consistently increasing precipitation between models. Between these two regions with consistent changes, a band of decreasing rainfall appears, extending from Ecuador to southeastern Brazil, through Bolivia and Paraguay.
Figure 7(b) shows the percentage of changes in projected (2071–2100) JJA rainfall compared to the present (1971–2000) SD precipitation for the multi-model ensemble mean under the RCP2.6, RCP4.5, and RCP8.5 scenarios, respectively. The statistical significance of the projected precipitation changes was estimated as before. The results show that the projected changes are significant in most of the area, covering from 58.91% of the total area, under the RCP2.6 scenario, up to 89.24% under the RCP8.5. Projected changes are mostly mild (positive) or moderate (negative) for the RCP2.6, covering extended regions with the same sign, intensifying as the radiative forcing increases. Under the most severe scenario, positive changes in precipitation are mostly moderate while negative changes are more intense, reaching change values of -100% in some regions such as the central-eastern zone of Brazil, some coastal areas between Ecuador and Peru, Peru and Chile, and some bordering areas between Argentina and Bolivia, or Bolivia and Brazil. These regions already register heavy changes also for the RCP4.5, and to a lesser extent for the RCP2.6. Maximum values for positive changes, reaching 75%, are found for the RCP8.5 for northern Mexico, northern Colombia, northeastern Brazil, southern Bolivia or some areas in the coast of Ecuador and northern coast of Peru.
4. Summary and conclusions
The goal of this work has been to project future changes in boreal summer precipitation over tropical America by using the statistical downscaling method based on PCR applied to the NCEP SLP data of the reanalysis. It is well known that modes of climate variability related to the El Niño phenomenon can satisfactorily describe the precipitation in a large part of the study region (Barros et al 2000, Grimm et al 2002, Tedeschi et al 2013, Córdoba-Machado et al 2015a, 2015b). The PC1 of the tropical Pacific SLP, which is highly related with the ENSO phenomenon, is one of the predictor variables for the SD model developed. Other climatic modes seem to exert influence on precipitation over some areas of the Tropical America (Kayano et al 2009).
The SD model performs properly over large areas, presenting bias between the observed and the simulated precipitation that do not exceed 5% in almost any of the areas for the period 1971–2000. The results of the simulations considering the application of the SD model to the historical outputs from 20 CMIP5 GCMs, indicate a predominance of regions where the SD model underestimates the rainfall, although these biases are often not significant and much less pronounced than in the raw GCM precipitation outputs. However, note that the SD model only takes into account the SLP as predictor, and therefore, only the dynamical forcing is considered. I this sense, the inclusion of additional parameters more related to the thermodynamic forcing, such as the moisture or precipitation (Mtongori et al 2016), could improve the predictive ability of the SD model.
For an evaluation of the changes projected by the end of the century, and as a means of avoiding the bias of the SD GCM simulations with respect to the observed real data, the differences, in percentage, between the projected SD mean precipitation for the period 2071–2100 and the simulated SD precipitation for the period 1971–2000, were computed. The zone located between central and southeastern Brazil shows the greatest changes in precipitation by a large number of SD models, even for the RCP2.6. However, note that this region has the lowest data coverage and presents the highest uncertainties in the DS model. As the radiative forcing becomes more pronounced, the projected changes intensify and the affected regions expand. Hence, for the RCP8.5, all SD models present significant precipitation changes for more than 50% of the total area, in some cases reaching 75% of area with significant changes. Thus, with the exception of the above-mentioned zone in Brazil, in general, the rainfall changes range from moderate (±25%) to very intense (ranging from ±70% to ±100%) as the radiative forcing increases. Major sources of uncertainty in the projected changes at the end of the century seem to come from the disparity in the GCMs outputs, these being less sensitive to the scenario considered. A detailed analysis of the coherence of the results between the models, shows that the projected precipitation shifts present great consistency between the 20 SD models throughout most of the study area, with positive or negative changes depending on the region considered but not the scenario. Moreover, as radiative forcing increases, from RCP2.6−RCP8.5, the percentage of SD models that show consistent changes, positive or negative, also shifts, reaching the 100% of coherence between models for many zones, for the most extreme scenario.
With this high coherence between SD models, and the potential reduction of the simulation errors and uncertainties through the use of the ensemble mean of the members for multi-model projections, the ensemble mean from the 20 SD GCMs was determined. The projected changes found by the multi-model SD ensemble mean are significant throughout most of the area, covering from 58.91% of the total area, under the RCP2.6 scenario and up to 89.24% under the RCP8.5. Projected changes prove mostly mild (positive) or moderate (negative) for the RCP2.6, covering extensive regions with the same sign, which intensify as the radiative forcing increases. Three broad regions can be distinguished for the three scenarios, with the most highlighted changes for the RCP8.5: a northwest-southeast band extending from northern Mexico to the northeast of Brazil, crossing through northern Colombia, with generally moderate increases in precipitation; substantial decreasing changes over a band extending from eastern Ecuador to southeastern Brazil; and the regions in the south of the area of the study, again with moderate increases.
In agreement with these results, Marengo et al (2012) also found a similar pattern for the projected precipitation in South America at the end of 21th century, although with a displacement of the most notable changes towards the northeast. Changes in circulation patterns may explain some of the changes projected in precipitation, mainly because they modify the dynamical background on which the regional processes develop. In this sense, figure S3 in the supporting information shows the projected change for the SLP field for the RCP8.5 using the ensemble mean from the GCM outputs. A pressure increase appears over the centre of the South Pacific and a light pressure decrease expands over Brazil, according with the results of Marengo et al (2012). This remarkable SLP increase over the centre of the South Pacific could be related with a significant strengthening in frequency in terms of La Niña events for the end of the century, accordingly with the results of the Keupp et al (2017). This is supported in our results by the increase found for the projected PC1 scores from present to RCP GCM simulations. Note that Tedeschi et al (2013) associated wet conditions in the north/northeast South America and dry conditions mainly in southern Brazil during La Niña events from observational data. Our results of wetter/drier/wetter pattern from north to south projected precipitation in South America are in agreement with the pattern found by Tedeschi et al (2016) associated with an increase extreme precipitation in the northern and southern South America and a decrease in the eastern Brazil during La Niña events. Additionally, in the regional study carried out by Marengo et al (2012), moderate precipitation decreases in the Amazon and Paraná Basins and a substantial decrease in São Francisco Basin are projected for the period 2071–2100, in accordance with our results, particularly the marked decrease over southeastern Brazil. A more comprehensible explanation of the projected changes in the precipitation would require the analysis of other variables such as the wet-day frequency and the wet-day mean precipitation and additional predictors (Mtongori et al 2016), in order to consider not only the dynamic response in the atmospheric circulation, but also the thermodynamic response such as moisture changes.
In some aspects, our results also agree with the review by Solman (2013) concerning the regional climate modeling over South America. That author concluded that most of the models reviewed presents wetter conditions for north of South America and drier conditions over the central-eastern zone of South America by the end of the 21st century, for JJA, coinciding with our results. On the other hand, there are some discrepancies in the decrease obtained for the north and south coast of Peru, where Solman indicates a moderate increase of the precipitation. Also there are disagreements in the increase in the north and northeast of Brazil, where Solman indicates a sharp decrease. Kitoh et al (2011) also obtain precipitation projections by designing a modelling experiment that forces a GCM by using projected sea surface temperatures, and also found, in agreement with our results, a band of increased precipitation placed in the north of South America, while precipitation in JJA is projected to decrease over most of Amazon by the end of the century. However, note that the methodology (downscaling or experiment design) reviewed or used in most of these works considers different regional climate models (RCMs), the scenarios used were not the new RCPs, and the used GCMs are not those from the CMIP5.
So, actually, comparing our results with those of other authors is problematic and limited because of the differences between the regions studied, the periods selected, the seasons considered, and the GCMs and scenarios analyzed. Additionally, the methodologies used can differ, with most studies employing dynamical downscaling and more focused on the climate of some specific regions as Brazil, Ecuadorian Andes or southern South America than on tropical America and many of them for present climate (Buytaert et al 2010, Johnson et al 2014, Valverde Ramírez et al 2006, Solman and Nuñez 1999, Mendes and Marengo 2010, Sánchez et al 2015). Therefore, the present study offers the novelty of being one of the few works dedicated to high-resolution change projections of boreal summer precipitation for tropical America using CMIP5 models. Also, it accurately reproduces the summer precipitation at local scale for the study region, thus proving to be a suitable technique for climate change studies, with the added advantage of minimal computation requirement. Therefore, the results of this work could be useful in developing control strategies focused on change mitigation in this diversified area.
Acknowledgments
Technological University of Chocó (UTCH) and COLCIENCIAS-Colombia by supported to R. Palomino-Lemus and S Córdoba-Machado under a scholarship. The Spanish Ministry of Economy and Competitiveness, with additional support from the European Community Funds (FEDER), project CGL2013-48539-R and the Regional Government of Andalusia, project P11-RNM-7941, which had financed this study. The GPCC dataset can be found in ftp://ftp.dwd.de/pub/data/gpcc/html/fulldata_v6_doi_download.html, the NCEP reanalysis data in www.esrl.noaa.gov/psd/data/gridded/data.ncep.reanalysis.surface.html, and CMIP5 GCM outputs in http://cmip-pcmdi.llnl.gov/cmip5/. We thank anonymous reviewers for valuable comments on the manuscript.