

Abstract
High temperatures and severe drought contributed to extensive tree mortality from fires and bark beetles during the 2000s in parts of the western continental United States. Several states in this region have greenhouse gas (GHG) emission targets and would benefit from information on the amount of carbon stored in tree biomass killed by disturbance. We quantified mean annual tree mortality from fires, bark beetles, and timber harvest from 2003–2012 for each state in this region. We estimated tree mortality from fires and beetles using tree aboveground carbon (AGC) stock and disturbance data sets derived largely from remote sensing. We quantified tree mortality from harvest using data from US Forest Service reports. In both cases, we used Monte Carlo analyses to track uncertainty associated with parameter error and temporal variability. Regional tree mortality from harvest, beetles, and fires (MORTH+B+F) together averaged 45.8 ± 16.0 Tg AGC yr−1 (±95% confidence interval), indicating a mortality rate of 1.10 ± 0.38% yr−1. Harvest accounted for the largest percentage of MORTH+B+F (∼50%), followed by beetles (∼32%), and fires (∼18%). Tree mortality from harvest was concentrated in Washington and Oregon, where harvest accounted for ∼80% of MORTH+B+F in each state. Tree mortality from beetles occurred widely at low levels across the region, yet beetles had pronounced impacts in Colorado and Montana, where they accounted for ∼80% of MORTH+B+F. Tree mortality from fires was highest in California, though fires accounted for the largest percentage of MORTH+B+F in Arizona and New Mexico (∼50%). Drought and human activities shaped regional variation in tree mortality, highlighting opportunities and challenges to managing GHG emissions from forests. Rising temperatures and greater risk of drought will likely increase tree mortality from fires and bark beetles during coming decades in this region. Thus, sustained monitoring and mapping of tree mortality is necessary to inform forest and GHG management.
Export citation and abstract BibTeX RIS
Corrections were made to this article on 19 June 2017 to make the full-text view consistent with the PDF.
1. Introduction
Forests help regulate Earth's climate in part by sequestering carbon from the atmosphere (Bonan 2008, Pan et al 2011a, Anderson-Teixeira et al 2012), yet tree mortality from disturbance accelerates carbon transfer from these ecosystems back to the atmosphere (Kurz et al 2008, Baccini et al 2012, Brinck et al 2017). Forests globally store a similar amount of carbon as the atmosphere (Pan et al 2011a, Houghton 2013), with much of the carbon (∼42%) held in the biomass of living trees (Pan et al 2011a). Disturbances such as forest fires, insect outbreaks, and timber harvest can kill trees over large areas each year (Goetz et al 2012, Meddens et al 2012, Kautz et al 2016, Williams et al 2016) and thus contribute to increased regional carbon emissions as tree biomass subsequently decomposes or is rendered into wood products that have finite longevity (Harmon et al 1990, Harmon et al 2011, Ghimire et al 2015). Carbon emissions from forest disturbance can challenge efforts to meet greenhouse gas (GHG) emission targets (Gonzalez et al 2015), but are also highly uncertain in many parts of the world (Pacala et al 2010). Both the growing global demand for wood products (FAO 2017) and the increase in forest disturbance due to ongoing climatic change (Allen et al 2010, Williams et al 2012, Kautz et al 2016) underscore the need to better understand carbon implications of tree mortality from disturbance.
Forest disturbance by fires and insects increased during recent decades in the western contiguous United States as the regional climate became warmer and more arid (Westerling et al 2006, Williams et al 2012, Dennison et al 2014, Hicke et al 2015, Abatzoglou and Williams 2016). Regional mean annual air temperature increased 0.8 °C–1.1 °C from 1895 to 2011, with most of the warming having occurred in recent decades (Mote et al 2014, Walsh et al 2014). Higher temperatures contributed to higher atmospheric vapor pressure deficits (Abatzoglou and Williams 2016), reduced mountain snowpack (Mote et al 2005), and more frequent and severe drought (McCabe et al 2004, Diffenbaugh et al 2015). For instance, the western US recently experienced its most severe drought (2000–2004) in the past 800 years (Schwalm et al 2012), with hot and dry conditions then prevailing through the 2000s (Diffenbaugh et al 2015, Abatzoglou and Williams 2016). These conditions contributed to extensive forest disturbance by fires and bark beetles relative to recent decades (Williams et al 2012, Creeden et al 2014, Abatzoglou and Williams 2016). High temperatures and drought increase regional forest fire occurrence (Littell et al 2016) and the likelihood of post-fire tree mortality (i.e. increased fire severity; van Mantgem et al 2013), while also increasing beetle populations and the vulnerability of drought-stricken trees to beetle attack (Raffa et al 2008, Creeden et al 2014, Hart et al 2014). Projections indicate that regional temperatures could rise another ∼3.8 °C–5.5 °C by the end of the 21st century and that much of the region, particularly the Southwest, could become increasingly arid and prone to drought under a high GHG scenario (RCP 8.5; Kunkel et al 2013, Walsh et al 2014, Cook et al 2015). These changes in regional climate could further accelerate tree mortality (Adams et al 2009, Allen et al 2015) and increase carbon emissions from forest ecosystems (Spracklen et al 2009, Jiang et al 2013, McDowell et al 2015).
Several states in the western US have GHG reduction targets (e.g. Oregon, California) and would thus benefit from information on the magnitude and primary causes of recent tree mortality. Prior studies have shown that fires, bark beetles, and timber harvest are important causes of tree mortality in this region (Masek et al 2011, Meddens et al 2012, Hicke et al 2015). In this study, we asked 'What was the magnitude and relative contribution of mean annual tree mortality from fires, bark beetles, and timber harvest from 2003–2012 both regionally and among the 11 western states?' Tree mortality can be quantified over large areas in terms of carbon using remote sensing estimates of tree aboveground biomass (AGB) together with information on the carbon content of AGB, as well as disturbance extent and severity (Baccini et al 2012, Hicke et al 2013). Here we quantified tree mortality as the amount of carbon stored in tree AGB (AGC) killed by disturbance (e.g., Mg AGC ha yr−1 or Tg AGC state yr−1). Specifically, we developed spatially explicit estimates of annual tree mortality from fires and bark beetles across regional forestland building off of a remote sensing framework from an earlier study (Hicke et al 2013). In addition to the remote sensing analysis, we estimated mean annual tree mortality from timber harvest for each state using harvest statistics from the US Forest Service (USFS; Smith et al 2009, Oswalt et al 2014). The USFS recently recommended that metrics related to fire and insect effects be used to track national climate change impacts (Heath et al 2015), further underscoring the importance of quantifying the magnitude and regional variation in tree mortality from these types of disturbance.
2. Methods
2.1. Geospatial data sets and preprocessing
2.1.1. General information
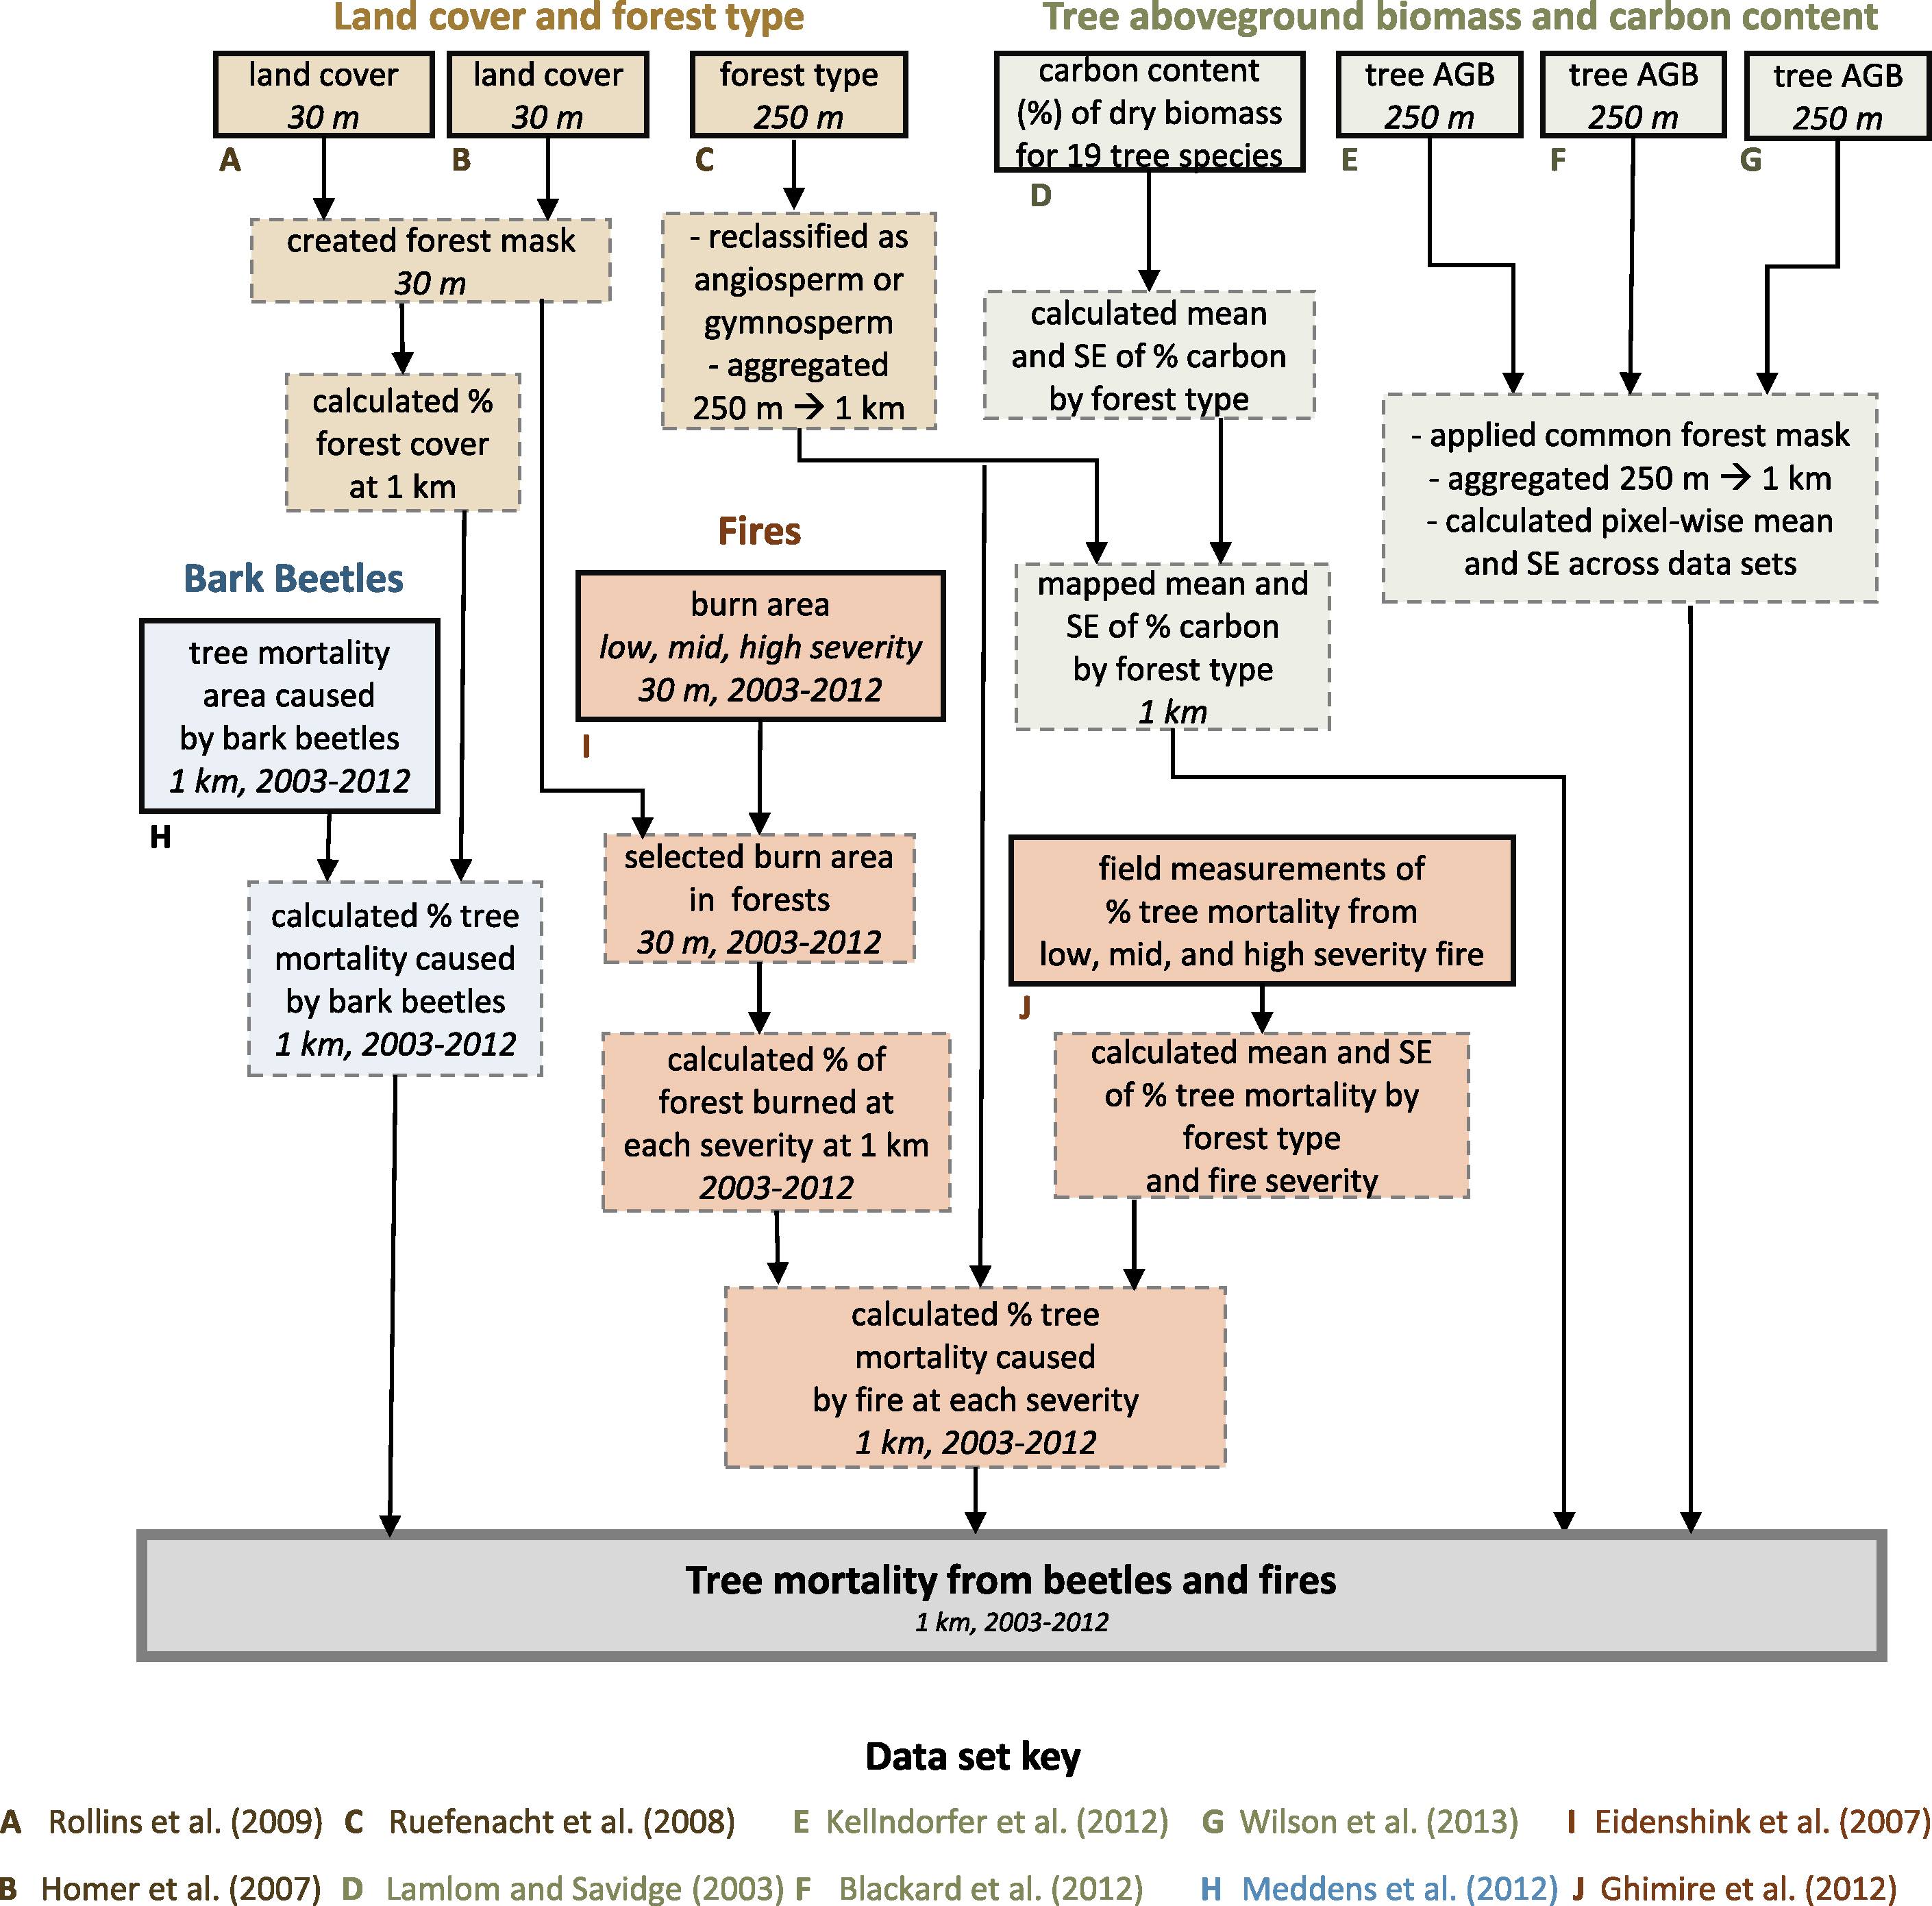
We quantified tree mortality from fires (MORTfire, Mg AGC ha−1 yr−1) and bark beetles (MORTbeetle, Mg AGC ha−1 yr−1) from 2003–2012 across 802 575 km² of forestland located in the western US (figure 1, 31.3°N–49.0°N, 102.0°W–124.5°W). Forestlands were included if consistently mapped as forest by three separate tree AGB data sets (described below). We conducted the analysis on a 1 km resolution grid in an Albers Equal Area projection, with the resolution chosen to match the bark beetle data set (Meddens et al 2012). We analyzed and visualized the data using ArcGIS 10 (ESRI, Redlands, CA) and R statistical software (version 3.2; R Core Team 2015), along with the R packages raster (Hijmans and van Etten 2013) and dplyr (Wickham and Francois 2015). The data preprocessing work flow described in the following section is illustrated in figure 2.
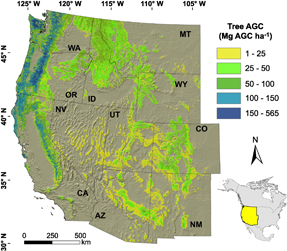
Figure 1 Study area extent, state boundaries, and live tree aboveground carbon (AGC) stocks on forestland in the western United States. Tree AGC stocks reflect conditions during the 2000s and are based on the average of three recent tree aboveground biomass data sets (Blackard et al 2008, Kellndorfer et al 2012, Wilson et al 2013) together with information on carbon content of dry biomass (Lamlom and Savidge 2003).
Download figure:
Standard image High-resolution image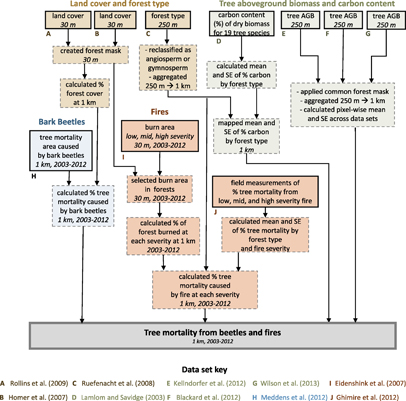
Figure 2 Workflow illustrating data sets (solid boxes) and processing steps (dashed boxes) for estimating tree mortality due to bark beetles and fires from 2003–2012 across the western United States (thick solid box). Data citations, spatial resolutions, and temporal ranges are shown where applicable.
Download figure:
Standard image High-resolution image2.1.2. Tree carbon stocks
We estimated tree AGC using three tree AGB geospatial data sets together with information on the fraction of dry biomass that is carbon (fcarbon). The tree AGB data sets were produced by spatially interpolating USFS inventory measurements (FIA) using satellite and geophysical data sets in conjunction with machine learning algorithms (Blackard et al 2008, Kellndorfer et al 2012, Wilson et al 2013). Wilson et al (2013) provided estimates of tree AGC assuming that fcarbon was 50%; we converted these estimates back to tree AGB by multiplying by 2. We acquired each data set at 250 m spatial resolution, reprojected it to an Albers Equal Area projection, and then applied a common mask that identified pixels consistently classified as forest among all data sets. Next, we aggregated from 250 m to 1 km resolution by computing total tree AGB in each 1 km pixel (i.e. Mg AGB pixel−1).
We quantify tree mortality from 2003–2012 and required estimates of tree AGB prior to disturbance. Two of these data sets represented tree AGB circa 2000 (Blackard et al 2008, Kellndorfer et al 2012), whereas the third depicted tree AGB circa 2003–2008 (Wilson et al 2013). Therefore we needed to estimate pre-disturbance tree AGB in pixels that were disturbed during these six years in the Wilson et al (2013) data set. We followed an existing approach (Hicke et al 2013) that involved comparing tree AGB in fire and beetles disturbed pixels against the average tree AGB of undisturbed pixels from the same forest type (Ruefenacht et al 2008) and ecoregion (Omernik 1987). If tree AGB in the disturbed pixel was less than the average tree AGB of undisturbed pixels, then we set tree AGB in the disturbed pixel to this average, but otherwise left the disturbed pixel unaltered. After implementing this correction, we then computed the average and standard error (SE) of tree AGB for each pixel over the three data sets ( , SEAGB). Lastly, we estimated the average and SE of fcarbon (
 , SEcarbon) for hardwood (angiosperm, 48.49 ± 0.42% C, n = 8) and softwood (gymnosperm, 50.87 ± 0.63% C, n = 11) tree species found in this region (Lamlom and Savidge 2003).
2.1.3. Forest fires
We used annual maps of fire severity from 2003–2012 produced by the Monitoring Trends in Burn Severity (MTBS) project (Eidenshink et al 2007). These maps were derived from 30 m resolution Landsat images acquired before and after fires larger than ∼405 ha in the western US. Fire severity was mapped using the differenced Normalized Burn Ratio (dNBR) and then each pixel was classified as one of five thematic severity classes. We focused on pixels that burned at low-, moderate-, or high-severity and excluded those that were unburned or showed post-fire greening. We identified fire in forests by generating a 30 m resolution forest mask based on forestland in either of two national land cover maps (Homer et al 2007, Rollins 2009). We then computed the annual fraction of forest area that burned at each severity (As) in each 1 km pixel over the decade. Lastly, we incorporated field measurements of the fraction of tree biomass killed at each severity (ffire). We computed the mean and SE of ffire ( , SEfire) for forests dominated by hardwood and softwood tree species based on 116 estimates of ffire synthesized from 29 field studies conducted in the western United States (table S1 available at stacks.iop.org/ERL/12/065005/mmedia, Ghimire et al 2012).
2.1.4. Bark beetles
We used annual maps depicting the areal extent of tree canopy mortality due to 12 bark beetle species that were produced from aerial surveys, forest inventory measurements, and high-resolution satellite imagery (Meddens et al 2012). The USFS National Forest Health Monitoring program conducts aerial detection surveys (ADS) that provide a coarse snapshot of insect and other forest disturbance at a landscape scale (Johnson and Wittwer 2008). Trained observers conduct surveys from fixed-wing aircraft that involve sketch-mapping the extent of areas affected by insect outbreaks and then visually estimating the number of dead trees within affected areas. Meddens et al (2012) used the ADS observations to estimate annual canopy mortality area due to bark beetles across the western US from 1997–2010, with estimates then extended through 2012 (Hicke et al 2015).
Canopy mortality area was estimated at 1 km resolution based on the number of recently killed trees and the average canopy area of each tree species. The ADS observations underestimated the number of trees killed by bark beetles in comparison with field observations and QuickBird (2.4 m resolution) satellite imagery from Colorado, Idaho, and New Mexico. This led to the development of adjustment factors for several forest types based on the ratio of dead trees mapped from satellite to ADS tree kill counts. These adjustment factors were then used to modify ADS tree kill counts, resulting in high and middle (most realistic) estimates as well as low estimates based on unaltered ADS numbers (more details in: Meddens et al 2012, Hicke et al 2015). The data set includes bark beetle species that cumulatively killed at least 100 000 trees across the domain from 1997–2010. Specifically, it includes (from greatest to least mortality area) mountain pine beetle (Dendroctonus ponderosae Hopkins), piñon ips (Ips confusus (LeConte)), Douglas-fir beetle (Dendroctonus pseudotsugae Hopkins), western balsam bark beetle (Dryocoetes confuses (Swaine)), and fir engraver (Scolytus ventralis LeConte), as well as seven additional beetle species that killed fewer trees. We masked these data to our domain and then summed canopy mortality area across bark beetle species for each 1 km pixel in a given year (i.e. a voxel) from 2003–2012. We then calculated annual tree canopy mortality fraction (fbeetle) for each voxel by dividing canopy mortality area by forest cover fraction. We incorporated the lower, middle, and upper estimates of fbeetle into our analysis.
2.2. Tree mortality from bark beetles and fires
We developed spatially explicit estimates of annual MORTbeetle and MORTfire from 2003–2012 and quantified uncertainty in these estimates using a Monte Carlo approach (e.g. Harmon et al 2007, Gonzalez et al 2015). The Monte Carlo involved generating 100 realizations of annual tree mortality in each voxel, where each realization iteratively varied tree  ,
,  , fbeetle, and
  based on uncertainty in each term. We assumed that tree AGC within a pixel only changed due to disturbance (i.e. no tree growth or recruitment), which potentially caused us to slightly underestimate tree mortality. For instance, stand age averaged 97 ± 73 years (± 1SD) in our study area (Pan et al 2011b). Field measurements from the Western Cascades (Hudiburg et al 2009) and the Rocky Mountains showed that tree AGC could increase 6%–7% between stands that are 97 and 106 years old. This simplifying assumption made it so that cumulative tree mortality within a pixel could not exceed the initial tree AGC. For each realization r we first computed tree AGC for pixel p of year t = 2003 as
where  and SEcarbon varied by forest type and ax was a random number from a normal distribution (mean = 0, SD = 1) that differed for each variable with each realization. The other variables are defined above. We then calculated MORTbeetle as

where  was an estimate of fbeetle drawn randomly from a triangular distribution defined uniquely for each voxel using the low, middle, and high estimates of fbeetle. Each distribution was fit using the triangle package in R (Carnell 2016). Next, we computed MORTfire as
We then reduced tree AGC stocks at the start of year t + 1 to account for mortality in year t, such that
We repeated equations 2–4 annually through 2012 and then repeated the entire process 100 times.
We then computed the mean and standard deviation (SD) of these multiple estimates of tree mortality for each voxel, where the SD represented uncertainty due to parameter error (e.g. SEAGB, SEfire). Altogether, this process yielded spatially explicit estimates of annual tree mortality (and uncertainty) caused by fires and bark beetles from 2003–2012 across forestland in the western United States.
Following the geospatial analysis, we estimated mean annual tree mortality from fires ( ) and bark beetles (
 ) for each state from 2003–2012 and used a Monte Carlo analysis to propagate uncertainty in these estimates associated with parameter error and temporal variability. As illustrated for fires (identical for beetles), we first derived 1000 realizations r of annual tree mortality in each state from t = 2003 to 2012, as per
and then summarized (mean and SD) each set of realizations. We used these annual statewide summaries to then repeatedly (Nr = 1000) estimate both the mean and SE of annual mortality from 2003–2012 for each state, where each realization randomly varied annual statewide mortality by its parameter error (i.e. SD computed above). We again summarized (mean and SD) each set of realizations for both statistics. This yielded an estimate of  for each state and produced estimates of uncertainty in due to parameter error (i.e. SD of estimates of ) and temporal variability (i.e. mean of estimates of SE of annual mortality).
In the final step, we derived a 95% confidence interval (CI) around each estimate of that accounted for both parameter error and temporal variability. This involved repeatedly estimating for each state, where each realization randomly varied by uncertainty associated with both parameter error and temporal variability. We then computed the 95% CI (Gonzalez et al 2015) for each state, as per

where  and
and  were the 97.5th and 2.5th percentiles of 1000 realizations of . Overall, this approach yielded estimates of mean annual tree mortality (±95% CI) due to fires and bark beetles from 2003–2012 for each state in the western US. We present these estimates both in terms of absolute tree mortality (Tg AGC yr−1) and mortality rate (i.e. % of statewide
  in tree biomass killed each year).
2.3. Tree mortality from timber harvest
We estimated mean annual tree mortality caused by timber harvest from 2003–2012 for each state ( , Tg AGC yr−1) using timber product output surveys from several USFS reports along with information on tree characteristics. We again used a Monte Carlo analysis to propagate uncertainty in that was associated with parameter error and temporal variability. The USFS reported harvest for each state in terms of mean annual growing stock volume (GSV, m3 yr−1) removed from c. 2003 to 2007 (Smith et al 2009) and c. 2008 to 2012 (Oswalt et al 2014). Harvest was reported separately for hardwood and softwood tree species. We calculated mean annual GSV removed across these two periods for both species groups in each state (
 ). In each case, we then estimated from using information on the ratio of total aboveground tree volume to GSV(R), wood density (WD, Mg m−3), and the fraction of dry woody biomass that is carbon (fcarbon), as per

We repeatedly (Nr = 1000) estimated for both species groups in each state as part of the Monte Carlo analysis, which again involved randomly varying each parameter by its uncertainty (e.g. as shown in equation (1)). It was not possible to directly compute the uncertainty (SE) associated with temporal variability in the amount of GSV annually removed since annual harvest data were not available for each state. We therefore assumed that the SE was 4.6% of based concurrent annual harvest data from Oregon, which accounted for 35% regional harvest (Oregon Department of Forestry 2017). We used estimates of average R ( ) that varied for hardwoods and softwoods, as well as among states in different USFS regions (Birdsey 1992), assuming in each case that the SE was 2% of (Levy et al 2004). We computed average WD (
 ) and its uncertainty (SEWD) for both species groups in each state by (1) identifying the four tree species in each group that accounted for the largest percentages of total tree AGB on USFS inventory plots surveyed 2003–2012 (Smith 2002) and then (2) summarizing WD measurements among these species (Miles and Smith 2009). After repeatedly estimating , we then derived the average and associated 95% CI from each set of 1000 realizations (e.g. equation (6)). We report (± 95% CI) for each state both in terms of absolute mortality (Tg AGC yr−1) and mortality rate (% yr−1).
3. Results
3.1. Regional tree mortality from disturbance
Taken together, mean annual tree mortality from timber harvest, bark beetles, and fires ( ) was 45.8 ± 16.0 Tg AGC yr−1 from 2003–2012 across the western US. Regional tree
  stocks totaled 4.16 ± 0.12 Pg, suggesting that the tree mortality rate was 1.10 ± 0.38% yr−1. Timber harvest accounted for the largest percentage of (50%), followed by bark beetles (32%) and then fires (18%, figure 3, table S2).
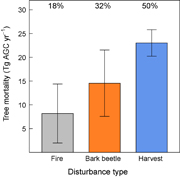
Figure 3 Regional mean annual tree mortality from fires, bark beetles, and timber harvest from 2003–2012 on forestland in the western United States. Tree mortality was quantified as the amount of aboveground carbon (AGC) stored in tree biomass killed by disturbance (Tg AGC yr−1). Tree mortality from bark beetles and fires was derived using remote sensing, whereas harvest was derived from USFS forest resource assessments (Smith et al 2009, Oswalt et al 2014). Error bars depict 95% confidence intervals computed with a Monte Carlo analysis and incorporate temporal variability and parameter error. We estimated that regional mean annual tree mortality from fires, beetles, and harvest was 45.8 ± 16.0 Tg AGC yr−1 from 2003–2012, with fires, beetles, and harvest accounting for 18%, 32%, and 50% of annual mortality, respectively.
Download figure:
Standard image High-resolution image3.2. Tree mortality from fire
Mean annual tree mortality from fires ( ) was 8.2 ± 6.2 Tg AGC yr−1 and the mortality rate was 0.20 ± 0.15% yr−1 from 2003–2012 in the western US (figures 3, 4(a), 5, table S2). Absolute was highest in northern California, central Idaho, and western Montana, with these states accounting for 64% of regional . Forests in Arizona and New Mexico experienced the highest annual rates of (0.36%–0.57% yr−1), as well as the highest percentage of caused by fire (51%–55%). Conversely, forests in Colorado, Oregon, and Washington had the lowest rates of (0.03%–0.08% yr−1) and the lowest percentage of caused by fire (2%–8%). Fires that occurred in Oregon and Washington were largely concentrated along the eastern slopes of the Cascade Range.

Figure 4 Cumulative tree mortality due to (a) fires and (b) bark beetles from 2003–2012 on forestland in the western United States. Tree mortality was quantified as the amount of aboveground carbon (AGC) stored in tree biomass killed by disturbance (e.g. Mg AGC ha−1). Note that (a) tree mortality from fire was concentrated in northern California, central Idaho, and southern Arizona/New Mexico, whereas (b) tree mortality from bark beetles occurred widely at low levels, but was highest in northern Colorado and western Montana.
Download figure:
Standard image High-resolution image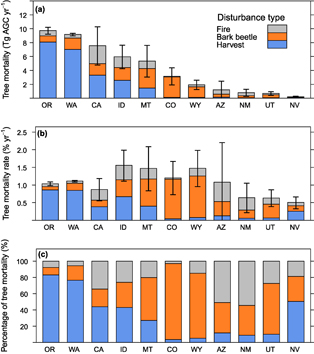
Figure 5 Mean annual tree mortality from fires, bark beetles, and timber harvest on forestland from 2003–2012 for each state in the western US. Tree mortality was quantified as the amount of aboveground carbon (AGC) stored in tree biomass killed by disturbance. Mean annual tree mortality is summarized in terms of (a) absolute mortality (Tg AGC yr−1), (b) mortality rate (percentage of statewide AGC in tree biomass killed per year, % yr−1), and (c) percentage of mortality caused by each type of disturbance (%). Tree mortality from bark beetles and fires was derived using remote sensing, whereas harvest was derived from USFS forest resource assessments. Error bars depict 95% confidence intervals that were computed using a Monte Carlo analysis and incorporate temporal variability and parameter error from all three types of disturbances.
Download figure:
Standard image High-resolution image
3.3. Tree mortality from bark beetles
Mean annual tree mortality from bark beetles ( ) was 14.6 ± 7.0 Tg AGC yr−1 and the mortality rate was 0.35 ± 0.17% yr−1 from 2003–2012 in the western US (figures 3, 4(b), 5, table S2). Absolute was highest in northern Colorado, western Montana, and central Idaho, with these states accounting for 52% of regional (table S2). Forests in Colorado and Wyoming had the highest annual rates of (1.12%–1.22% yr−1) and the highest percentage of caused by bark beetles (80%–93%). Conversely, Oregon and Washington had not only two of the lowest rates of , but also two of the lowest rates of (0.10%–0.20% yr−1).
3.4. Tree mortality from timber harvest
Mean annual tree mortality from timber harvest ( ) was 23.0±2.8 Tg AGC yr−1 and the mortality rate was 0.55±0.07% yr−1 from 2003–2012 in the western US (figures 3, 5, table S2). Timber harvest in Oregon and Washington accounted for 67% of regional . These two states had the highest rates of (0.85%–0.86% yr−1) and the highest percentage of caused by harvest (76%–83%). Conversely, forest in Colorado, Utah, and New Mexico had the lowest rates of (0.04%–0.06% yr−1) and among the lowest percentage of caused by harvest (3%–10%).
4. Discussion
4.1. Regional tree mortality from disturbance
In this study, we quantified tree mortality caused by timber harvest, bark beetles, and fire from 2003–2012 across the western US. We found that regional mean annual tree mortality from timber harvest (∼23 Tg AGC yr−1) was quite similar in magnitude to the mortality from fires and bark beetles combined (∼22 Tg AGC yr−1). Regional timber harvest declined about 40% since the 1980s (Oswalt et al 2014), yet harvest still caused significantly more tree mortality than bark beetles or fires during the 2000s, a period during which hot and dry conditions contributed to extensive beetle and fire activity relative to the last several decades (Williams et al 2012, Hicke et al 2015, Meddens et al 2015, Abatzoglou and Williams 2016, Cohen et al 2016).
Our regional tree mortality estimates were comparable with several other studies from the western US. For instance, forest inventories indicated that the regional tree mortality rate was ∼0.72%–0.92% yr−1 during the 2000s in areas unaffected by harvest or land clearing (Oswalt et al 2014). By comparison, we estimated that the tree mortality rate from fires and bark beetles combined was ∼0.56% yr−1, suggesting that these disturbances together might have accounted for ∼60%–80% of regional tree mortality not associated timber harvest or land clearing. Our estimates of tree mortality from fires and bark beetles were also of similar magnitude to those predicted using the CASA (Carnegie–Ames–Stanford Approach) carbon cycle model with fire (Ghimire et al 2012) and beetle (Ghimire et al 2015) disturbances prescribed using MTBS and ADS data sets, respectively. Lastly, our estimates of regional MORTH+B+F in 2003 and 2004 differed by ±5% from estimates of tree mortality due to all forms (undifferentiated) of disturbance that were derived using a regional sample of Landsat scenes from 1986–2004 (Powell et al 2014). Similarity among these field, modeling, and remote sensing estimates of regional tree mortality is encouraging. Together these comparisons suggest that timber harvest, bark beetles, and fires were the primary causes of tree mortality from disturbance during the 2000s in the western US.
Our current estimates of cumulative (2003–2012) regional tree mortality from fires and bark beetles were both ∼40% lower than earlier best-estimates reported by Hicke et al (2013). This downward revision stemmed from refinements in representation of tree AGB, more realistic parameterization of tree mortality from fire, and a routine that tracked prior tree mortality within each grid cell. Estimating tree mortality in terms of carbon necessitated accurate representation of tree AGB; however, estimates of tree AGB differ among available data sets, particularly at the pixel scale (figure S1; Huang et al 2015, Neeti and Kennedy 2016). We therefore chose to incorporate an ensemble of available data sets (Blackard et al 2008, Kellndorfer et al 2012, Wilson et al 2013) rather than rely on a single data set as was done in the prior study (Hicke et al 2013). This improvement accounted for ∼10% of the reduction in tree mortality between studies and allowed us to propagate uncertainty in tree AGB into our estimates of mortality. Our current analysis also used a regional synthesis of field measurements (Ghimire et al 2012) to vary tree mortality fraction by forest type and fire severity rather than assume complete tree mortality in areas that burned at moderate or high severity (Hicke et al 2013). This further reduced our estimates of tree mortality from fire. Lastly, we found that 39% of the forested grid cells (1 km2) registered multiple disturbances during this decade. We therefore implemented a routine that reduced tree AGB each time a disturbance occurred, which reduced the amount of tree AGB killed by subsequent disturbance. These improvements enabled more robust estimation of how much carbon was stored in trees recently killed by fires and beetles across the western US.
The carbon in trees killed by disturbance will be emitted to the atmosphere as dead trees decompose in the forest and as harvested trees are processed into wood products with varying efficiency and longevity (Harmon et al 1990, Harmon et al 2011, Hudiburg et al 2011). Ignoring pyrogenic emissions, mean annual tree mortality from fire and beetles could together lead to emission of ∼0.8 Tg C yr−1 during the following decade assuming exponential decay and an intermediate rate constant (k = 0.04; Harmon et al 1986). Actual decomposition rates will depend on the interplay among snag fall rate, microclimate, wood chemistry, tree anatomy, and other factors (Weedon et al 2009, Harmon et al 2011). Similarly, mean annual tree mortality from harvest could lead to emission of around 1.3 Tg C yr−1 during the following decade assuming that (1) 60% of harvested material went to fuels, paper, and residues that lasted < 5 years (Harmon et al 1990) and that (2) the remaining 40% of material went to longer term storage that remained unchanged during the first decade. In other words, tree mortality from harvest, bark beetles, and fires averaged 45.8 ± 16.0 Tg AGC yr−1, yet annual emissions are potentially closer to 2 Tg C yr−1 during the first decade following disturbance and will persist for decades to centuries. By comparison, regional fossil fuel emissions averaged ∼260 Tg C yr−1 during this period (US Energy Information Administration 2015). More accurate assessment of the timing and magnitude of carbon emissions requires using robust ecosystem models and life cycle assessments (e.g. Hudiburg et al 2011, Ghimire et al 2015).
4.2. Tree mortality from fire
Tree mortality from fire was highest in the Southwest, with regional variation in mortality associated with differences in drought severity and human activities. States with more consistently severe summer drought tended to have the highest average tree mortality rate from fires (e.g. Arizona), whereas states that experienced less consistently severe drought tended to have lower mortality from fires (e.g. Oregon, figures S2, S3). Hot and dry conditions increase fuel flammability and fire occurrence among forests in the western US (Littell et al 2009, Morton et al 2013, Abatzoglou and Williams 2016). Furthermore, drought-stricken trees are more likely to die if a fire does occur (van Mantgem et al 2013), potentially because of more extensive xylem cavitation and hydraulic impairment during a fire (Michaletz et al 2012, van Mantgem et al 2013).
Human activities, including fire ignition and suppression, also affected regional variation in fire activity. Human fire ignitions were responsible for ∼32% of the total area burned in the western US from 1992–2012 and were concentrated among the more densely populated coastal states (Balch et al 2017). Humans were the primary cause of fire ignitions in California (Balch et al 2017), where drought-affected forests experienced the highest tree mortality from fire of any western state (∼2.6 Tg AGC yr−1). The federal government recently spent ∼$400 million per year on fire suppression in California, which accounted for about half of the federal expenditure on fire suppression in the western US (Kenward and Raja 2013). Nevertheless, plant mortality from fire averaged ∼4.3 Tg AGC yr−1 across all of California's ecosystems from 2001–2010, which led to an estimated 8% net reduction in statewide plant AGC and complicated efforts to reduce GHG emissions (Gonzalez et al 2015).
It is widely perceived in California and other parts of the region that beetle-killed trees increase subsequent risk of fire (Heller 2017), yet recent studies indicate that beetle outbreaks have not increased burn area (Hart et al 2015, Meigs et al 2015a) or fire severity in the region (Bond et al 2009, Meigs et al 2016, Reilly and Spies 2016). Similarly, we found no association between statewide tree mortality rates from fires and beetles (P = 0.88), though lagged effects and the spatial scale of this comparison could mask potential interactions.
The MTBS data set provides a valuable record of fire extent and severity across the nation (Eidenshink et al 2007), though additional efforts are needed to better quantify fire severity (Kolden et al 2015). It is also important to better understand how mortality differs among co-occurring trees species with different functional traits (e.g. bark thickness; Pausas 2015). Projected shifts towards a hotter, drier climate could potentially increase fire activity in the Southwest and other dry parts of the region over the coming century (Spracklen et al 2009, Williams et al 2014), contributing to increases in tree mortality, cost of wildfire management, and GHG emissions.
4.3. Tree mortality from bark beetles
Tree mortality from bark beetles was pervasive at low levels across the region, though was pronounced in the Rocky Mountains (e.g. Colorado) where beetles accounted for ∼80% of . Mountain pine beetles were responsible for ∼62% of tree mortality area (5.37 Mha) caused by bark beetles from 1997–2010 in the western US and largely affected lodgepole pine (Meddens et al 2012, Hicke et al 2015). In this region, lodgepole pine occur most extensively in the Rocky Mountains, where stands were generally of an age (80–120 years) and stem density (>500 stems ha−1) that rendered them more susceptible to beetle attack than lodgepole pine in the coastal states, which tended to be younger and less widespread (Hicke and Jenkins 2008). Forests in the Rocky Mountains also experienced long-term warming that increased beetle populations by reducing beetle mortality during winter and accelerating beetle development (Logan and Powell 2001, Creeden et al 2014). Furthermore, states with the most severe singe-year summer drought tended to have the highest average tree mortality rate from beetles (e.g. Colorado, Wyoming), whereas states that experienced less acute drought tended to have lower mortality from beetles (e.g. Oregon, figure S4). High tree mortality from beetles in the Rocky Mountains has been linked to acute drought that weakened tree defense against beetle attack (Creeden et al 2014, Hart et al 2014) in stands already subject to high structural susceptibility and larger beetle populations (Logan and Powell 2001, Hicke and Jenkins 2008).
Lower tree mortality from beetles in other parts of the region could reflect less severe drought (Abatzoglou and Redmond 2017), lower stand susceptibility (Hicke and Jenkins 2008), and different host and beetle species. Low insect-caused mortality among wet coastal forests (Meddens et al 2012, Meigs et al 2015b, Reilly and Spies 2016) might be linked to higher tree species diversity (Waring et al 2006) limiting host availability and population size of host-specific beetle species (Anderegg et al 2015). The coastal forests also tend to be younger than forests in the Rocky Mountains (Pan et al 2011b) due to more extensive timber harvest (Masek et al 2011), which might reduce the likelihood of beetle attack since beetles tend to prefer large old trees (Raffa et al 2008). On the other hand, land-use activities that homogenize forest structure and composition can increase the likelihood of beetle outbreaks (Raffa et al 2008). Future efforts are needed to reduced uncertainty in the causes, extent, and severity of bark beetle outbreaks (Meddens et al 2012, Gartner et al 2015) given that rising temperatures and local land use activities could amplify tree mortality from bark beetles over the coming century in parts of this region (Hicke et al 2006, Raffa et al 2008).
4.4. Tree mortality from harvest
Tree mortality from timber harvest was highest in Oregon and Washington and accounted for ∼80% of in these states. Much of the timber harvest in these states occurs in highly productive coastal forests, where rates of timber extraction per unit of forest area are the highest in the country (Masek et al 2011, Law and Waring 2015). These coastal forests were a net source of carbon to the atmosphere during the 1980s due to high rates of timber harvest, though declines in harvest following implementation of the Northwest Forest Plan in 1994 led forests on public lands to became a net carbon sink during the 2000s (Turner et al 2011). Forests in Oregon and northern California currently store ∼3.2 Pg C, yet could theoretically store ∼5.9 Pg C if stand-replacing disturbances did not occur on the landscape (Hudiburg et al 2009). Recent tree mortality from timber harvest far exceeded tree mortality caused by both bark beetles and fires in the Pacific Northwest, highlighting that reductions in timber harvest could help these states meet GHG emission reduction targets. Continued warming and drying could reduce the amount of tree biomass available to be harvested in the Interior West over the coming century (Williams et al 2012, Jiang et al 2013, Berner et al 2017), yet it is currently unclear how the net effects of ongoing climate change will affect tree biomass and resource availability in the Pacific Northwest (Hudiburg et al 2013, Jiang et al 2013, Kang et al 2014, McDowell et al 2015).
5. Conclusions
Timber harvest, bark beetles, and fires were important causes of tree mortality from 2003–2012 across forests in the western US. This was a period during which high temperatures contributed to severe drought that increased both fire and bark beetle activity relative to recent decades. Regional tree mortality from these disturbances together averaged 45.8 ± 16.0 Tg AGC yr−1, with harvest accounting for a significantly larger percentage (50%) than bark beetles (32%) or fires (18%). The amount of carbon in tree aboveground biomass killed each year by these disturbances was equivalent to ∼18% of concurrent regional carbon emissions from fossil fuel consumption (US Energy Information Administration 2015). Tree mortality from timber harvest was concentrated in the high-biomass forests of the Northwest, where it accounted for ∼80% of the mortality caused by these three types of disturbance. Shifts in management priorities in the Northwest could reduce tree mortality and subsequent GHG emissions as a means of mitigating climate change. Bark beetles caused tree mortality widely across the region, thought mortality was concentrated in the Rocky Mountains. Tree age and high stem density in these mountain forests made them susceptible to beetle attack, while rising air temperatures increased beetle populations and caused drought-induced reductions in tree defense against beetle attack. Lastly, tree mortality from fires peaked in California, where high temperatures increased fuel aridity and human activities increased fire ignitions. Tree mortality from bark beetles and fires will likely increase in parts of the regions over the coming decades as anthropogenic GHG emissions drive higher temperatures and increased risk of drought. Efforts to manage natural resources and meet GHG emission targets will all benefit from better understanding of the magnitude, location, and causes of tree mortality.
Data Availability
Our geospatial estimates of tree mortality from fires and bark beetles will be publicly archived with Oak Ridge National Laboratory at the Distributed Active Archive Center for Biogeochemical Dynamics (https://daac.ornl.gov/). This data set includes annual estimates of tree mortality and uncertainty from 2003 to 2012 at 1 km spatial resolution for the western US.
Acknowledgments
LTB was supported by NASA Headquarters under the NASA Earth and Space Science Fellowship Program (Grant NNX14AN65H) and by the ARCS Foundation Scholar program. BEL and JAH were supported by the USDA National Institute of Food and Agriculture (Grant 2013–67003-20652). AJHM was supported by the Interior Northwest Climate Science Center (NW CSC) through a Cooperative Agreement (G14AP00177) from the United States Geological Survey (USGS). The contents of this article are solely the responsibility of the authors and do not necessarily represent the views of the NW CSC or the USGS. We thank the two reviewers for their helpful comments, and Mark Harmon and Ariel Muldoon for guidance on uncertainty analysis using Monte Carlo. We cite no conflicts of interest.