

Abstract
Feedbacks between climate warming, land surface aridity, and wildfire-derived aerosols represent a large source of uncertainty in future climate predictions. Here, long-term observations of aerosol optical depth, surface level aerosol loading, fire-area burned, and hydrologic simulations are used to show that regional-scale increases in aridity and resulting wildfires have significantly increased summertime aerosol loading in remote high elevation regions of the Intermountain West of the United States. Surface summertime organic aerosol loading and total aerosol optical depth were both strongly correlated (p < 0.05) with aridity and fire area burned at high elevation sites across major western US mountain ranges. These results demonstrate that surface-level organic aerosol loading is dominated by summertime wildfires at many high elevation sites. This analysis provides new constraints for climate projections on the influence of drought and resulting wildfires on aerosol loading. These empirical observations will help better constrain projected increases in organic aerosol loading with increased fire activity under climate change.
Export citation and abstract BibTeX RIS

Original content from this work may be used under the terms of the Creative Commons Attribution 3.0 licence. Any further distribution of this work must maintain attribution to the author(s) and the title of the work, journal citation and DOI.
1. Introduction
In the Western US, recent research has documented a widespread decline in winter snow accumulation and associated increases in land surface aridity (Mote et al 2005, Barnett et al 2008). Ecosystem response to hydrologic change has been documented with increases in wildfire across the western US coinciding with trends of intensifying drought severity (Westerling et al 2006, Pierce et al 2013, Dennison et al 2014, Abatzoglou and Williams 2016). In the Western US the average area burned by wildfire per year is projected to increase by up to a factor of four per degree Celsius of warming (Solomon et al 2011). Recent simulations show that anthropogenic climate change accounted for ∼55% increase in forest fuel aridity from 1979 to 2015 in the Western US, adding nine days of high fire potential between 2000 and 2015 (Abatzoglou and Williams 2016). Barbero et al (2015) and Liu et al (2016) projected increased fires and associated particulate matter, respectfully, at regions across the West due to climate change. While we recognize these projects have limitations, as described by McKenzie and Littell (2016), it appears clear that wildfires will likely increase in the West. These fires emit large quantities of aerosols into the atmosphere, which impact climate, air quality and visibility, and human health (e.g. Akimoto 2003, Seinfeld and Pandis 2012). Aerosols can scatter and absorb solar radiation modifying the radiative balance of the atmosphere. Organic aerosols primarily scatter solar radiation (e.g. Kanakidou et al 2005), increasing atmospheric optical depth (AOD) and resulting in a reduction of solar radiation at the surface. In remote regions of the West, organic aerosols often dominate the mass of particulate matter in the atmosphere (Zhang et al 2007, Hand et al 2013). Wildfires in the West are expected to increase summertime atmospheric organic aerosol concentration 40% by the 2050s (Spracklen et al 2009). Unlike the rest of the US, visibility has not improved in the intermountain region during the last two decades and, in fact, certain types of aerosols are increasing (Hand et al 2013, Collaud Coen et al 2013).
The feedbacks between land surface aridity, atmospheric composition, and atmospheric transmissivity are fairly well established (e.g. Hand et al 2014). Future increases in aridity are expected to result in an increase in aerosol loading, which then decreases solar irradiance resulting in a decreased land surface temperature. The strength of this feedback mechanism is largely dependent on the magnitude of future aerosol loading (IPCC, Climate Change 2013). While the regional climate response to future aerosol loading in the Western US is uncertain, previous works have established that decreases in summer insolation lead to decreases in the intensity of the North American summer monsoon (Harrison et al 2003, Diffenbaugh et al 2006), highlighting a potential positive feedback cycle in which increased aerosol loading resulting from increases in a fire may exacerbate drought by decreasing insolation and weakening the North American monsoonal flow. Given recent increases in Western US wildfire activity, the linkages between land surface aridity, wildfire, and aerosol loading may act as a primary driver of regional climate response to global-scale warming. Hence, identifying these linkages and predicting future aerosol loading is critical for understanding feedback mechanisms between climate and wildfire activity and for developing emission control policies for governing air quality (Watson 2002). The objective of this research is to explicitly identify the linkages between aerosol loading, land surface aridity and wildfire activity over the mountainous Western US. These relationships provide new constraints for climate projections on the influence of drought and wildfires on aerosol loading within specific ecoregions.
2. Methods
Long-term observations of AOD, surface level aerosol loading, fire-area burned, and model-estimates of land surface aridity from the variable infiltration capacity (VIC) model were used to show linkages between drought, wildfire, and summertime aerosol loading in remote high elevation regions of the Intermountain West. Specifically, correlations between annual ecoregion land surface aridity and wildfire area (each treated as independent variables) and AOD and organic carbon concentration (each treated as dependent variables) were evaluated. Each of these data sets, and associated statistical methods, are described below.
2.1. Aerosol optical depth
Long-term ground based AOD data sets available from a variety of networks in the remote high elevation Intermountain West (defined by a bounding box from −110.5 to −105.5 longitude and 46.0–33.5 latitude, and elevation greater than 1200 m) were used to investigate the relationship between aerosol loading and aridity/fire area burned. AOD sites were used only if data for more than 10 summers (day of year 170–220) were available. AOD at 500 nm was obtained from a visible multifilter rotating shadowband radiometer deployed at Storm Peak Laboratory (SPL) in Northwestern Colorado, as part of the US. Department of Agriculture's ultraviolet radiation monitoring network (Bigelow et al 1998). Calibrated, cloud-screened data from 1999 to 2011 and in 2013 were used (Hallar et al 2015). The summertime definition (day of year 170–220, mid June to early August) was based on the strong seasonal increase in aerosol loading observed previously at SPL (Hallar et al 2015). Additionally, the NASA AErosol RObotic NETwork (AERONET) data were utilized (Holben et al 1998), and one site in the Sevilleta National Wildlife Refuge (SEV) in New Mexico provided more than 10 years of high quality summer Level 2 AOD data at 500 nm between 1995 and 2013. The NOAA SURFRAD network was not used, as all sites within this western region are at low elevations or strongly impacted by local urban aerosols.
2.2. Organic carbon concentration dataset
Forty-two Interagency Monitoring of PROtected Visual Environments (IMPROVE) sites fit the criteria of area and elevation, described above. Similar to the criteria above, IMPROVE sites were only considered if more than 10 years of summertime data were available. This criterion eliminated nine sites within the Intermountain West. IMPROVE sites are located in national parks, monuments, or similar areas and represent regional background conditions (Malm et al 1994). The IMPROVE network uses 24 h filters that are collected every third day. Strengths of the IMPROVE data are the length of the record, the number of sites, and consistent monitoring and analysis techniques (Murphy et al 2011). All IMPROVE organic carbon analyzes on quartz-fiber filters were performed at the same laboratory following the same protocols, as well as consistent calibrations and quality assurance (Chow et al 1993).
2.3. Calculation of aridity
Aridity was calculated for each Level 3 ecoregion (Commission for Environmental Cooperation 2005) in the Intermountain West (i.e., Southern Rockies, Wasatch/Uinta Range, Middle Rockies Arizona/New Mexico Mountains) on an annual basis. Aridity data were calculated by water year (1 October–30 September). In this regard, aridity was computed using a product derived exclusively from station observations of precipitation and temperature gridded to a 1/16° (∼6 km) latitude-longitude grid (Livneh et al 2015). Potential evapotranspiration (PET) was calculated from this same data set using a Penman–Monteith approach based on the MT-CLIM preprocessor, contained within the VIC hydrology model (Liang et al 1994, Bohn et al 2013). We expect that estimates of aridity using this approach will be conservative, as an independent analysis has demonstrated a slight wet bias in MT-CLIM over the western US (Pierce et al 2013). We implemented an aridity index most similar to the UNEP (1992) expression that directly relates potential evaporation to precipitation. Other expressions exist, but essentially all express the relationship between moisture and energy availability (e.g. Budyko 1958). Littell et al (2016) contend that extended periods of aridity are not necessarily required for increased risk of fire and that anomalous aridity of 30 d or more is sufficient to dry both dead (Cohen and Deeming 1985, Riley et al 2013) and live fuels. An assumption of this work is that dry conditions for the entire summer period are suffice to increase fire risk.
2.4. Total fire area burned
A majority of fires occur in the Intermountain western US in the summertime. For example, the fire climatology (1980–1995) presented by Knapp (1998) found that 93% of large fires in the Intermountain western US occurred during the summer months (June, July, August).
Total annual fire area was summed for each Level 3 ecoregion in the Intermountain West. Fire area data were obtained from the Monitoring Trends in Burn Severity (MTBS) program. These data were generated from Landsat surface reflectance measurements using the differenced Normalized Burn Ratio algorithm. Using this algorithm the USGS Center for Earth Resources Observation and Science and US Department of Agriculture-Forest Service Remote Sensing Applications Center has mapped all fires since 1984 greater than 1000 acres (404 hectares) in the Western US (Eidenshink et al 2007).
3. Results and discussion
3.1. Aerosol optical depth and aridity
Within mountain ranges of the Intermountain western US, average summertime AOD and aridity exhibit a significant, strong positive correlation (R) (e.g. greater than 95% confidence in the Southern Rockies, Wasatch/Uinta Range, and Arizona/New Mexico Mountains (see table 1).
Table 1. Correlation between year-to-year summertime aridity (PET/P) and summertime average AOD at 500 nm (SPL: 1999–2013 and SEV: 1995–2013) shown in first two columns; column 3–15 show correlation between year-to-year summertime aridity (PET/P) and summertime average organic aerosol loading at each IMPROVE site (1989–2013). First, correlations are shown as Pearson product moment correlation coefficient (R) in black ink. Next, the numbers in parentheses are the probability value (p) using 2-tailed student T-test. Correlations listed are greater than 95% confidence. NC = No Correlation, red = 99.9% confidence or greater (<0.001), green = 99.0% confidence or greater (<0.01), purple = 95% confidence or greater (<0.05).
|
As an example, figure 1 shows a comparison between AOD for SPL and Sevilleta (SEV) versus spatially distributed regional estimates of surface aridity for the Southern Rockies. There is a strong correlation between aridity and AOD with R of 0.81 and 0.63 for SPL and SEV, respectively (p < 0.02).

Figure 1. Annual average observed summertime AOD (500 nm, right axis) at the Storm Peak Laboratory, Colorado [SPL] and Sevilleta, New Mexico [SEV] and aridity for the Southern Rockies region (left axis). Inset figure is a scatter plot of aridity verses AOD at both SPL and SEV for the same time period and region.
Download figure:
Standard image High-resolution image3.2. Organic aerosol loading and aridity
Twelve high elevation IMPROVE sites in Arizona, Wyoming, Colorado, Montana, and Utah demonstrated a significant correlation [p < 0.05] between surface level summertime organic aerosol loading and spatially distributed estimates of aridity (table 1). Of all chemical species in the IMPROVE database, organic aerosol loading had the greatest correlation with aridity. For example, using the aridity product from the Southern Rockies and the IMPROVE dust proxy (Ca) data, a correlation coefficient of less than 0.4 is found at Mount Zirkel Wilderness Area (MOZI), Weminuche Wilderness Area (WEMI) and White River National Forest within Colorado. In comparison, a correlation coefficient greater than 0.65 is found between the aridity product from the Southern Rockies and the IMPROVE Organic Carbon concentration at these three Colorado sites.
3.3. Organic aerosol loading/AOD and fire area burned
Annual summertime organic aerosol loading and total annual fire area burned within these western mountain ranges as reported by Monitoring Trends in the Burn Severity project, also showed a significant, strong, positive correlation at sixteen IMPROVE high elevation Intermountain West sites (see table 2).
Table 2. Correlation between total annual fire area burned and summertime average AOD (SPL: 1999–2013 and SEV: 1995–2013) in first two columns; column 3–18 show correlation between total annual fire area burned and summertime average organic aerosol loading at IMPROVE sites (1989–2013). First, correlations are shown as Pearson product moment correlation coefficient (R) in black ink. Next, the number in parentheses represents probability value (p) using 2-tailed student T-test. Correlations listed are greater than 95% confidence. NC = No Correlation, red = 99.9% confidence or greater (<0.001), green = 99.0% confidence or greater (<0.01), purple = 95% confidence or greater (<0.05).
|
As an example, figure 2 demonstrates the relationship between total fire area burned in the Southern Rockies and average summertime organic aerosol loading at four high elevation IMPROVE sites in Colorado. R values of ranged from 0.63 at Mount Zirkel Wilderness Area (MOZI) to 0.70 at WEMI, respectively (p < 0.01), (see table 2).
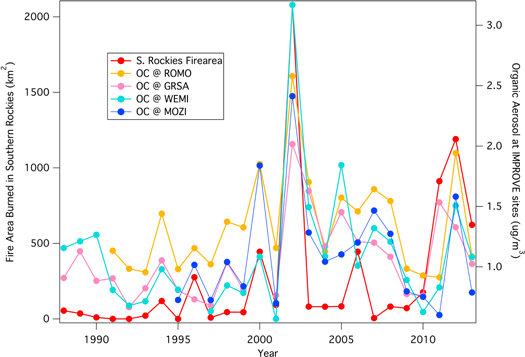
Figure 2. Total fire area burned (km2) within the S. Rockies ecoregion (left axis) and summertime organic aerosol concentration (OC) loading (right axis) at the Rocky Mountain National Park (ROMO), Great Sand Dunes National Monument (GRSA), Weminuche Wilderness Area (WEMI) and Mount Zirkel Wilderness Area (MOZI) IMPROVE sites (all sites are within Colorado).
Download figure:
Standard image High-resolution imageSources of anthropogenic organic aerosols include aerosol mass from fossil fuel combustion, biomass burning, along with other human activities that lead to the emission of volatile organic carbon. Additionally, feedbacks between anthropogenic activity (e.g. emission of Sulfur Dioxide) can enhance the formation of biogenic secondary aerosols (Hoyle et al 2011). Such sources of organic aerosols, such as rangeland fires, are most likely impacting the OC measurements demonstrated here. That said, significant correlations were observed between fire area burned (in forested regions) and the OC measured at many site within the Intermountain West; thus implying that wildfires are a dominant source of summertime OC in this region.
The correlation between aridity and summertime annual AOD and organic aerosol loading at sites across the Intermountain West are shown in figure 3(a) (white boxes, p < 0.05). Figure 3(b) demonstrates the correlation between total annual fire area burned within each of the mountain ranges and summertime annual AOD or organic aerosol loading at each site. Figure 3 clearly denotes the spatial expanse of the impacted area, and the strong regional impact of wildfires on summer organic aerosol loading at high elevation sites on decadal scales. Summertime aerosol loading linked to aridity and fires is found primarily in the Southern Rockies (white boxes in red region, figures 3(a) and (b)). At each of these sites, we found a significant correlation between summertime aerosol loading and aridity/fire area burned. This area of impact is well defined. Sites in the southern expanse of the Arizona and New Mexico Mountains, the Wasatch and Uinta Mountains, and the northern expanse of the Middle Rockies did not show a correlation between aerosol loading and either aridity or fire area burned (dark gray boxes, figures 3(a) and (b)). Wind roses for the 700 hPa level (not shown), calculated from NCEP reanalysis data, indicate that the predominant flow over the southern Rockies is from the southwest. Although the reanalysis data are too coarse to explain specific site-to-site differences, some general characteristics are apparent. Most of the correlated sites are in the east of this region and the correlations are with the local mountain ranges or ranges to the west and south of the sites, that is, upwind of the prevailing mid-tropospheric flow.

Figure 3. The correlation between summertime annual organic aerosol loading (OC) or AOD across the Intermountain West and (a) annual summertime aridity (b) total fire area burned across the Intermountain West. White boxes denote sites where a significant correlation [p < 0.05] was observed. The color indicates the specific mountain range. Dark gray boxes represent sites where no correlation was observed.
Download figure:
Standard image High-resolution image3.4. Future aerosol loading
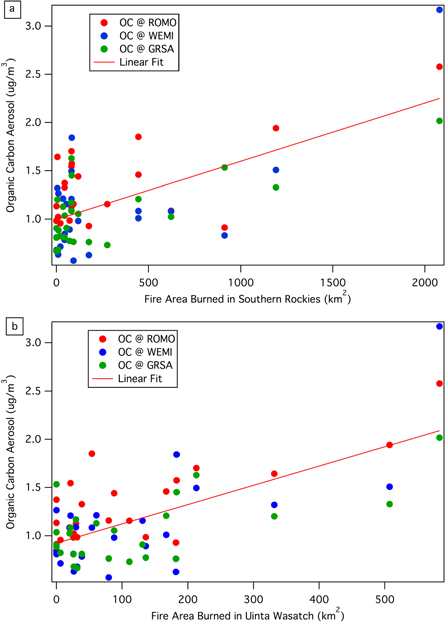
These results provide quantitative constraints, suitable for evaluating climate model performance, on the influence of aridity and resulting wildfires on aerosol loading. Prior work estimated future wildfire activity and resulting surface level organic aerosol loading across the western US during the mid-21st century based on results from 15 global climate models (GCMs) (Yue et al 2013). In these simulations, the 'Rocky Mountain Forest' ecoregion corresponds to the combined area of the Middle Rockies, Southern Rockies, and Wasatch and Uinta Mountain shown in figure 3—representing mainly mixed and/or coniferous forest (Yue et al 2013). The GCMs predicted a burned area increase of 2.69 times by the mid-21st century (Yue et al 2013). The GEOS-CHEM Chemical Transport Model applied this increased fire area to simulate an increase in the mean summertime concentration of OC aerosol of 46% (Yue et al 2013). These simulations were compared to empirical data using a linear regression model of total fire area burned and OC loading given the similarity in fuel type within this region (figures 4(a) and (b) for the Southern Rockies and Uinta Mountains, respectively). The y-intercept from the regression (∼0.9 μg m−3) represents the background of OC loading outside active wildfires and is in agreement with prior studies (e.g. Hallar et al 2013, Yue et al 2013). Using the average area burned between 1988 and 2013, the prior predicted increase in fire area (factor of 2.69), and the linear relationships shown in figure 4, we estimated an increase in OC of 24% ± 3% and 34% ± 3% for the Southern Rockies and Wasatch/Uinta Mountains, respectively, where the uncertainty is the uncertainty of the regression at the mean value of OC. These estimates are nominally lower than current predictions by climate models (Spracklen et al 2009, Yue et al 2013).
Figure 4. (A) Total fire area burned within S. Rockies Level 3 ecoregion verses summertime organic aerosol loading at the Rocky Mountain National Park (ROMO), Great Sand Dunes National Monument (GRSA), and the Weminuche Wilderness Area (WEMI) IMPROVE sites. Organic aerosols for all three sites show a correlation with the S. Rockies fire area with an R value of 0.65. For the linear fit shown in the case of the S. Rockies, the regression coefficient values ± one standard error are slope = 0.000 603 ± 8.3 × 10⁻⁵ and intercept = 0.996 ± 0.04. (B) Total fire area burned within Uinta Wasatch Level 3 ecoregion verses summertime organic aerosol loading at ROMO, GRSA, and WEMI. Organic aerosols for all three sites show a correlation with the Uinta/Wasatch fire area with a R value of 0.69. For the Uinta/Wasatch, the regression coefficient values (± one standard error) are slope = 0.001 999 ± 0.000 25 and intercept = 0.923 ± 0.049.
Download figure:
Standard image High-resolution image
Using the same methodology, the expected mid-21st century change in AOD was calculated with the predicted increase in fire area using the relationships demonstrated in table 2. Considering the summertime AOD from SPL and SEV, we predict a 22% ± 6% and 36% ± 6% increase in AOD with the 2.69 increase in predicted fire area for the S Rockies and Wasatch/Uinta Mountains, respectively. To our knowledge this is the first estimate of predicted AOD increase due to wildfires at high elevation sites in the western US.
4. Conclusions
The Intermountain West will continue to face significant challenges maintaining mandated visibility requirements faced with a drier climate, as there is a broad consensus among climate modeling results that the Intermountain West will become more arid in the 21st century (e.g. Watson 2002, Seager et al 2007, 2013). The results reported here indicate that these changes in climate will have profound impacts on aerosol loading in these pristine places, albeit slightly reduced from prior model estimates. This relative reduction in aerosol loading will diminish the regional cooling effects of aerosols and will lead to a warmer climate than previously predicted.
Acknowledgments and data
We appreciate the capabilities of the USDA UV-B Monitoring and Research Program for data storage and advice. The Steamboat Ski Resort provided logistical support and in-kind donations for Storm Peak Laboratory. The Desert Research Institute is a permittee of the Medicine-Bow Routt National Forests and an equal opportunity service provider and employer. The authors appreciate the effort of Douglas Moore at the Sevilleta Long Term Ecological Research for maintaining the Aeronet site. The research at Sevilleta Long Term Ecological Research is funded by the National Science Foundation (Grant DEB 0832652) and administered by the US Fish and Wildlife Service within the National Wildlife Refuge. IMPROVE is a collaborative association of state, tribal, and federal agencies, and international partners and is funded by the US Environmental Protection Agency, with contracting and research support from the National Park Service. The Air Quality Group at the University of California, Davis, is the central analytical laboratory, with ion analysis provided by the Research Triangle Institute and carbon analysis provided by the Desert Research Institute. The US Department of Agriculture Forest Service (USDA-FS) and the US Geological Survey (USGS) supports the MTBS program. A G H was supported by a sabbatical from DRI to conduct this analysis. N M was supported by USDA grant 2012-67003-19802. KK was supported by NOAA through the Cooperative Institute for Climate and Satellites-North Carolina under Cooperative Agreement NA14NES432003.'