
Abstract
Vast areas of deforested tropical peatlands do not receive noteworthy shading by vegetation, which increases the amount of solar radiation reaching the peat surface. Peat temperature dynamics and heterotrophic carbon dioxide (CO2), nitrous oxide (N2O) and methane (CH4) fluxes were monitored under four shading conditions, i.e. unshaded, 28%, 51% and 90% shading at experiment sites established on reclaimed fallow agricultural- and degraded sites in Central Kalimantan, Indonesia. Groundwater tables on the sites were at about 50 cm depth, the sites were maintained vegetation free and root ingrowth to gas flux monitoring locations was prevented. Half of the four shading areas received NPK-fertilization 50 kg ha−1 for each of N, P and K during the experiment and the other half was unfertilized. Increases in shading created a lasting decrease in peat temperatures, and decreased diurnal temperature fluctuations, in comparison to less shaded plots. The largest peat temperature difference in the topmost 50 cm peat profile was between the unshaded and 90% shaded surface, where the average temperatures at 5 cm depth differed up to 3.7 °C, and diurnal temperatures at 5 cm depth varied up to 4.2 °C in the unshaded and 0.4 °C in the 90% shaded conditions. Highest impacts on the heterotrophic CO2 fluxes caused by the treatments were on agricultural land, where 90% shading from the full exposure resulted in a 33% lower CO2 emission average on the unfertilized plots and a 66% lower emission average on the fertilized plots. Correlation between peat temperature and CO2 flux suggested an approximately 8% (unfertilized) and 25% (fertilized) emissions change for each 1 °C temperature change at 5 cm depth on the agricultural land. CO2 flux responses to the treatments remained low on degraded peatland. Fertilized conditions negatively correlated with N2O efflux with increases in temperature, suggesting a 12–36% lower efflux for each 1 °C increase in peat temperature (at 5 cm depth) at the sites. Despite the apparently similar landscapes of fallow agricultural land and degraded peatland sites, the differences in greenhouse gas dynamics are expected to be an outcome of the long-term management differences.
Export citation and abstract BibTeX RIS

Content from this work may be used under the terms of the Creative Commons Attribution 3.0 licence. Any further distribution of this work must maintain attribution to the author(s) and the title of the work, journal citation and DOI.
Introduction
Lowland peatlands in Southeast Asia cover 24.8 million hectares (Mha), which is 56% of the tropical and 6% of the total global peatland area (Page et al 2011). Both the vegetation and especially the underlying deep peat constitute a highly concentrated labile carbon pool of global significance by enclosing a regional peat carbon store of 68.5 Gt, which is equivalent to 77% of the tropical and 11–14% of the global peat carbon store.
Carbon stores in the tropical peat ecosystem have been formed over several millennia by forest vegetation with a high carbon sequestration capacity and flood tolerance, and largely poor substrate quality. Human-induced peat ecosystem degradation impairs the carbon storing functions of tropical peatlands, where deforestation, deep drainage and the burning of areas converted to agriculture and plantations results in large greenhouse gas (GHG) emissions (Koh et al 2011, IPCC 2014). Since 1990, one third of the total 15.5 Mha of peatland in Peninsular Malaysia and the islands of Borneo and Sumatra have been deforested and drained, while most of the remaining peat forest area has been logged intensively (Langner and Siegert 2009, Miettinen and Liew 2010). Large reclaimed peat areas have degraded due to uncontrolled drainage and reoccurring wild fires caused by lack of management after forest cover removal. Tropical peat emissions are ∼2 Gt of carbon dioxide equivalent (CO2e) annually due to land use changes, which equal over 7% of the global emissions from fossil fuel burning (Hooijer et al 2010). A strong interest hence exists in understanding the drivers and mechanisms resulting in the detected GHG losses from reclaimed tropical peatlands.
The GHG dynamics of tropical peat ecosystems involve carbon dioxide (CO2) uptake via photosynthesis and losses through the autotrophic respiration of vegetation, heterotrophic respiration and fluvial transports of dissolved and particulate organic matter (e.g. Hirano et al 2009, Jauhiainen et al 2012a, 2012b, Moore et al 2013). Heterotrophic respiration is the microbial decomposition of organic matter and produces CO2, nitrous oxide (N2O) and methane (CH4). The position of the groundwater table (WT) sets the border between potentially aerobic peat above and the lower water-saturated anaerobic peat. Changes in water availability, i.e. WT and substrate water content can change microbial community structures sensitive to water and oxygen availability (Jaatinen et al 2008, Manzoni et al 2013). The organic polymers close to the surface of peat are decomposed largely aerobically by bacteria and fungi, and as the enduring peat substrates become water-saturated, a succession of bacteria anaerobically breakdown emerging degradation products, finally resulting in CH4 production by methanogens. Methanotrophic bacteria concurrently consume upwards-diffusing CH4 in the aerobic peat layer (Vasander and Kettunen 2006). Denitrifiers produce N2O in anaerobic conditions when in the presence of nitrate. Post-conversion land uses provide a deeper annual groundwater table and lower organic substrate resources (e.g. litter) for decomposer communities existing in undrained forests, and the resultant gaseous GHG fluxes reflect these differences in environmental conditions and resources (Jauhiainen et al 2005, 2008, 2012a, 2012b, Hirano et al 2009). Peat WT position is typically the only factor used to explain GHG flux dynamics in tropical peat regardless of the vegetation cover of a particular land use type (IPCC 2014).
Other physical GHG flux influencing factors, such as peat temperature (influenced by vegetation cover) and changes in soluble nutrient amounts in peat (e.g. directly influenced by fertilization or indirectly by organic matter decomposition activity) have received less profound attention in tropical peatland studies. Some studies have applied fertilization as a part of an experimental design for monitoring GHG emissions close to cultivated plants in tropical peat (e.g. Hadi et al 2000, Takakai et al 2006), but limited information is still only available on the increased nutrient availability effects on organic matter decomposition. In Northern peatlands, organic matter resource availability has been shown to influence the temperature sensitivity of microbiological processes in a complex way (Andersen et al 2013, Hilasvuori et al 2013, Weedon et al 2014). Decomposing substrate quality appears to have major influences on temperature sensitivity for decomposers, where poorer recalcitrant substrates have higher sensitivity than substrates formed from less-complex carbon compounds (Fierer et al 2005, Davidson and Janssens 2006). Wang et al (2014), found an average increase of 21% in heterotrophic respiration by a 2 °C increase in soil temperature in a meta-analysis, which included data from 50 long-lasting ecosystem warming experiments across several terrestrial ecosystems outside the tropics.
Annual soil temperature differences between dry and wet seasons in the lowlands of the humid tropics remain smaller compared to higher latitude areas subject to wider seasonal temperature differences between summer and winter. However, because of more intense solar radiation in the equatorial region, notable long-term differences in tropical peat surface temperature conditions can form between areas due to differing shading intensities provided by vegetation, and a short-term diurnal temperature fluctuation in the peat surface may exist between day and night. Deforestation increases the rate of solar radiation reaching the soil surface and topsoil temperatures increase from values found under forest cover (Brady 1997, Takakai et al 2006, Jauhiainen et al 2008, Husnain et al 2014). Reported average diurnal topsoil temperatures (between March and July 2002) in several areas of differing land uses in Central Kalimantan show notable increases under reduced vegetation cover, e.g. 22.9 °C for intact peatland forest, 26.7 °C for heavily degraded forest, and 30.2 °C for open agricultural areas (Jaya 2007). Rotation-based production on reclaimed peatlands includes repeated temperature changes as the soil surface can be exposed for prolonged periods after harvesting operations remove the cropped biomass. For example, Jauhiainen et al (2012a) report a plantation surface peat (at 5 cm depth) diurnal average temperature of 26.5 °C for a harvest-ready closed canopy Acacia crassicarpa stand and 27.3 °C for a recently clear-felled and replanted plantation in Riau (Sumatra). Daytime peat temperatures are higher due to direct solar heating, and microsite variations in daytime temperatures can become large as surface shading (or exposure) depends on vegetation cover formed from plant architecture, planting density and arrangement. Peat temperature variability is attributed to the high heat capacity and low thermal conductivity of the peat (Soepraptohardjo and Driessen 1975), which can lead to lasting spatial peat temperature differences if certain shading conditions dominate.
The relation between heterotrophic respiration rate and temperature is often studied by applying the Q10-ratio, i.e. the proportional increase in soil respiration when temperature increases by 10 °C. According to Hirano et al (2009), peat total CO2 respiration Q10-ratios varied between 2.4 and 3.0 within the soil temperature range of 24–29.5 °C in a peat swamp forest in Central Kalimantan. During a laboratory experiment Brady (1997) found that the heterotrophic CO2 respiration in surface peat samples incubated at 35 °C (simulating peat temperatures under open canopy) resulted in an average of 127% higher heterotrophic respiration than with samples incubated at 25 °C (simulating peat temperatures under forest cover), resulting in a Q10-ratio of 2.3. The first study, comparing day-time monitored heterotrophic CO2 emissions and diurnal peat temperatures in tropical peat, was performed on A. crassicarpa plantations where annual peat heterotrophic CO2 emissions were found to be subject to a 14.5% reduction, e.g. ∼14 tonnes CO2 ha−1 yr−1, by taking into account day- and night-time temperature difference of 1.45 °C in surface peat and by applying the Q10-value for comparable environmental conditions (Jauhiainen et al 2012a). Unless corrected, most of the reported annual flux estimates based on daytime monitored GHG fluxes could be subject to biases due to diurnal temperature differences. These observations from the literature suggest that both long- and short-term temperature dynamics in peat can notably influence organic matter decomposition rates in normal peat temperature ranges found in the tropics.
The motivation for our study was to increase cognizance on the influence of temperature on organic matter decomposition processes and to provide background for improvements in field GHG data collection and data processing. Most of the in situ collected data currently combines information from multiple monitoring environments or provides information on total GHG fluxes only, and thus many of the temperature-related effects influencing GHG emissions may be over-shaded by or mixed with other decomposition-contributing factors, e.g. peat quality, peat water table position, vegetation autotrophic respiration etc. Our study setup in this experimental study was arranged to investigate CO2, N2O and CH4 fluxes in tropical peat in conditions where; (i) root respiration is maintained as practically non-existent, (ii) peat temperatures are changed by artificial shading (representing several realistic shading conditions provided by vegetation) and (iii) nutrient availability for peat decomposer communities is altered (by NPK fertilization treatment) as may also occur with crop production land uses. Furthermore, (iv) the experiment was repeated at two land use types, both characterized by recalcitrant peat created by clear-felling and drainage over a decade ago, recurrent fire impacts on surface peat and low organic matter inputs from vegetation.
The pre-set three hypotheses were; (i) heterotrophic GHG flux levels and dynamics in peat under conditions that limit the decomposition of organic matter are similar in comparable conditions regardless of land use type, (ii) increase in peat temperature enhances the organic matter decomposition process in drained conditions, which is seen as an increase in CO2 and N2O emissions but not in CH4 emissions, (iii) increase in nutrient availability (e.g. in form of fertilizer) enhances decomposition in peat, which is seen as an increase in CO2 and N2O emissions in addition to an increase created by temperature impact.
Materials and methods
Sites
Our study was carried out at the upper catchment of the Sabangau river, ca. 20 km Southeast from Palangka Raya city in Central Kalimantan, Indonesia. The reported annual mean air temperature and precipitation for the period 2002–2010 in the area are 26.2 ± 0.3 °C and 2540 ± 596 mm yr−1, respectively (Hirano et al 2014). The wettest months are December–February and evaporation exceeds average monthly rainfall during the driest months (August and September). Average evaporation is constant (3.5–4.8 mm d−1) with an annual total of approximately 1500 mm. Sites on clear-felled drained peat dome included fallow agricultural land (AL) and degraded land (DL). The sites were ca. 1 km apart from each other on the same peat dome approximately 4 m deep.
The DL site (S2°19'24'', E114°1'14'') was clear-felled and uncontrollably drained by a large-sized drainage canal system in the mid-1990s as part of a massive land conversion venture called the Mega Rice Project. The site has been fire-affected during 1997/98, 2002 and 2009 (Hoscilo et al 2011, Hamada et al 2013), and the estimated loss of the uppermost peat profile is approximately 0.7 m (Hirano et al 2014). Ferns are the main vegetation in the area (e.g. Stenochlaena palustris and species of Lygodium, Polypodium and Pteris), growing on elevated surfaces next to shallow depressions created previously by smouldering ground fires. Trees in the area include some scattered bush-like individuals dominated by Combretocarpus rotundatus and Cratoxylon glaucum species. Groundwater tables vary annually from flooding and close to surface WT positions during wet season to gradual drop of WT positions close to 1 m depth (up to ∼1.5 m depth in some years) towards the end of dry season (Jauhiainen et al 2008). The area including the AL site was drained in the 1980s for smallholder farming. Peat in the area is usually drained to a depth of 30–50 cm from the peat surface (Hirano et al 2009). Typical AL management in the area includes the formation of raised beds for growing vegetables, such as long bean, spinach, cassava and corn. Typical fertilization applications include both mineral fertilizers and a mixture of plant residues, dung and peat slowly burned onsite. The AL site was practically void of vegetation (fallow land) up to one year prior to our experiment.
Experiment site setup
The experiment began in mid-March 2012 by selecting two relatively flat vegetation free (open) spaces for the study. On both locations, an East–West oriented experiment site (10 m × 3 m) was encircled along the long edges by 1.3 m high wooden poles at 2.5 m intervals. A wooden frame connected the adjacent poles from the top along the edges and through the experiment site. Layers of black shading net were tightened on the frame so that a gradient of four shading levels were formed over the adjacent 3 m × 2.5 m areas. The net extended partly downwards at the bordering shading treatments so that different shading options would apply for most of the daytime. Shading differences between the adjacent areas were determined using a PAR-1 probe, detecting photosynthetically active radiation (PAR), attached to an EGM-4 analyser. Half of the experiment site, running along the shading gradient, was reserved for the fertilization trial by one fertilization level while the other half remained unfertilized. The experiment site thus included eight East–West oriented 2.5 m × 1.5 m (length × width) experiment plots combining specific shading and fertilization. The mid-section of each experiment plot was trenched down to a depth of 50 cm using a saw, thus preventing root ingrowth to the site from further distances and enclosing a 2 m × 1 m area reserved for heterotrophic respiration GHG flux monitoring. Five GHG flux-monitoring locations, each 30 cm in diameter, were evenly spaced inside the trenched area in a linear arrangement. Bare soil surfaces within the experiment sites and some decimetres outside the sites were maintained free of possible sprouting plant shoots by frequent cutting and the trenching operations were repeated after each gas flux-monitoring event and during other occasional visits.
YaraMila™ (Yara, Norway) 16-16-16 NPK-fertilizer containing an equal mass (16% w/w) of each element was used. The nitrogen component consists of 60% NH4–N and 40% NO3–N. A pre-prepared amount of the fertilizer was mixed with seven litres of water and sprayed evenly on the fertilizer trial plots at four evenly spaced times between March and June 2012, while the first two applications were performed before the start of the GHG flux monitoring in May. The total fertilizer amount sprayed on the experiment plots during the experiment equals 313 kg ha−1, i.e. 16% of 313 kg makes 50 kg ha−1 of N, P, and K.
Field data collection
We used an Ushkikata S-27 level (Ushikata, Japan) for recording soil surface microtopography at the data collection locations. Perforated plastic pipes were installed next to the experiment sites for manual WT monitoring during GHG flux monitoring events. A Mini-Diver DI501 (Schlumberger Water Services) logger recorded the WT position at one-hour intervals at both sites.
For manual temperature monitoring during gas flux monitoring we used Therma Plus K-type (ThermoWorks, USA) and TTX-120 (Ebro, Germany) digital thermometer units attached to thermocouple probes. Manual peat temperature monitoring depths were 5 cm, 10 cm, 20 cm and 30 cm from the surface and the monitoring was performed next to the first, third and fifth gas flux monitoring locations at each plot. Thermochron DS1921H (Maxim, USA) iButton loggers recorded peat temperatures at 1 h intervals at depths of 5 cm, 10 cm, 20 cm, 30 cm and 50 cm in the mid-section of each shading level. Temperature logging began in March, but data from May 2012 onwards only, i.e. data collected in settled conditions during gas flux monitoring, were included in the analysis. Photosynthetic photon flux density (PPFD) data were collected from the understory of various vegetation types at noon with the PAR-1 probe (n = 10–50) additionally to PPFD measurements performed for determining the relative shading differences at the experiment sites.
GHG flux data collection included two closed chamber methods, one providing CO2 flux data based on infrared gas analysis and one providing N2O and CH4 flux data based on gas sampling in the field followed by gas chromatography analysis in the laboratory. We used an EGM-4 infrared gas analyser connected to a SRC-1 soil respiration chamber (PP Systems, United Kingdom) for CO2 flux data collection. A larger 30 cm diameter cover replaced the standard SRC-1 chamber cover. The EGM-4 recorded the CO2 concentration automatically at 5 s intervals during sample collection in the chamber inserted tightly against the bare peat surface for a 60 s deployment time. CO2 flux was calculated from a linear change in gas concentration inside the closed chamber as a function of deployment time. Nonlinear concentration changes during deployment, e.g. due to leakage or soil disturbance, would lead to rejection of the readout. All five GHG flux monitoring locations at each shading and fertilization combination were included in data collection, and 879 CO2 readouts formed the database for the analysis.
We used cylindrical closed chambers with dimensions of (D × H) 32 cm × 30 cm during air sample collection for N2O and CH4 concentration determination. Each steel-constructed chamber was open at the bottom and had a ca. 3 cm diameter hole at the top. The lower chamber edging was placed in the peat at a depth of 2 cm during sampling, and a rubber stopper, which included fitted temperature and air-sampling probes, sealed the hole at the top. We took four air samples into syringes at even intervals over a 30 min deployment time for each gas flux determination. Each air sample of 22 ml was injected into evacuated 20 ml glass vials. Each flux-monitoring event included samples from chambers located at the first, third and fifth monitoring locations.
Gas flux monitoring was performed between 9:00 and 16:00 h by randomising the order of the monitoring events at experiment plots for each day, and 75% of the gas flux data was collected between 11:00 and 15:00 h. The gas flux monitoring period was from 12 May to 31 August 2012, and included 22 monitoring days in the field.
We collected samples before the first fertilization event in June 2012 from each of the eight experiment plots at both sites, to be used for peat bulk density (BD), pH, carbon (C), nitrogen (N), phosphorus (P) and potassium (K) analyses. We took peat samples at each shading treatment during each gas flux-monitoring event for determining peat gravimetric water content. We took peat samples next to experimental sites once a month for determining peat water filled pore space (WFPS). We used a volume-exact Russian peat corer (Jowsey 1966) for the peat sampling and extracted 50 cm long cores from the peat surface downwards. Sub-samples from depths of 0–10 cm, 20–30 cm and 40–50 cm were stored in plastic bags.
Laboratory analyses
For N2O and CH4 analyses we used an Agilent 7890 A gas chromatograph (Agilent, Santa Clara, CA, US) equipped with an autosampler with a peristaltic pump (Gilson Minipuls 3, Middleton, WI, USA) for sample transfer, a Poraplot Q column for gas separation, a flame ionization detector for CH4 detection and an electron capture detector for determining N2O levels. Each N2O and CH4 flux reading was analysed for linearity based on consecutive air samples concentrations taken during the deployment time. The temporal gas concentration increases during each chamber deployment were also compared with the deviation in standard gas concentrations. A sample was rejected when one or more of the following occurred: if the GHG flux change over the deployment time was not linear, if less than three samples remained for forming the flux readout and if the change in sampled gas concentration within the deployment time was smaller than the deviation in the standard gas samples. From the total of 168 samples taken, 145 N2O and 85 CH4 flux readouts formed the final analysed database and the number of rejected readouts was 83 for CH4 and 23 for N2O, respectively.
The peat samples were first weighed for determination of fresh mass for peat BD and water content determination, dried at 105 °C until no further mass loss was observed (>20 h), and then dry mass was determined. Gravimetric water content was the percent ratio between the mass of water and fresh mass of the peat sample, and BD was the sample dry mass per unit volume of extracted peat sample. WFPS was calculated from the ratio between volumetric water content and the total pore space. Peat BD was determined as the ratio between sample dry mass and the original sample volume. Peat pH was determined using a Winlab Data Line pH-meter (Windaus Labortechnik, Germany) from a 1 : 2 mixture of peat and distilled water. Peat was first dried at <70 °C temperatures to a constant weight and then milled for carbon and nutrient determinations. Carbon and nitrogen content and CN ratio was determined using a Vario MAX CN analyser (Elementar, Germany).
Statistical analyses
Flux data for each GHG was examined both by relating gas fluxes to concurrent conditions at monitoring locations during sampling and alternatively by inspecting the complete monitoring period covering long-term GHG flux averages and environmental variable averages at the plots or monitoring locations. We used the IBM SPSS 20 programme for statistical analyses. Data were checked using the Shapiro–Wilk normality test for data distribution normality and equality of variances was tested with the Levene test. In case of non-normal distribution, logarithmic transformation was first tested for achieving normal distribution in the data, or non-parametric tests were applied. The student's t-test (two values) was used for comparisons between averages in normally distributed data and one-way Anova with Tukey's HSD or Dunnett's T3 tests were applied for several values in the comparison. The Mann–Whitney U-test and Kruskal–Wallis Anova were applied in non-normally distributed data comparisons. All statistical analyses were run at the 95% confidence level. Unit averages and standard deviations are provided in the results unless otherwise mentioned. Fluxes noted by negative sign in this presentation are from the atmosphere into the peat, and positive flux numbers are efflux from peat to the atmosphere.
Results
Peat characteristics
The upmost 50 cm peat layer mean BD for the AL site was 0.21 ± 0.04 g cm−3 (average ± STD) and the values within the range of 0.23–0.19 were markedly lower at deeper sampling depths (Kruskal–Wallis H = 40.401; p < 0.001; n = 80). Peat BD averaged 0.22 ± 0.03 g cm−3 at the DL site, and markedly lower values within the range 0.24–0.20 were also found there deeper in the peat (Kruskal–Wallis H = 69.863; p < 0.001; n = 80). Peat pH values were close to 3.4 for both sites. Unfertilized peat average C (55.86 ± 0.58%) and N (0.75 ± 0.04%) concentrations in the upmost 50 cm layer of the AL site were slightly lower than the average C (56.93 ± 1.00%) and N (1.00 ± 0.26%) concentrations for the DL site. CN ratios at three sampling depths within 50 cm deep peat layer were higher for the AL site (mean 74, range 71–79) than the average CN ratios of 60 and the 48–66 range for the DL site. The lowest CN ratio in the peat samples was measured closest to the surface. Average peat P (0.005 ± 0.002%) and K (0.01 ± 0.004%) concentrations for the AL site were lower than the respective P (0.007 ± 0.004%) and K (0.02 ± 0.009%) concentrations in the DL site in unfertilized conditions.
Added NPK-fertilization resulted in only minor differences in peat N, P and K concentrations, but no statistical differences were recorded between the fertilized and unfertilized sections at either site. The 50 cm peat layer average N and P concentrations of the AL site (0.80 ± 0.07% for N and 0.005 ± 0.002% for P) were slightly higher at the fertilized than the unfertilized area, but K concentration (average 0.01 ± 0.005%) was similar at both. Adding fertilization at the DL site resulted in slightly lower N and P concentrations in peat (averages for 50 cm peat layer 0.95 ± 0.17% for N and 0.006 ± 0.003% for P) but no change in the K concentration (average 0.02 ± 0.008%) was recorded in comparison to the unfertilized section of the experiment site. The highest N and P concentrations were measured in the samples closest to the surface both in the unfertilized and fertilized plots.
Hydrology
Groundwater table depths during the experiment were in average only some 10 cm deeper from the peat surface of the AL site (average 50 cm, median 52 cm, mode 59 cm) in comparison to the water table depth at the DL site (average 52 cm, median 51 cm, mode 49 cm), (figure 1). Typical WT positions, i.e. the range between the 25th and 75th percentiles, were from 59 cm to 40 cm and from 59 cm to 47 cm on the AL and DL sites, respectively. WT sunk slowly for most of the time, but occasional rainy periods restored the WT position closer to the surface. We did not monitor gas fluxes unless several hours had passed after rain events and thus WT was always below the peat surface during gas flux monitoring. The total precipitation during the experiment was 574 mm, the rainiest and driest months being July (264 mm) and May (85 mm).
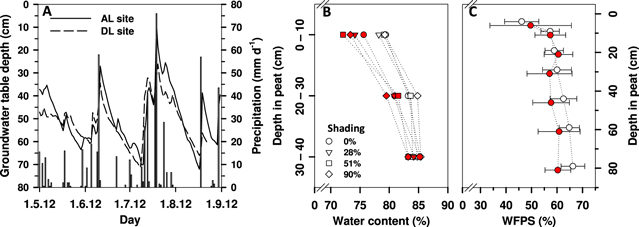
Figure 1. Daily precipitation and average daily groundwater table depth in peat based on automated data logging (A), and during GHG flux monitoring collected samples based average peat gravimetric water content (n = 22) at four shading levels and three depths (B), and water-filled pore space ± STD (n = 6) at seven peat depths (C) at the AL (open symbols) and DL sites (filled symbols) during the GHG monitoring period.
Download figure:
Standard image High-resolution imagePeat gravimetric water content was lowest at the surface and increased downwards at both sites (figure 1). The peat water content increase by peat depth was significant for both the AL (Kruskal–Wallis H = 90.805; p < 0.001; n = 80) and the DL sites (Kruskal–Wallis H = 142.665; p < 0.001; n = 80). Peat average water content close to the peat surface was ∼79% on the AL site and ∼74% on the DL site, and between 80% and 85% at 20–40 cm depth in peat for both sites. No statistical differences between peat water content and shading levels at any of the three depths applied for water content determination were found on either site. Average peat WFPS values were between 46% and 66% for the AL site and between 50% and 60% for the DL site (figure 1). The lowest average WFPS values and the widest variation were recorded in the topmost peat.
Light
The photon flux in unshaded conditions was 1977 ± 73 μmol m−2 s−1, 1419 ± 49 μmol m−2 s−1 under the lightest first shaded level, 961 ± 57 μmol m−2 s−1 under the second shading level, and 202 ± 38 μmol m−2 s−1 under the third shading level, when sampled by 20 readouts of each shading condition during clear skies at noon. On average, the soil surfaces at the experiment sites were subject to added shading of 0% (no shade), 28%, 51% and 90% from full sun exposure. In the mornings and during late afternoons the proportional light conditions may have slightly differed towards the edges of the shaded areas. For data comparison purposes we performed the light flux measurements at full exposure and the understory of various vegetation types at noon resulted in the following average PPFD flux/shade levels (μmol m−2 s−1/shade-%): peat swamp forest floor 259/95, ca. 1 m tall S. palustris fern thicket 32/99, 0.6 m tall S. palustris fern thicket 818/63, under unidentified regrowth bushes 275/88, under corn (Zea mays) 496/37, under basil (Ocimum basilicum) 511/62 and under coriander (Coriandrum sativum) 150/89.
Peat temperature
The average peat temperatures in the upmost 50 cm peat layer were 25.3–28.2 °C for the AL site and 25.2–28.9 °C for the DL site during the experiment (table 1). Highest measured average temperatures occurred in the unshaded peat at both sites. Increased shading at the AL site resulted in ca. 1 °C lower temperature values close to the peat surface, but at deeper monitoring depths the temperature changes remained much lower along the increasing shading gradient. Average peat temperatures were quite similar over the five monitoring depths within each shading treatment of the AL site. DL site peat temperatures at the five monitoring depths differed more in less shaded conditions and had a narrower range at more shaded conditions than found in respective positions on the AL site. The largest difference in peat average temperatures between the unshaded treatment and 90% shading was in the topmost peat, being 2.9 °C and 3.7 °C for the AL and DL sites, and at 50 cm depth the temperature differences were 2.1 °C and 0.6 °C, respectively. The shading increase resulted in a tendency for temperature gradient formation in peat, and the highest average peat temperatures were recorded at the deepest monitoring depth of 50 cm.
Table 1. Average temperatures at five peat monitoring depths subject to four shading levels on agricultural land (AL) and degraded land (DL) 1 May to 31 August 2012.
| AL site peat temperature (°C) | DL site peat temperature (°C) | ||||||||
| Shading (%) | Depth (cm) | N | 24 h Mean ± STDa | Min | Max | N | 24 h Mean ± STDb | Min | Max |
| 0 | 5 | 3110 | 28.2 ± 1.9 | 23.8 | 33.4 | 3452 | 28.9 ± 2.4 | 23.8 | 36.0 |
| 10 | 3422 | 28.1 ± 1.0 | 25.3 | 30.8 | 3442 | 28.4 ± 1.3 | 25.1 | 31.5 | |
| 20 | 3556 | 28.1 ± 0.5 | 25.9 | 31.6 | 3581 | 28.1 ± 0.7 | 25.8 | 29.5 | |
| 30 | 3556 | 28.4 ± 0.4 | 27.3 | 32.0 | 3214 | 27.5 ± 0.6 | 25.6 | 28.5 | |
| 50 | 3135 | 28.2 ± 0.3 | 27.6 | 28.8 | 3000 | 26.9 ± 0.4 | 25.8 | 27.8 | |
| 28 | 5 | 3037 | 27.1 ± 1.9 | 23.0 | 35.9 | 3616 | 27.3 ± 1.5 | 23.8 | 32.8 |
| 10 | 2262 | 27.3 ± 1.2 | 23.3 | 31.6 | 3350 | 27.3 ± 0.9 | 24.5 | 30.0 | |
| 20 | 3556 | 27.1 ± 0.6 | 23.1 | 29.3 | 3592 | 27.5 ± 0.5 | 24.9 | 28.9 | |
| 30 | 2158 | 27.3 ± 0.6 | 23.1 | 28.8 | 3548 | 27.0 ± 0.4 | 25.3 | 27.8 | |
| 50 | 2228 | 27.7 ± 0.5 | 23.0 | 28.4 | 3556 | 27.1 ± 0.3 | 26.3 | 27.5 | |
| 51 | 5 | 3238 | 26.2 ± 1.2 | 23.1 | 30.9 | 3032 | 26.2 ± 1.6 | 22.0 | 30.6 |
| 10 | 3372 | 26.4 ± 0.8 | 23.3 | 29.4 | 3377 | 26.2 ± 0.9 | 23.8 | 28.9 | |
| 20 | 3116 | 26.8 ± 0.6 | 23.8 | 28.3 | 3390 | 26.5 ± 0.5 | 25.1 | 27.8 | |
| 30 | 2828 | 26.7 ± 0.5 | 23.3 | 27.8 | 3317 | 26.5 ± 0.4 | 25.8 | 27.4 | |
| 50 | 3347 | 26.8 ± 0.5 | 24.5 | 28.6 | 3442 | 26.6 ± 0.3 | 26.1 | 27.1 | |
| 90 | 5 | 2842 | 25.3 ± 1.0 | 22.6 | 27.9 | 3282 | 25.2 ± 1.0 | 22.4 | 28.3 |
| 10 | 3081 | 25.7 ± 0.7 | 23.2 | 28.4 | 3334 | 25.2 ± 0.6 | 23.5 | 27.3 | |
| 20 | 3556 | 25.4 ± 0.6 | 22.8 | 26.9 | 3414 | 25.7 ± 0.5 | 24.5 | 27.0 | |
| 30 | 2262 | 26.0 ± 0.5 | 23.6 | 27.0 | 3616 | 26.0 ± 0.5 | 25.1 | 27.5 | |
| 50 | 3216 | 26.1 ± 0.5 | 23.6 | 27.1 | 3367 | 26.3 ± 0.4 | 25.5 | 27.0 | |
aPeat temperatures at 5 cm depth during peak gas flux monitoring hours (11:00–15:00) were 1.5 °C higher than the 24 h average in unshaded peat, 1.9 °C at 28% shading, 0.9 °C at 51% shading, and 0.4 °C at 90% shading, respectively. At 10 cm depth and deeper in the peat profile, the peak gas flux monitoring period temperatures differed on average 0.1 ± 0.14 °C (range −0.3 to 0.3 °C) from the 24 h average. bPeat temperatures at 5 cm depth during peak gas flux monitoring hours (11:00–15:00) were higher than the 24 h average by 2.3 °C in unshaded peat, 1.2 °C at 28% shading, 1.5 °C at 51% shading, and 0.4 °C at 90% shading, respectively. At 10 cm and below in the peat profile, the peak gas flux monitoring period temperatures differed on average 0.1 ± 0.13 °C (range −0.4 to 0.0 °C) from the 24 h average.
The widest diurnal (within 24 h) peat temperature differences were found in the topmost peat at both sites (figure 2). The highest topmost monitoring point peat temperatures were recorded from 13:00 to 19:00 and the lowest from 04:00 to 10:00, and the average difference in the topmost monitoring point (−5 cm) in the unshaded peat was 4.2 °C for the AL site and 5.5 °C for the DL site. The diurnal temperature change deeper in the peat occurred with a delay and the diurnal temperature differences remained smaller, e.g. peat temperatures at 20 cm and 30 cm depths at the DL site were highest between 20:00 and 24:00 and lowest from 10:00 to 14:00. Unshaded peat diurnal temperature fluctuations were undetectable at 30–50 cm depths at the AL site and at 40–50 cm depths at the DL site. A shading increase did not only reduce the diurnal temperature differences in the peat, but also the peat depth where these short-term (diurnal) changes reached.
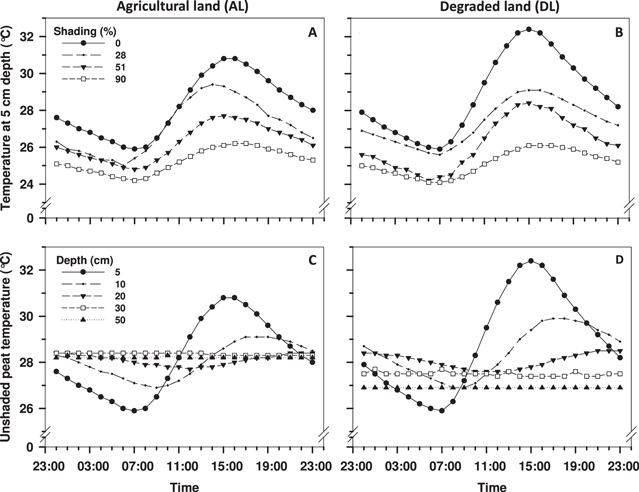
Figure 2. Average diurnal peat temperatures (A) and (B) at various shading levels at 5 cm depth, and at five peat depths under unshaded conditions (C) and (D) based on automated temperature monitoring during the GHG monitoring period 1 May to 31 August 2012. Each presented line presents data from one logger.
Download figure:
Standard image High-resolution imageThe highest peat temperature differences between GHG flux monitoring hours and diurnally were recorded at the 5 cm monitoring depth. Most of the flux data (50%) were collected between 11:00 and 15:00 h, and the average peat temperatures at 5 cm depth at the AL site during this period were 0.4–1.9 °C higher than the diurnal average (table 1). The temperature differences between the flux monitoring hours and the diurnal average was 0.1 ± 0.14 °C at the AL site. At the DL site, the difference in the average peat temperatures between main flux data collection hours and diurnally was 0.4–2.3 °C at 5 cm depth, and averaged 0.1 ± 0.13 °C at deeper monitoring depths.
GHGs
Differences in CO2, N2O and CH4 fluxes at the experiment sites linked to peat temperatures created by shading, the two fertilization levels and WT depths. No statistically significant correlations were observed between the fluxes and peat water content or other monitored peat characteristics.
The overall average heterotrophic CO2 fluxes at the AL and DL sites were 0.23 ± 0.19 g m−2 h−1 and 0.20 ± 0.08 g m−2 h−1, respectively (table 2). Fertilization application increased average CO2 fluxes markedly (by 0.08 g m−2 h−1) compared to the unfertilized plots at the AL site, whereas the fertilized half had a markedly lower CO2 flux (by 0.06 g m−2 h−1) in comparison to the unfertilized half of the DL site.
Table 2. Average heterotrophic CO2 fluxes and the first and third quartiles in peat at four shading levels and in two fertilization levels at AL and DL sites, where statistically significant differences in average fluxes across shading levels, within a fertilization and land use category (tested by Mann–Whitney U-test pairwise comparisons) are denoted by matching superscript letters.
| AL site CO2 flux (g m−2 h−1) | DL site CO2 flux (g m−2 h−1) | ||||||||
|---|---|---|---|---|---|---|---|---|---|
| Fertilization | Shading (%) | N | Mean ± STD | Q1 | Q3 | N | Mean ± STD | Q1 | Q3 |
| 0 | 0 | 55 | 0.24 ± 0.20a | 0.13 | 0.24 | 55 | 0.20 ± 0.05h,i | 0.17 | 0.22 |
| 28 | 55 | 0.19 ± 0.07b | 0.14 | 0.23 | 55 | 0.23 ± 0.09h,j | 0.19 | 0.27 | |
| 51 | 55 | 0.18 ± 0.08 | 0.14 | 0.21 | 55 | 0.21 ± 0.09k | 0.15 | 0.27 | |
| 90 | 55 | 0.16 ± 0.06a,b | 0.12 | 0.19 | 55 | 0.26 ± 0.10i,j,k | 0.19 | 0.33 | |
| 0–90 | 220 | 0.19 ± 0.12q | 0.13 | 0.22 | 220 | 0.23 ± 0.09r | 0.17 | 0.28 | |
| 1 | 0 | 54 | 0.38 ± 0.39c,d | 0.19 | 0.35 | 55 | 0.16 ± 0.06l,m,n | 0.12 | 0.20 |
| 28 | 55 | 0.33 ± 0.15e,f | 0.23 | 0.39 | 55 | 0.19 ± 0.06l,o | 0.16 | 0.21 | |
| 51 | 55 | 0.22 ± 0.08c,e,g | 0.16 | 0.25 | 55 | 0.13 ± 0.06m,o,p | 0.10 | 0.16 | |
| 90 | 55 | 0.13 ± 0.04d,f,g | 0.10 | 0.15 | 55 | 0.19 ± 0.07n,p | 0.14 | 0.23 | |
| 0–90 | 219 | 0.27 ± 0.23q | 0.15 | 0.29 | 220 | 0.17 ± 0.06r | 0.12 | 0.20 | |
| All | 439 | 0.23 ± 0.19 | 0.14 | 0.25 | 440 | 0.20 ± 0.08 | 0.14 | 0.24 | |
an = 55; U = 1151; Z = −2.168; p = 0.03. bn = 55; U = 1028; Z = −2.907; p = 0.004. cn = 54; U = 971; Z = −3.118; p = 0.002. dn = 54; U = 205; Z = −7.767; p < 0.001. en = 55; U = 639.5; Z = −4.9; p < 0.001. fn = 55; U = 91.5; Z = −8.503; p < 0.001. gn = 55; U = 346; Z = −6.986; p < 0.001. hn = 55; U = 1120; Z = −2.353; p = 0.019. in = 55; U = 891; Z = −3.72; p < 0.001. jn = 55; U = 1175; Z = −2.023; p = 0.043. kn = 55; U = 1080; Z = −2.587; p = 0.01. ln = 55; U = 1106; Z = −2.435; p = 0.015. mn = 55; U = 1046.5; Z = −2.792; p = 0.005. nn = 55; U = 1133; Z = −2.273; p = 0.023. on = 55; U = 663.5; Z = −5.085; p < 0.001. pn = 55; U = 729; Z = −4.691; p < 0.001. qn = 55; U = 17855.5; Z = −4.695; p < 0.001. rn = 55; U = 13704; Z = −7.878; p < 0.001.
The average CO2 fluxes of unfertilized peat at the AL site were markedly higher on unshaded and on 28% shaded plots when compared to the average of the 90% shaded plot (table 2, figure 3). However, the average CO2 fluxes on the fertilized area at the AL site differed markedly between most shading levels, except between the plots in the unshaded and 28% shaded conditions. Both the average CO2 flux and the variation around the mean were lower at increasingly shaded levels of the AL site. No regular trend was observed in the average CO2 fluxes of the DL site regarding the degree of shading at any fertilization level (figure 3, table 2).
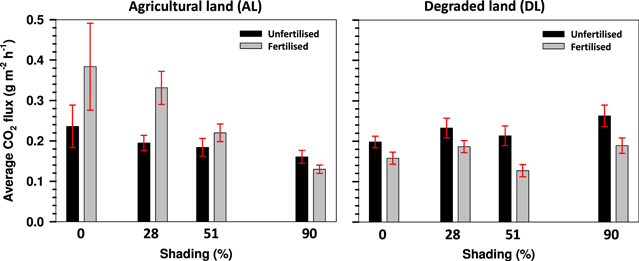
Figure 3. Average heterotrophic CO2 flux ± 95% CL at four shading levels and two fertilization levels on the AL and DL sites. Non-overlapping CL's represent statistically different average fluxes.
Download figure:
Standard image High-resolution imageRelationships between plot long-term average CO2 fluxes and peat temperatures (where averages for the entire monitoring period for each monitoring location were applied) at the AL site resulted in a positive correlation. These correlations between the long-term average CO2 fluxes and peat temperatures were somewhat lower (R2 = 0.216–0.241; F = 4.970–5.698; p = 0.039–0.028) on unfertilized plots compared to fertilized ones (R2 = 0.686–0.776; F = 41.226–62.396; p < 0.001) (figure 4). The highest correlation occurred between plot long-term average CO2 flux and temperature at 5 cm depth, but deeper peat temperatures also indicated similar trends (figure 4). A positive correlation (R2 = 0.805; F = 74.517; p < 0.001) was also observed between the long-term average CO2 fluxes and WT depths of the fertilized plots at the AL site (figure 4). The trend in the unfertilized experiment plots also suggests an increase in CO2 flux occurring with increasing WT depth, but the relation had no statistical significance within the relatively narrow range of groundwater tables in our study. Correlations between the long-term average CO2 fluxes and peat temperatures at the DL site remained insignificant both in the unfertilized and fertilized plots (figure 4). Correlation between long-term average CO2 fluxes and peat groundwater tables was also low at the DL site.
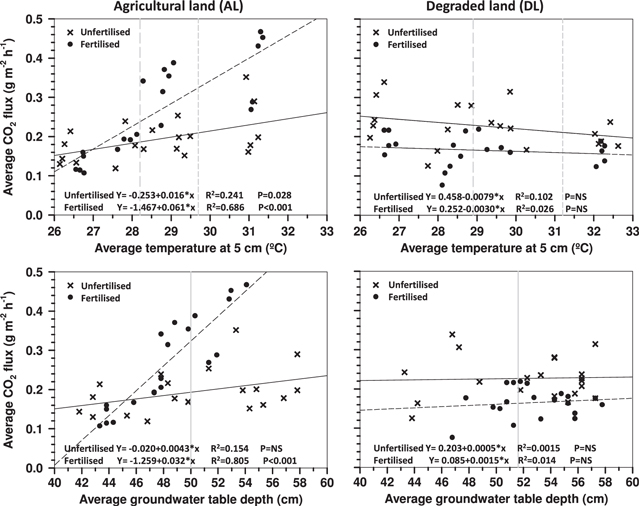
Figure 4. Correlation between plot long-term average CO2 flux and peat temperature at 5 cm depth and plot long-term average CO2 flux and groundwater table depth on the AL and DL sites. Each symbol represents an average of 11 flux and groundwater table readouts. Shaded lines represent averages for unshaded peat 24 h temperatures (dashed) and daytime temperatures (dotted) at 5 cm depth, and groundwater table (solid).
Download figure:
Standard image High-resolution imageMost N2O fluxes occurred from the soil to the atmosphere (table 2). The difference between average N2O fluxes at unfertilized and fertilized plots at the AL site was 363 μg m−2 h−1, which was a statistically marked difference. The average N2O flux difference at the DL site between fertilized and unfertilized treatments was only 12 μg m−2 h−1.
No clear trend was observed in average N2O fluxes between the four shading levels in the unfertilized section of the AL site. The average N2O fluxes of the fertilized section of the AL site increased with increasing shading between 0%, 28%, and 90% shading levels. At 51% shading, the average flux was above all other averages due to two exceptionally high flux values (2956 and 1381 μg N2O m−2 h−1) in the data, and exclusion of these two values results in a linear flux increase with increasing shading (table 3). An increasing trend in the average N2O fluxes also occurred on the DL site, caused by an increase in shading (not statistically significant) at the fertilized area, but no clear flux trend was observed between the shading levels at the unfertilized area.
Table 3. Average N2O and CH4 flux (μg m−2 h−1)* and the first and third quartiles at four shading levels and two fertilization levels at the AL and DL sites, where statistically significant differences in average fluxes across shading levels, within a fertilization and land use category (tested by Mann–Whitney U-test pairwise comparisons) are denoted by matching superscript letters.
| AL site N2O flux (μg m−2 h−1) | DL site N2O flux (μg m−2 h−1) | ||||||||||||
|---|---|---|---|---|---|---|---|---|---|---|---|---|---|
| Fertilization | Shading (%) | N | Mean ± STD | Min | Max | Q1 | Q3 | N | Mean ± STD | Min | Max | Q1 | Q3 |
| 0 | 0 | 9 | 74 ± 91 | 10 | 291 | 21 | 94 | 11 | 18 ± 19 | −6 | 64 | 6 | 26 |
| 28 | 9 | 110 ± 142 | 28 | 462 | 32 | 118 | 8 | 38 ± 29 | 12 | 103 | 18 | 43 | |
| 51 | 7 | 53 ± 19 | 28 | 88 | 40 | 62 | 8 | 16 ± 15 | 0 | 38 | 4 | 27 | |
| 90 | 9 | 69 ± 20 | 49 | 102 | 56 | 73 | 8 | 21 ± 36 | −14 | 84 | −6 | 45 | |
| 0–90 | 34 | 78 ± 86a | 10 | 462 | 35 | 88 | 35 | 23 ± 26 | −14 | 103 | 6 | 35 | |
| 1 | 0 | 8 | 228 ± 261 | 18 | 709 | 47 | 400 | 11 | 26 ± 16 | −7 | 49 | 17 | 39 |
| 28 | 9 | 320 ± 377 | 39 | 1195 | 75 | 479 | 9 | 27 ± 32 | −17 | 88 | 12 | 45 | |
| 51 | 9 | 773 ± 904** | 138 | 2956 | 233 | 749 | 12 | 38 ± 29 | 3 | 104 | 15 | 55 | |
| 90 | 9 | 420 ± 201 | 98 | 713 | 325 | 599 | 9 | 49 ± 70 | −22 | 220 | 26 | 40 | |
| 0–90 | 35 | 441 ± 541a | 18 | 2956 | 98 | 557 | 41 | 35 ± 40 | −22 | 220 | 17 | 47 | |
| All | 69 | 262 ± 429 | 10 | 2956 | 49 | 328 | 76 | 29 ± 34 | −22 | 220 | 9 | 40 | |
| AL site CH4 flux (μg m−2 h−1) | DL site CH4 flux (μg m−2 h−1) | ||||||||||||
| Fertilization | Shading (%) | N | Mean ± STD | Min | Max | Q1 | Q3 | N | Mean ± STD | Min | Max | Q1 | Q3 |
| 0 | 0 | 2 | −2 ± 12 | −11 | 7 | — | — | 9 | −35 ± 16 | −66 | −17 | −31 | −28 |
| 28 | 5 | −17 ± 25 | −59 | 2 | −17 | 0 | 7 | −4 ± 68 | −70 | 103 | −67 | 68 | |
| 51 | 2 | −7 ± 9 | −13 | 0 | — | — | 10 | −27 ± 27 | −50 | 23 | −48 | −20 | |
| 90 | 90 | 3 ± 8 | −8 | 10 | −2 | 9 | 6 | −65 ± 69 | −177 | 20 | −106 | −26 | |
| 0–90 | 13 | −7 ± 18 | −59 | 10 | −13 | 4 | 32 | −31 ± 48 | −177 | 103 | −52 | −18 | |
| 1 | 0 | 3 | −12 ± 9 | −22 | −3 | −22 | −3 | 9 | −30 ± 18 | −58 | −2 | −37 | −22 |
| 28 | 3 | 6 ± 25 | −22 | 27 | −22 | 27 | 7 | −21 ± 22 | −41 | 25` | −33 | −18 | |
| 51 | 1 | −13 | — | — | — | — | 6 | −25 ± 34 | −85 | 9 | −33 | 6 | |
| 90 | 4 | 6 ± 6 | 0 | 11 | 1 | 11 | 7 | −22 ± 29 | −51 | 36 | −41 | −10 | |
| 0–90 | 11 | −1 ± 16 | −2 | 27 | −13 | 11 | 29 | −25 ± 24 | −85 | 36 | −33 | −18 | |
| All | 24 | −4 ± 17 | −5 | 27 | −13 | 7 | 61 | −28 ± 39 | −177 | 103 | −45 | −18 | |
aMann–Whitney U = 169; Z = −5.113; p < 0.001. *Flux with negative sign denotes gas flow from the atmosphere into peat, and positive flux numbers are efflux from peat surface into the atmosphere. **By excluding the two highest fluxes mean N2O flux would be 374 ± 219 μg m−2 h−1.
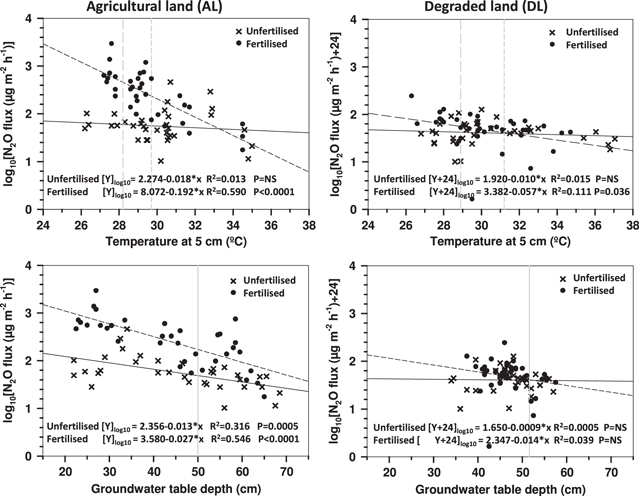
N2O fluxes deviated from normal distribution and thus the observations were log10-transformed to attain normal distribution for studying the relationship between fluxes and other concurrent in situ measured variables. N2O fluxes at the fertilized area of the AL site decreased notably (R2 = 0.423–0.590; F = 24.187–47.514; p < 0.001) with an increase in peat temperatures at 5–30 cm depths at the monitoring locations (figure 5). N2O fluxes also decreased in the fertilized area of the DL site when peat temperatures were higher at any of the three monitored depths in the upmost 30 cm peat layer (R2 = 0.089–0.169; F = 3.825–7.912; p = 0.008–0.058), and the highest correlation occurred between fluxes and the peat temperature at 10 cm depth. The negative correlation between N2O flux and peat temperatures at deeper monitoring depths of both sites was weaker. Negative trends were found during fertilized conditions in N2O emissions with an increase in temperature, which resulted in 35.7% lower AL site efflux and 12% lower DL site efflux for each 1 °C increase in peat temperature (at 5 cm depth). N2O efflux comparisons between diurnal and daytime peat temperatures in fertilized peat suggests a reduction of 48% (220 μg N2O m−2 h−1) in AL site and 26% (14 μg N2O m−2 h−1) in DL site fluxes monitored in daytime temperature conditions.
Figure 5. Correlation between log10-transformed concurrent N2O flux and temperature at 5 cm depth in peat and correlation between log10-transformed N2O flux and groundwater table depth at AL and DL sites. Each symbol represents an individual flux and groundwater table readout. A constant value of 24 was added to DL site fluxes prior to log10-transformation. Shaded lines represent averages for unshaded peat 24 h temperature (dashed), daytime temperature (dotted) at 5 cm depth and groundwater table depth (solid).
Download figure:
Standard image High-resolution image
N2O flux at the AL site positively correlated with the increase in groundwater table depth, and the effect was somewhat larger in the fertilized section (R2 = 0.546; F = 39.673; p < 0.0001) than in the unfertilized one (R2 = 0.316; F = 14.807; p = 0.0005), (figure 5). No correlation between the average N2O flux and the WT depth was found at the DL site.
Observations of concurrent fluxes, peat temperatures and groundwater depth were confirmed by observations of long-term averages on the monitoring locations. Comparisons between AL site long-term average N2O flux and peat temperatures at the fertilized area indicated notable negative correlations at all temperature monitoring depths in peat (R2 = 0.604–0.466; F = 8.726–15.277; p = 0.005–0.014), with the highest p-value for the depths of 5 cm (R2 = 0.565; F = 12.966; p = 0.005) and 10 cm (R2 = 0.604; F = 15.277; p = 0.003). AL site long-term average N2O flux and average WT also indicate correlation (R2 = 0.463; F = 8.627; p = 0.015), similar to that found in the analysis of concurrent fluxes. No statistically significant correlations were observed between long-term average N2O fluxes and peat temperatures or fluxes and groundwater table depth at the DL site.
Most CH4 fluxes occurred from the atmosphere to the soil (table 3), which was the expected result due to the drained status of the study sites. Average CH4 influx on the DL site (−28 μg m−2 h−1) was somewhat higher than the very modest average influx of −4 μg m−2 h−1of the AL site. No statistically marked difference was observed between average CH4 fluxes at the two fertilization levels or at the four shading levels either at the Al or DL site. However, a trend of lower CH4 sinks along the increase in shading levels, except for 28% shading, could be seen at the DL site.
The only correlation found occurred between long-term average CH4 influxes and the WT depth increase on the AL site (R2 = 0.267; F = 5.471; p = 0.034) in pooled data including both fertilization treatments, i.e. the influx volume increased if WT was further away from the peat surface. No correlation was observed between plot long-term average CH4 fluxes and peat temperatures at the AL or DL site.
Discussion
Peat characteristics
Peat characteristics were expected to be comparable at the two sites prior to the experiment because both sites had been clear-felled and drained over a decade ago, both had been repeatedly affected by fire or burnt residues and both have relatively modest vegetation cover. Surface peat bulk densities at both sites were in the range found in compacted drained peat (Page et al 2011). Unfertilized peat N, P and K concentrations were lower at the AL site than at the DL site, which was unexpected because the AL site is repeatedly fertilized during crop production periods. A total of 50 kg ha−1 of each NPK-fertilizer element added to part of the experiment sites was realistic, as similar amounts are applied when growing oranges, apples, water melons, melons, onions etc, although larger fertilization amounts are used for some crop species. For example, typical reported NPK-N fertilization rate for oil palm grown on deep peat is 50–100 kg ha−1 yr−1 during immature stage and 120–160 kg ha−1 yr−1 during mature stage (Ng et al 1990) last of which covers more than half of the ca. 25 yr long production cycle. The added NPK-fertilization resulted in an expected increase in peat N and P concentrations at the AL site, but the average N and P concentrations of fertilized plots on the DL site were surprisingly lower than at the unfertilized plots. Peat closest to the soil surface typically consisted of the highest element amounts, and this element enrichment in surface peat could indicate that the most active organic matter turnover processes take place in the topmost peat. Added NPK-fertilization substrates were additionally likely retained or processed mostly in the topmost soil because N, P and K-concentrations between the fertilization treatments did not differ much deeper down in the peat profiles of the experiment sites.
Hydrology
WT range during our study was typical for the AL site where water tables close to the peat surface are favoured for growing vegetables. Groundwater table positions in the uncontrollably drained DL site were also within the range normally found during this time of year (Jauhiainen et al 2008). Peat average water content values down to 30 cm depth were slightly higher at the AL site than at the DL site, which is in line with the observed differences in WT and WFPS values. The average water content differences within the upmost 40 cm peat profile were significant at both sites, but the values do not indicate excessive peat profile drying at any shading conditions. Only the very topmost peat (located less than 10 cm from the surface) appears to be subject to wider moisture scales in our experiment, based on WFPS values, as the WFPS averages were constantly ca. 60–65% below the topmost peat at both sites. Relatively frequent rain events and a WT average of ca. 50 cm depth maintained surface peat moist, and thus peat water content (moisture) conditions did not likely form a specific microbial activity-influencing factor between the different shading conditions. Low peat water content can generally both change microbial activity in peat (Jaatinen et al 2008, Kwon et al 2013) and weaken microbial community responses to substrate temperature (Davidson and Janssens 2006). Very deep water tables towards the end of the dry season in these drained peatlands result in drying of the surface peat, and consequently in decreases in both total and heterotrophic soil respiration rates (e.g. Jauhiainen et al 2008, Hirano et al 2009, 2014). The possibility of different decomposition responses in the extreme hydrological conditions remains to be studied.
Light
Proportional light conditions measured over the unshaded peat surface at noon were within the typical range for the land uses in the area. Ibie and Takahashi (2002) determined PPFD at various heights below the canopy in a peat swamp forest area close to the experiment sites and found the daily PPFD above the upper canopy level at 30 m height (100%) to decrease proportionally to 84% at 20 m, 29% at 10 m, and 4% at 1.5 m heights in the understory. Forest light measurements in our study resulted in a comparable (95%) shading effect by the canopy, which is relatively close to the highest experimentally created 90% shading. At the same degraded open area, shading varied within small areas depending on the vegetation type and could form 63% to 99% shading under bushes and fern thickets. Shading of the crop understory at the AL site also varied considerably, and was between 37% and 88%.
Peat temperature
Although diurnal and annual peat temperature fluctuations are often lower in tropical lowland peat areas than at higher latitudes, general surface peat temperature increases after land use change, short-term differences in diurnal temperatures and momentary shading conditions are reported for tropical peat (e.g. Brady 1997, Melling et al 2005, Ali et al 2006, Jauhiainen et al 2012a, Hirano et al 2014). Jaya (2007) reports average diurnal topsoil temperatures to be 22.9 °C, 26.7 °C and 30.2 °C for an intact peatland forest, a heavily degraded forest and an agricultural area in Central Kalimantan, respectively. The average daytime peat temperatures at 5 cm depth (29.9 °C) in an open degraded peatland were 4.4 °C higher than in undrained forest peat (25.5 °C) located across the river in Central Kalimantan (Jauhiainen et al 2005, 2008). According to Jauhiainen et al (2012a), the average diurnal surface peat temperature difference in A. crassicarpa plantations in Riau Sumatra (at 5 cm depth) was 0.8 °C between a recently planted area (27.3 °C) and mature closed-canopy stands (26.5 °C), while the daytime surface peat temperature averages differed up to 5 °C between areas with different rotational statuses.
Peat temperature dynamics had two outcomes along the increased shading gradient in our study. Firstly, increased shading resulted in lower average peat temperatures and a narrower peat temperature range over time, which was the long-term outcome. The upmost 50 cm peat profile temperatures under 90% shading averaged 2.5 °C (AL site) and 2.3 °C (DL site) lower in comparison to the unshaded peat in the experiment (see table 1). Average peat temperatures at 50 cm depth were higher under the most shaded conditions than average temperatures close to the surface that may have resulted from higher diurnal temperature variations and proportionally cooler night temperatures in the topmost peat.
Secondly, short-term, i.e. diurnal temperature differences in peat were concentrated close to the surface, and this variation was practically absent in the peat at 30–40 cm depths. Especially in unshaded conditions the diurnal temperature range close to the peat surface was wide, averaging 4.2–5.5 °C at 5 cm depth at the two experiment sites. The diurnal surface peat temperature range in unshaded conditions was even wider than the difference to the 'long-term' temperature created by 90% shading. Peat has low thermal conductivity compared to mineral soils, which restricts the depth reached by diurnal (short-term) heat transfer (Farouki 1981, Côté and Konrad 2005). Diurnal peaks in peat temperatures at increased distances from the surface took place with a few hours delay deeper down, due to relatively low thermal conductivity. Peat at these sites was compacted and rather moist during the experiment, and the dependence between heat transfer and soil water content in these conditions is lower (Farouki 1981), e.g. evaporation would have relatively little influence on peat temperatures.
Surface peat temperature differences between daytime (during peak gas flux monitoring hours) and diurnal temperatures were high in our study, i.e. 1.5–2.3 °C in unshaded peat and 0.4 °C under highest shading. Temperature differences of a similar scale are found on a landscape-scale, where diurnal temperature differences in soil can become important. Where large biomass rotational crops growing, repeated and prolonged exposure of the soil surface occurs during the period between harvesting and follow-up rotation vegetation canopy cover expansion. Jauhiainen et al (2012a) found A. crassicarpa plantation tree cover to reduce peat daytime and diurnal temperature differences, as the average daytime (11:00–13:00) temperatures in peat at 5 cm depth were 1.3 °C higher in closed-canopy stands and 1.6 °C higher in open bare and young Acacia stands. The rotation cycle of Acacia lasts up to 6–7 yr and the canopy closure takes place about two years after planting. The rotation cycle of crops, e.g. oil palm, lasts up to 20 yr, canopy closure takes place between 4 and 6 yr and canopy volume stabilizes by the age of 10 yr (McMorrow 2001). Diurnal temperature differences remain spatially small in steady-state peat swamp forests, where crown cover consists of multiple crown layers and is nearly continuous, and only relatively small patches of peat surface near recently fallen trees are exposed at a time.
GHGs
We found that most GHG species responded to treatments at the AL site, which has been seasonally used for smallholder agricultural crop production, while the gaseous flux responses to treatments remained low or did not provide a clear trend at the DL site. A review by Davidson and Janssens (2006) summarizes the recalcitrant characteristics of the decomposing substrate itself, and environmental constraints (physical and chemical protection, drought, flooding and freezing) as factors lowering decomposition process sensitivity to temperature increase, which exemplify many of the environmental and peat characteristics present at both study sites. Peat at both sites can be characterized as recalcitrant and physically compacted as an outcome of low organic matter inputs and substrate losses occurring over decades in increased oxic conditions due to enhanced drainage, fire impacts and high temperatures. Fire history at the Al site includes frequent controlled burning of crop residues and other substrates to produce an ash fertilizer, but peat substrate burning at the site is limited. At the DL site, fires are uncontrolled and several decimeters of surface peat and vegetation has been consumed in three fire events within the last 20 yrs (Hoscilo et al 2011, Hamada et al 2013, Hirano et al 2014). High impact wild fires at the DL site may have less soil fertility enhancing impact than controlled management fires at the AL site, with consequences also for the peat organic chemistry and microbial communities. Structural peat characteristics at the sites are quite similar as complex ligneous compounds, determined as Klason-lignin, form ca. 60–80% of the substrate mass of these sites, and more labile substrates are marginal (M Könönen et al in preparation). We suggest that management differences on the sites, including fire impacts, WTs maintained close to the surface and recurrent modest fertilization of the AL site have impacted peat microbial communities over time and has better potential for responding to changes in environmental resources and conditions than observed at the DL site. Surface peat at the DL site does not receive added nutrients and is annually subject to highly differing hydrological conditions, including both extreme dryness and flooding. For better understanding of the differences in detected GHG flux outcomes, it would be important to learn from the microbiological community structures in these sites and comparable land uses.
The average heterotrophic CO2 fluxes in untreated conditions, i.e. unshaded and unfertilized areas, were comparable to respiration rates found in earlier studies (Jauhiainen et al 2008, Hirano et al 2009), and the average CO2 flux difference between the sites remained low. Typical WT depths (59–40 cm) at the AL site were slightly deeper but partly overlapped the groundwater position range of 29–47 cm, resulting in the highest on-site CO2 fluxes in the study by Hirano et al (2009). Typical WT depths at the DL site (59–47 cm) during the experiment were also somewhat deeper than the previously found WT range of 36–43 cm, resulting in the highest CO2 emissions (Jauhiainen et al 2008).
The organic matter decomposition rate on peatlands positively correlates with temperature increase at higher latitudes (Lafleur et al 2003, Minkkinen et al 2007, Mäkiranta et al 2009). Also in this study, the shading intensity impact on peat temperatures (discussed above) and heterotrophic CO2 emissions was clear on the AL site, despite the fact that the annual temperature range in equatorial lowlands in the region are fairly limited. Differences in CO2 fluxes were largest between the most opposing shading conditions on the AL site, where the daytime monitored heterotrophic CO2 emission from peat averaged at 33.3% lower at 90% shading compared to the emissions from unshaded peat, while the respective average peat temperatures above the average groundwater table (−50 cm) were 8.5–10.3% (2.4–2.9 °C) lower at 90% shade. Added NPK-fertilization of ∼300 kg ha−1 at the AL site resulted in an even more extreme flux difference between shading levels as the heterotrophic CO2 emission at the highest 90% shading averaged at 65.8% lower in comparison to the unshaded fertilized peat. CO2 emission rates in the unfertilized and NPK-fertilized conditions were similar at a lower temperature range (at 27 °C in figure 4) in terms of peat temperatures, but emissions from the fertilized plots increased greatly at higher temperatures. For example, the correlation between CO2 flux at 32 °C at 5 cm peat depth suggests an ∼80% higher CO2 flux average in fertilized conditions (0.467 g CO2 m−2 h−1) in comparison to the flux in unfertilized conditions (0.259 g CO2 m−2 h−1). If the fertilization of cultivated soils results in a comparable increase in heterotrophic CO2 emission levels and increased sensitivity to temperature in general, the fertilization impact on the emissions of heavily fertilized land uses on peat soils should be addressed.
Several recent studies relate observed CO2 emissions (total or heterotrophic emissions) with peat temperatures at 5 cm depth (Jauhiainen et al 2012a, Hirano et al 2009, 2014, Husnain et al 2014). Although the peat temperature range at 5 cm depth was over 10 °C (22.6–33.4 °C) during our study, Q10-value application to our data is largely limited by the much narrower range in typical temperature conditions, with the difference averaging at less than 3 °C. The Q10-values of the unfertilized AL site would technically be between 2.2 and 3.7 (R2; 0.782–0.966) when using peat average temperatures corrected to daytime values at 10–30 cm peat depth (table 1) and average daytime heterotrophic respiration (table 2) for a temperature range of 25–35 °C. Respective Q10-values for fertilized peat at the AL site would be extremely high, i.e. between 8.1 and 35.4 (R2; 0.926–0.999) depending on the temperature reference depth in peat. Hirano et al (2009) report the dependence between total soil respiration rate and peat temperature at 5 cm depth to be equivalent to Q10-values between 2.4 and 3.0 within the soil temperature range of 24–29.5 °C in a diurnal monitoring-based dataset gathered from a peat swamp forest floor. Heterotrophic CO2 emission rates from tropical swamp forest peat samples incubated on the forest floor at a temperature of 25 °C and in a clear-felled area in conditions simulating 35 °C were similarly found to double at the elevated temperature (Brady 1997). Hirano et al (2014) report a Q10-value of 1.36 at WT depths of 0 cm and a Q10-value 1.16 for 70 cm WT depth for open degraded peatland approximate to the DL site, gathered during a nearly 2 yr long automated diurnal heterotrophic flux monitoring study, which largely confirms our observations of the poor temperature sensitivity of degraded peat.
Diurnal surface peat temperature variations can also give rise to notable temporal differences in CO2 emissions, especially if there are oxic conditions and the surface peat to depth of 5 cm (or even to 10 cm) is considered the main source of heterotrophic CO2 emissions (e.g. Hirano et al 2009, 2014, Jauhiainen et al 2012a, Husnain et al 2014). The daytime average temperature at 5 cm depth in our study was 1.5 °C higher than the diurnal average (28.2 °C) in unshaded conditions in the unfertilized peat of the AL site, where applied CO2 emission regression (from figure 4) suggests a 12.1% reduction in the CO2 emission average of 0.21 g m−2 h−1 based on daytime fluxes. For the unfertilized peat of the 90% shaded AL site, the peat diurnal average temperature at 5 cm depth was 25.3 °C and the daytime average was only 0.4 °C higher, in which conditions the regression results in a 4.2% difference in CO2 fluxes between daytime and diurnal temperature conditions in peat. For fertilized peat, a steeper regression slope suggests a much higher difference in CO2 flux when corrected for the difference between daytime and diurnal peat temperature conditions. Jauhiainen et al (2012a) report 1.45 °C peat temperature differences between daytime and diurnal temperatures at 5 cm depth in peat at A. crassicarpa plantations, which was concluded to result in a 14.5% reduction in annual heterotrophic CO2 emissions after correction of daytime monitored fluxes. Because correlation between concurrent CO2 fluxes and peat temperatures at monitoring locations remained much lower than the correlation between the long-term flux and peat temperature averages in this large database, we can suggest that decomposer community efficiency, structure or mass close to the peat surface respond to momentary changes in peat temperatures to a lesser extent than to the temperature conditions over longer time scales. Momentary temperature differences in surface peat can be created daily by passing clouds in exposed areas, by gaps in vegetation canopy cover, or at the edges of plant canopies. Brady (1997) reports peat temperature fluctuations of up to 5 °C occurring within a 20 min period in degraded forests, caused by passing clouds blocking the Sun. In this regard, it would good to inspect peat CO2 fluxes on the basis of long-term temperature conditions and ensure that flux data collection is located at spatially and temporally relevant temperature-environments at monitoring sites. For the N2O and CH4 gases reaching the peat surface, gas formation takes place over a proportionally wider or deeper section of the peat profile, i.e. in a more stable temperature environment, and thus short-term differences in the topmost peat temperatures may have less impact on gas formation.
The depth of potentially aerobic peat may occasionally have been more limited at the AL site, where WTs were often closer to the surface compared to WT positions at the DL site. Although the WT means and medians were very similar at the sites, the logger data gives a wider WT range (63 cm wide) for the AL site than the DL site (45 cm wide), which may have contributed to the better correlation observed between CO2 emission and WT at the AL site and for the lack of clear response at the DL site. Added fertilization (∼300 kg NPK ha−1) was found to greatly increase CO2 flux in conditions where the WT was deeper in peat than the average position at the AL site. Correlation between average CO2 fluxes and WT in fertilized plots suggests ∼180% (0.32 g CO2) higher CO2 flux when WT sinks 10 cm from 45 cm, while the respective flux in unfertilized conditions is ca. 25% (0.043 g CO2) higher. The lack of a CO2 flux response to peat temperatures and WTs even in fertilized conditions at the DL site indicates profound, but in this study unquantified, differences in the biotic communities of these sites.
The N2O fluxes in our study were comparable to fluxes observed in unfertilized low vegetation cover areas on tropical peat (Hadi et al 2000, 2005, Inubushi et al 2003, Furukawa et al 2005, Takakai et al 2006, Jauhiainen et al 2012b). Because the N2O flux averages did not markedly differ along the shading gradient, mainly due to some extreme flux values, correlation in concurrent in situ peat temperature and WT conditions better describe these gas fluxes. Temperature differences in the AL peat resulted in a low response in N2O fluxes, but the response was more pronounced at the NPK-fertilized AL plots. Our in situ finding of low net N2O production having little or no response either to N-fertilization or peat temperatures at the DL site can be explained by the site's denitrifying community exhibiting a very low N2O/N2 product ratio (in preparation). Furthermore, the DL peat has very low nitrification potential (in preparation), which renders major parts of the applied fertilizer (∼60% of N as NH4+) useless as a direct substrate for denitrification.
Unlike with CO2 fluxes, an increase in shading during the experiment, i.e. a decrease in surface peat temperatures, resulted in a trend of lower N2O fluxes during fertilized conditions at both sites. It can be assumed that nitrification has little importance to direct N2O production, which can be attributed mainly to denitrification in both peats as (i) nitrification as a strictly aerobic process is inhibited in waterlogged areas, (ii) the pH of both sites is very low (∼3.4) and inhibits nitrification, and (iii) the DL site and a nearby undrained peat swamp forest exhibit little or no nitrification (in preparation).
Added nitrogen availability is found to increase both N2O emission average rates and flux variation in several studies (e.g. Takakai et al 2006, Maljanen et al 2010, Jauhiainen et al 2012b), including our study. In addition to accelerating overall denitrification as a direct source of substrate, NO3− addition has been shown to partially inhibit the N2O reductase enzyme in soils (Blackmer and Bremner 1976, Letey et al 1981), increasing the N2O/N2 product ratio. This effect was, however, not visible in our study. Mixed outcomes in N2O flux and temperature relations has been found in boreal peatlands, which are subject to wide annual temperature ranges, and the possible effect has varied by season, year and/or the studied site (e.g. Lohila et al 2010, Maljanen et al 2012). A negative correlation trend in N2O flux with increasing peat temperatures in fertilized peat was a somewhat unexpected result in our study as in general, increase in temperature increases the overall denitrification (e.g. Nömmik 1956, Bailey and Beauchamp 1973, Dobbie and Smith 2001). It remains unknown whether the detected lower N2O emissions at higher temperatures are caused by a generally lower temperature optimum of the N2O-producing microbial community, or because of an enhanced reduction of N2O to N2 at higher temperatures close to the peat surface. Different denitrification enzymes respond differently to temperature, which plays a role in interpreting in situ N2O emissions. Studies from terrestrial ecosystems (Nömmik 1956, Bailey and Beauchamp 1973, Maag and Vinther 1996, Holtan-Hartwig et al 2002) show that N2O consumption (i.e. the reduction of N2O to N2) increases with temperature. Hence, the overall increase in denitrification with an increase in temperature can result in decreased in situ N2O production, as in our study.
A possible explanation for the negative relation may also be connected to peat hydrology. The trend found between N2O flux and groundwater table depth suggests that the narrow oxic peat layer or more wet peat could form favourable conditions for N2O reaching the boundary between peat surface and the atmosphere. In fact, one of the main suggested factors influencing N2O emissions is WFPS, which describes the compactness of soil microstructure and aerobic conditions, where high BD in peat and soil wetness increase the WFPS value and result in an increase in N2O emissions (Linn and Doran 1984, Takakai et al 2006). Peat WFPS values in our study averaged between 60% and 65% in the peat profile, which is close to the WFPS threshold found to increase N2O emissions from increasingly wet peat (Linn and Doran 1984, Takakai et al 2006, Toma et al 2011).
Modest methane flux rates in our study and a typical direction, i.e. from the atmosphere to peat, are typical for drained tropical peat (Inubushi et al 2003, Hadi et al 2005, Jauhiainen et al 2008, Hirano et al 2009). A small amount of data in the final analysis and the fact that drained conditions do not favour net CH4 emissions from peat into the atmosphere largely limit interpretations on the effects of shading and peat temperature on the dynamics of this gas. The DL site, however, appears to be a stronger methane sink compared to the AL site. Agricultural practises, including changes in nutrient availability and hydrology, might have changed both methanogenic and -trophic communities at the AL site. A lower CH4 sink at the DL site is observed along all shading levels, except for 28% shading. This decrease is particularly clear at the lowest peat temperature (90% shading). The lower CH4 consumption at fertilized AL plots may be caused by NH4+ inhibition of methane oxidation (e.g. Kightley et al 1995, Kravchenko 2002).
Conclusions
As a response to the hypotheses made prior to our experiment we can summarize the following; firstly, land management differences can divert organic substrate- or decomposition-conducting microbial community characteristics so that apparently similar site types in comparable conditions result in differing responses in GHG fluxes to peat temperatures and fertilization. Secondly, a temperature change in recalcitrant peat can alter organic matter decomposition-derived GHG fluxes markedly, where a temperature increase does not necessarily lead to a positive relation in emissions, but site internal characteristics may also lead to a low response to the change in peat temperature. Thirdly, an increase in nutrient availability can markedly enhance recalcitrant organic matter decomposition sensitivity to temperature, where the outcome in various GHG species may differ, but the response to both fertilization and temperature may also remain low due to site internal characteristics.
Spatio-temporal effects from soil surface shading on peat temperatures can markedly influence GHG fluxes. Proper attention should be paid to (i) gas flux monitoring arrangements in the field for capturing and describing site temperature characteristics, and also to (ii) sufficient gas flux and temperature data collection in time and space for covering long-term and diurnal effects from temperature and other (e.g. possible fertilization, root respiration, etc) GHG flux-influencing factors in an adequate way.
Considering the vast size of deforested unmanaged peat areas in tropical lowlands, reduced peat temperatures gained by an increase in permanent vegetation shading could result in a marked reduction in peat carbon substrate loss as GHG emissions to the atmosphere. The value of soil shading by vegetation is directly linked in work performed for reduced carbon loss from tropical peatlands e.g. in efforts for reducing carbon emissions from deforestation and forest degradation (REDD) and 'REDD+' where sustainability, conservation and enhancement of forest carbon stocks is sought by degraded peat reforestation.
Acknowledgements
We wish to thank the landowner Mr Edi in Kalampangan village for renting his land for our study and helping with the site maintenance. Dr Inoue Takashi is thanked for providing precipitation data and AL site groundwater table logger data shown in modified form in figure 1. Our study could not have been made without logistics and data collection support provided by CIMTROP, and especially Mr Feteria Darma, Mr Patih Rumbih and Mr MSc. Kitso Kusin are thanked with gratitude. Mr Trygve Fredriksen is acknowledged for his help in the laboratory. Our study was part of the project 'Restoration Impact on Tropical Peat Carbon and Nitrogen Dynamics' (RETROPEAT). Research permission for the RETROPEAT project was granted by the Indonesian Ministry of Research and Technology (RISTEK).