
Abstract
A climate driven, water resource systems model of the southwestern US was used to explore the implications of growth, extended drought, and climate warming on the allocation of water among competing uses. The analysis focused on the water benefits from alternative thermoelectric generation mixes, but included other uses, namely irrigated agriculture, municipal indoor and outdoor use, and environmental and inter-state compact requirements. The model, referred to as WEAP-SW, was developed on the Water Evaluation and Planning (WEAP) platform, and is scenario-based and forward projecting from 2008 to 2050. The scenario includes a southwest population that grows from about 55 million to more than 100 million, a prolonged dry period, and a long-term warming trend of 2 ° C by mid-century. In addition, the scenario assumes that water allocation under shortage conditions would prioritize thermoelectric, environmental, and inter-state compacts by shorting first irrigated agriculture, then municipal demands.
We show that while thermoelectric cooling water consumption is relatively small compared with other uses, the physical realities and the legal and institutional structures of water use in the region mean that relatively small differences in regional water use across different electricity mix scenarios correspond with more substantial impacts on individual basins and water use sectors. At a region-wide level, these choices influence the buffer against further water stress afforded the region through its generous storage capacity in reservoirs.
Export citation and abstract BibTeX RIS

Content from this work may be used under the terms of the Creative Commons Attribution 3.0 licence. Any further distribution of this work must maintain attribution to the author(s) and the title of the work, journal citation and DOI.
1. Introduction and background
The southwestern United States is an arid region with constrained freshwater resources. The water supplies in the region are dominated by surface flows, primarily from springtime snowmelt from the Rocky and Sierra Nevada Mountains, with underground aquifers accounting for an estimated 32% of freshwater supplies in the region (Kenny et al 2009)3. While mountain snowmelt is the primary resource, the North American monsoon plays an important role in the regional water balance, particularly in Arizona. Although irrigated agriculture is the dominant water user in much of the western US, the freshwater demands associated with large population centers and thermoelectric power plants also produce localized water stress in the region (Averyt et al 2013). Any future changes in freshwater supply or demand likely will have important implications for people living in the region. Major anthropogenic water demands include agricultural uses, municipal and industrial uses, and the water requirements of electricity generation, which primarily stem from cooling processes in thermoelectric generation technologies (Kenny et al 2009). Accordingly, key drivers of future freshwater resources in the region are climate, trends in population and associated municipal water use patterns; irrigated agriculture; and the mix of electricity generation technologies. In particular, future water use for thermoelectric generation, which currently accounts for 41% of nationwide water withdrawals (Kenny et al 2009), is uncertain and will be influenced by decisions about electricity generation technologies (Hoffman et al 2004, Macknick et al 2012b).
A growing literature examines the impacts of electricity generation choices on water resources in North America. Numerous recent publications (Averyt et al 2013, Brown et al 2012, Bureau of Reclamation 2012, Caldwell et al 2012) include the implications of electricity generation in estimations of the ability of future water supplies to meet future water demands but do not isolate the water implications of the electricity mix scenarios from a background of climate and population trends. This letter is unique among these in focusing on the water implications of the electricity mix scenarios when set against a background of climate and population trends. Some studies (NETL 2010, Elcock 2010, Chandel et al 2011) consider electricity generation but only at scales too coarse for evaluating highly localized water impacts, such as the NERC region or sub-region. Other related research (EPRI 2011, Roy et al 2012) does not consider changes to the electricity network, such as new generation and transmission. Tidwell et al (2012) and (Macknick et al 2012b) focus on impacts of electricity mix scenarios but not do address the specific details of the water system.
2. Methods
The analysis described in this letter originates from the electricity–water modeling exercise for the southwestern United States described in Yates et al (2013) and (Sattler et al 2012). We describe the integration of the spatially explicit output of electricity mix scenarios developed with the Regional Energy Deployment System (ReEDS) model (Short et al 2011) with a model of the southwestern US's regional water system implemented through the Water Evaluation and Planning system (WEAP; Yates et al 2005), which we refer to as WEAP-SW. Projecting out to 2050, the analysis focuses on the implications of alternative electricity generation technology mixes on the region's water resources, by incorporating assumptions about persistent, long-term drought, increasing average temperatures, and an increasing regional population.
The output of the ReEDS model is monthly thermoelectric water demand and is incorporated into the WEAP-SW model following the 'hand-shake' procedure described in detail by Sattler et al (2012). ReEDS geographies at the sub-state electricity PCA area shown in red in figure 1 are translated proportionally into WEAP-SW geographies, with watersheds defined roughly at the six-digit hydrologic unit classification (HUC) level and by elevation band. The projected electricity generation technology mixes are converted into water withdrawal requirements by ReEDS and WEAP-SW then estimates the consumption volumes based on the electricity generation technology water use coefficients reported by Macknick et al (2012a). Other competing water demands include municipal and industrial indoor use prescribed on a per-capita basis, outdoor municipal turf and amenity use, irrigated agriculture, environmental requirements, and hydropower generation. Climate driven crop water demand is simulated through estimates of potential evapotranspiration and soil moisture deficits. The population of the southwest region include in our model increases from 54 to 102 million over the period 2010 to 2050. More details are reported in Clemmer et al (2013), Sattler et al (2012), and Macknick et al (2012b).
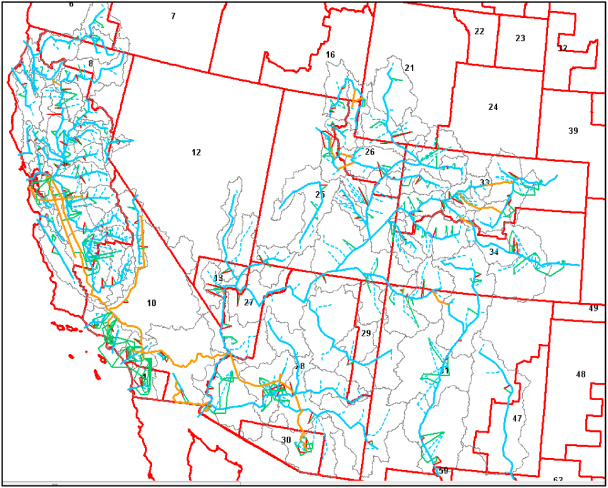
Figure 1. The WEAP-SW domain, with PCA boundaries (red), inter-basin diversions (orange); rivers (light blue) and watershed boundaries (gray). The inset boxes are the San Juan and South Platte Basins where we explore some regional results (below).
Download figure:
Standard image High-resolution image2.1. Overview of the electric-sector model
We draw from Clemmer et al's (2013) future scenarios of the contiguous US power sector from 2010 to 2050 from the Regional Energy Deployment System (ReEDS) electricity model developed by the National Renewable Energy Laboratory (NREL). ReEDS is a long-term capacity expansion and dispatch model that represents all major electricity generation technologies, including coal, natural gas combined cycle, natural gas combustion turbines, fossil fuels with carbon capture and storage (CB), nuclear, hydropower, wind, solar, geothermal, biopower, and storage. The ReEDS model represents the US electricity generation and transmission systems in detail and addresses numerous complexities related to power system operations and infrastructure expansion (Short et al 2011). Assumptions for future prices, costs, electricity demand, and other relevant factors such as technology performance come from the EIA's Annual Energy Outlook 2011 (AEO 2011) reference case, EIA (2011), as well as from NREL analysis on actual power plant retirements (Short et al 2011) and publicly available information on plant retirements and planned additions.
We consider the output of five different electricity mix scenarios, detailed in Clemmer et al (2013) and summarized in table 1: these include one 'business-as-usual' scenario (BAU); three carbon-constrained scenarios emphasizing different low-carbon technologies, and one high fossil fuel scenario. The three carbon-constrained scenarios include a carbon budget with no new technologies (CB); nuclear and coal intensive technologies, with carbon capture and storage (CCSNK), and a renewable energy and energy efficiency scenarios (REE). A fifth scenario is based on the Annual Energy Outlook (AEO) and is an alternative reference case in which coal remains as a dominant electricity generation technology fuel instead of being phased out in the upcoming decades, with no carbon budget constraints (see Clemmer et al 2013 for details).
Table 1. Summary of key differences among electricity mix scenarios.
| Scenario number | Carbon budget? | Specific generation technology focus |
|---|---|---|
| 1 BAU | No | None (natural gas dominates) |
| 2 CB | Yes | Carbon budget with US electric-sector targets of 170 Gt-CO2eq. No technology targets |
| 3 CCSNK | Yes | Carbon budget with coal generation that includes CCSa; and more nuclear |
| 4 REE | Yes | Carbon budget, with renewable energy; energy efficiency; reductions in energy use |
| 5 AEO | No | Annual energy outlook, coal remains. Not carbon budget |
2.2. Overview of the WEAP-SW model
The WEAP-SW model includes 63 individual rivers throughout the six state region that encompasses California, Nevada, Arizona, Utah, New Mexico, and Colorado. Rivers are simulated at roughly the six-digit HUC level, although more detail is developed where there are important hydrologic and water resource attributes such as trans-basin diversions. At the six-digit HUC level, some rivers include the Green River of Wyoming and Utah; the upper and lower Colorado, the Rio Grande, the Salt and Gila Rivers of Arizona, the Sacramento and San Joaquin Rivers of California; and many others. These rivers contain the major water projects of the southwestern US, such as the Colorado Big Thompson Project, which delivers water from the west to east slopes of the Colorado Rockies in Colorado; the Central Arizona Project and Imperial Irrigation District, which deliver Colorado River water for urban and agriculture use in Arizona and California; the California State and Central Valley Water Projects, which deliver water from Northern California, for use in the Central Valley and Southern California (Yates et al 2013).
These rivers include 54 of the largest reservoirs in the southwest, totaling 135.5 billion cubic meters or BCM (110 million acre-feet or MAF) of storage. The majority of this storage is in the Colorado River Basin at roughly 75 BCM (60 MAF), with the majority of this storage (65 BCM or 53 MAF) in both Lake Mead and Lake Powell (Bureau of Reclamation 2012). Reservoirs in the WEAP-SW model are not 'operated' in the strictest sense with descriptive operating rules, rather WEAP's priority system and buffer coefficient serve to retain water in storage and make releases proportional to current storage (Yates et al 2005). Smaller reservoirs are not included in the model.
The WEAP-SW model estimates water supplies through hydrologic simulation, where monthly precipitation, temperature, relative humidity, and windspeed drive a conceptual rainfall/snow/runoff model (see Yates et al (2013) for details). The WEAP-SW model includes 24 groundwater basins, and while demands are generally met through surface water supplies, groundwater water is another supply source whose use is constrained as a percentage of withdrawal based on best available current estimates from state data (Yates et al 2013).
In Yates et al (2013), the calibration and validation of the model is described in detail, summarizing the model's representation of water use and its skill in simulating streamflow, reservoir storage, inter-basin transfers, and other attributes. Table 2 summarizes water use by sector and state, while figures 2 and 3 summarize some calibration and validation statistics for select river flows and reservoir storage for the largest water supplies of the region for the historic period 1980–2010. The model was shown to adequately represent regional to local water uses by sector, river flows, and water storage and delivery at both local and regional levels.
Table 2. State-wide summary of WEAP-SW total population and irrigated acreage estimates at 2008 levels (columns 1 and 2). Column 3–5 report the annual delivered water in millions of m3 for each sector; with column 3 the minimum, maximum, and average water delivered to the agricultural sector; column 4 is municipal and industrial indoor delivered water (MiI) for 2008 levels of demand; column 5 is the municipal outdoor (MuO) minimum and maximum for the period 1980–2010; and column 6 is the annual water withdrawal for thermoelectric cooling (the Yates et al (2013) companion paper breaks these out by region). The dashed lines for Nevada indicate no estimates made.
| Region (pop '000000) | Ag area (km2) | Ag applied water (Mn,Mx,Avg) | MiI | MuO (Mx,Mn) | Thermo |
|---|---|---|---|---|---|
| Colorado (5.3) | 12 000 | 5700, 8400, 6900 | 620 | 400, 700 | 410 |
| Utah (2.7) | 5 000 | 1750, 2550, 2200 | 300 | 220, 345 | 103 |
| New Mexico (1.0) | 1 000 | 440, 580, 510 | 170 | 145, 165 | 344 |
| Nevada (1.4) | — | — | 270 | 240, 280 | 9 |
| Arizona (5.8) | 4 000 | 3600, 5800, 4700 | 620 | 550, 830 | 280 |
| California (32.0) | 34 000 | 35 000, 45 000, 40 000 | 4800 | 20, 25 | 41 |
| Other (6.0) | 5 000 | 5000, 5900, 5500 | 500 | 145, 165 | 2500 |
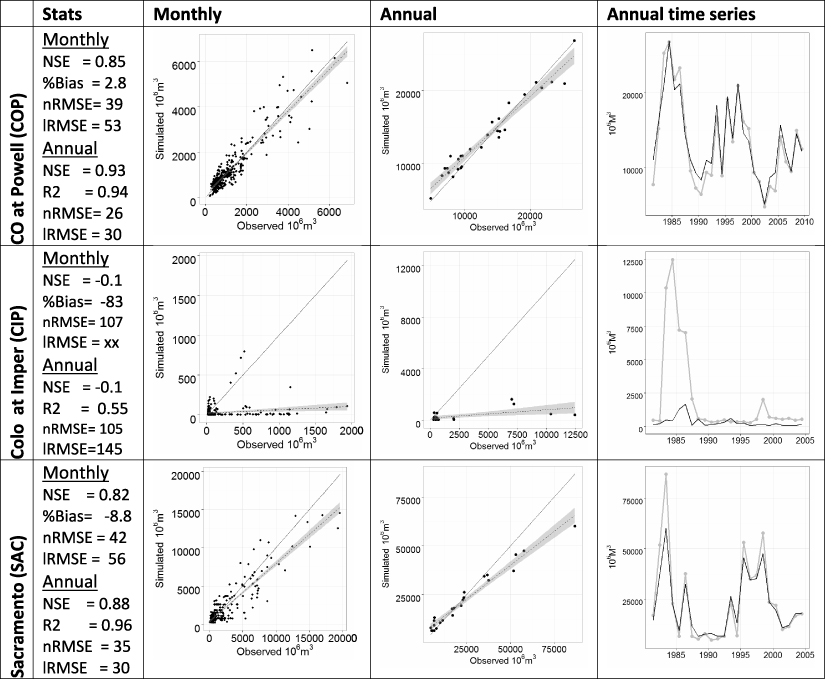
Figure 2. Simulated and observed streamflow at select locations across the southwestern US (see figure 3). Dark lines are the simulated values for annual series. NSE is Nash–Sutcliffe efficiency; nRMSE is the normalized root mean square error; and lRMSE is the log-transformed/normalized root mean square error.
Download figure:
Standard image High-resolution image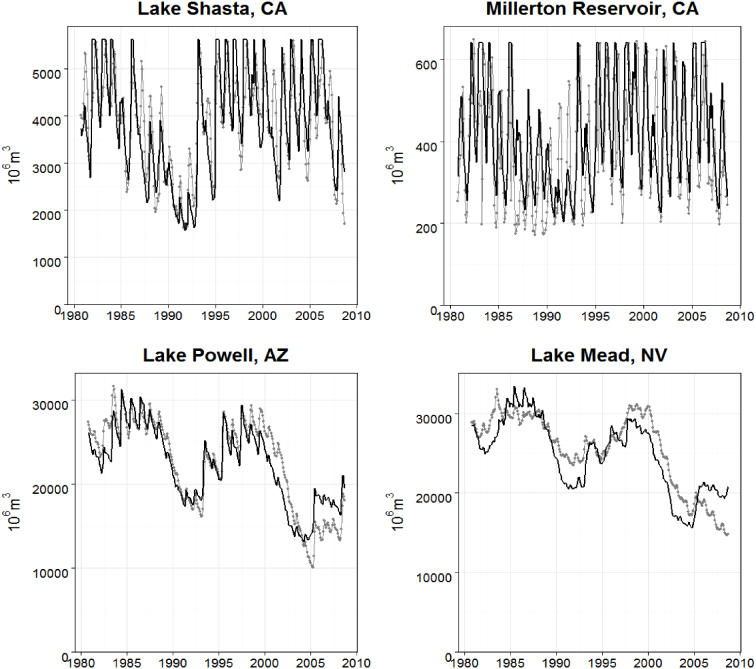
Figure 3. Simulated (dark line) and observed (light line) storage for four select reservoirs.
Download figure:
Standard image High-resolution imageAn important characteristic of the region is the prior appropriation doctrine, which governs how water is used for a majority of the southwest. This legal framework makes water a well-defined property right that is separable from the ownership of the land on which the water is used. A relevant nuances of this system is that it allocates water to rights holders based on priority; rather than distribute water proportionally across all rights holders, in times of shortage, some (those with 'junior' or lower priority rights) lose legal access to water while others (more senior right holders) are not impacted. This system has important implications for how water resource impacts are distributed among water users in the southwestern US.
In the work here, individual water rights are not explicitly modeled; rather WEAP's priority ranking is used to define classes of water users. Senior water rights throughout the southwest are often held by agricultural interests, but there is precedence that these rights are often sold or leased to higher valued uses—most notably the municipal and industrial sector. Therefore, in the WEAP-SW model, the priority ranking is given as: Priority 1: instream flow and water compact requirements, and thermoelectric cooling; Priority 2: urban indoor water; Priority 3: urban outdoor water; Priority 4: irrigated agriculture; and Priority 5: hydropower. With this priority ranking, we have assumed that under water short conditions, municipal and thermoelectric water requirements will be met before irrigated agriculture. Native American water rights are very important and are often first priority rights. We have implicitly included these in some places, for example irrigation use for the Navajo Irrigation Project in northwest New Mexico, while most are included as part of the aggregate demands.
3. A future drought, warming, and water use scenario
The WEAP-SW model makes use of the continental US, monthly climate forcing dataset of Maurer et al (2010) that includes monthly total precipitation and average temperature for the period 1949–2010. Because the WEAP-SW model is forward projecting, we devised a simple strategy to use the observed climate to represent the climate of the future, through simple resequencing of the historic data. The simulation period is 2007–2050, thus the historic climate of 2007–2010 is used for those same years in the future simulation. Then, beginning in the 2011 simulation year, past years were mapped to future years to achieve a consecutive dry-year sequence. The monthly climate of 1997 was used as the monthly climate of 2011; 1998 was used for 2012; and so on. The year 2020 used the monthly climate of 2006. We then wrapped around and used the climate of 1949 as the climate of 2021; 1950 for the year 2022; and finally the year 1977 for the year 2049. This sequence of years leaves much of the southwest in persistent drought throughout the simulation and in a severe drought state at mid-century, as the years 1976 and 1977 are particularly dry throughout the southwest (Rodda and Marsh 2011).
This resequenced climate series represents a dry epoch relative to the historical record, noting that paleo-reconstructed flows from tree-rings suggest periods of much lower streamflow throughout the region compared to both the historic record and our resequenced series (Tarboton 1995, Bureau of Reclamation 2012). Since our climate data is simply a resequencing of observed years, the resulting temperature series is implicit. In addition, we have assumed that the regional average temperature is steadily increasing, with an imposed linear trend that increases the regional temperature by 2.0 °C by 2050. Figure 4 shows the annual precipitation and average annual temperature of the Maurer et al (2010) dataset for the recent period and the future scenario, estimated from all 306 WEAP-SW catchment objects in the study domain.
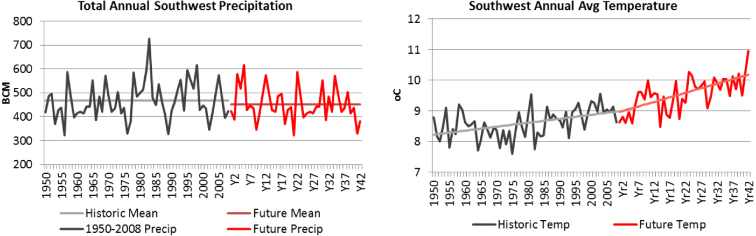
Figure 4. Climate summary for the southwestern US with total annual precipitation (left) and annual average temperature (right) derived from the monthly values of all 306 catchment objects. The climate of the recent past (dark) is included, along with the future climate scenario used for the 42-year simulation period of 2008–2050 (red).
Download figure:
Standard image High-resolution imageMunicipal, commercial, and industrial indoor use (excluding thermoelectric generation) were based on estimates of population and water use per-capita as liters-per-capita-per-day or LPD (gallons-per-capita-per-day or GPD). A value of 265 LPD (70 GPD) was used for residential uses plus an additional 95 LPD (25 GPD) for commercial and industrial indoor use. Some areas were assigned slightly higher per-capita, including the Salt Lake Valley, Phoenix, Las Vegas, and the Los Angeles Basin where an additional 75–115 LPD (20–30 GPD) of indoor use was assumed based on higher estimates from greater industrial or commercial activity or household use estimates (Stitzer et al 2009, Camp, Dresser, and McKee 2004, CDWR 2009, UDWR 2010a, 2010b, ADWR 2008, ConSol 2010).
The population throughout the southwest is assumed to grow from an estimate of 55 million in 2008 to a little more than 100 million by 2050. Growth throughout the region is non-uniform, with the highest annual rate of 2% in Arizona to a low of 1.1% in New Mexico. The annual growth rates in Southern California, Coastal California, and Utah were 1.3%, while central California, Nevada, and Colorado were 1.5%.
3.1. Caveats, limitations, and assumptions
We present the results of this modeling exercise as the implications of electricity mix scenarios for future water resources in the southwestern United States, so the caveats and limitations of the component models extend to our findings. Notable among these, the use of down-scaled ReEDS model output means that we assume no electricity mix optimization for water impacts and no dynamic adjustment of power plant operations in response to water resource conditions. Similarly, the distribution of impacts depends on the specifics of the both physical and institutional settings. The location and characteristics of water withdrawals and return flows have an impact on water availability in time and space, and while our model includes considerable detail about the water systems of the southwest, it is still highly aggregated and simplified. Institutionally, the prior appropriation water rights regime is complex with highly detailed, location specific allocation rules that we are not capturing.
The legal priority system by which water rights are allocated in much of the southwestern United States means that shortages in water supply are not distributed uniformly among users, but rather, junior rights holders can lose access to water while those with more senior right are not impacted. Although in many cases agricultural users are actually the most senior water rights holders, we model that sector as the lowest priority use, reflecting a likely reality of interventions in times of shortage to assure that household and thermoelectric water requirements are met4. There is precedence for this throughout the southwest in water rights sales and leasing from the agricultural sector to higher valued municipal and industrial uses, including thermoelectric cooling (Libecap 2011). Therefore, in this letter, water deliveries to the agricultural sector serve as a proxy for (1) the party that holds a more junior right and are the first to give up their right to use their water in times of shortage; and/or (2) the party that would likely sell that right to a higher valued use.
Therefore, the water rights regime in the WEAP-SW model has been simplified so that thermoelectric cooling water requirements are a top priority, where under water short conditions, irrigated agriculture and urban outdoor water uses are curtailed in favor of higher valued water uses including indoor water use and thermoelectric cooling. Thus, we describe likely water resource impacts of different electricity mix scenarios conditional on water rights not being rigorously implemented on a case-by-case basis. Rather, we've assumed that lower valued uses (i.e. irrigated agriculture) will be shorted before higher valued uses (thermoelectric cooling and municipal indoor water). As such, the results can be interpreted either as a projection of expected future impacts, or, more fruitfully, as a warning of issues that may merit attention to avoid the potential negative impacts we present.
4. Results and discussion
Although this modeling exercise produces a plethora of results, this letter focuses on the water resource implications of the different electricity mix scenarios. We focus on the impacts of these scenarios as propagated throughout the region's water system, capitalizing on the uniquely detailed model of that system, which includes reservoir storage, inter-basin transfers, and differing priorities across different demands for water.
4.1. System-wide vulnerability to climate, population, and the electricity mix scenarios
Current water supply stress, paired with expected population growth in the region, inspires an interest in understanding the vulnerability of the regional water system to further stresses. In this context, vulnerability is used to broadly reflect the conditions in which a water management objective is not met. In our case, this measure is simply the increase or reduction in water delivered under our assumptions of future climate conditions, population, and thermoelectric generation. All five electricity mix scenarios are modeled against a background of a growing population, increasing average air temperatures, and decreasing precipitation.
4.1.1. Reservoir storage and water use in the BAU scenario.
The left-axis of figure 5 shows the total annual volume of water stored in all WEAP-SW modeled reservoirs and the annual water delivered to agriculture for the years 2008–2050, while the right-axis shows the delivered water to the municipal and thermoelectric cooling sectors. We have assumed that most of the increase in urban water demand is from indoor use, with outdoor irrigated acreage held constant due to growing conservation awareness. The general trend of decreasing overall storage can be attributed to the first order effect of the cumulative decrease in surface water supplies due to the drier and warmer climate, and the secondary effects from greater demand for water from a growing population. The final year's total reservoir storage is about 50% less than the first year's storage. Delivered water to agriculture is declining, as the constrained water supply is first used to meet environment constraints, inter-state compacts, thermoelectric cooling demands, then municipal demands. As irrigated acreage is held constant, the slight upward trend in municipal outdoor water use is also due to the steadily warmer and drier climate. There is a decline of nearly 50% in water delivered for thermoelectric cooling under this BAU scenario toward mid-century, primarily due to coal retirement.
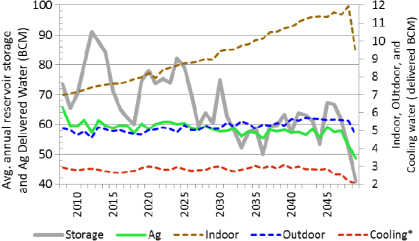
Figure 5. For the BAU scenario, annual average reservoir storage and agriculture water delivered (left y-axis). The right-axis is the indoor and outdoor water and thermoelectric cooling water delivered. *For once-through cooling, we only accounted for water consumed at the plant but not withdrawn.
Download figure:
Standard image High-resolution imageThe sharp decline in municipal and agricultural water deliveries at the end of the simulation is notable. This is largely an artifact of our climate scenario, as Priority 1 constraints including inter-state compacts, instream flow requirements, and power plant cooling force a reduction in delivery to lower priority demands including both indoor and outdoor municipal use. In practice, these reductions in water delivery are implemented as drought restrictions in most southwestern cities and towns (Yates et al 2013). However, we did not model individual drought plans within the WEAP-SW model, rather we took advantage of WEAP's priority-based allocation algorithm to short lower priority users under water-constrained conditions. Because we have made power plant cooling a top priority, any reductions we see for cooling water are first due to reductions in demand due to a less water intensive electric mix and then under the most severe water shortage, reductions in available cooling water. In our future simulation, thermoelectric power plants are only shorted water near the end of the simulation period, when water shortage is severe and system wide. Otherwise, thermoelectric cooling uses are met.
The abrupt, end-of-period reduction in water delivered to all sectors shows that indeed, the chosen climate scenario is quite severe and brings the region into 'water-crisis' by mid-century. This raises the question regarding how quickly the system recovers from this severe state. To test this, the WEAP-SW model was run for the BAU scenario by indexing the climate data by 6 year so that the severe, 2-year drought occurs at different periods throughout the 42-year time series. This resulted in seven ensemble members (EM), where EM1 has the 2-year drought at the beginning of the simulation, EM7 at the end, and the other EMs in between. Figure 6 shows total water use and reservoir storage for all EM's and then highlights EM1 and EM7, to show that the severe drought causes considerable reduction in delivered water and reservoir storage, but that the system recovers and is thus fairly resilient. Regardless of the sequence, the trend in reservoir storage is negative.
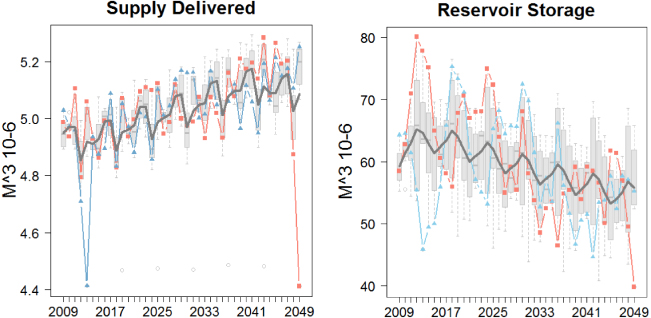
Figure 6. Total supply delivered to all sectors (left) and total reservoir storage (right), where the blue line is ensemble member 1 (EM1), the red is ensemble member 7 (EM7), the dark gray line is the ensemble member mean, and the box-n-whiskers summarize all ensemble members.
Download figure:
Standard image High-resolution image4.1.2. Differences among the electricity mix scenarios.
The remaining analysis was made using the single, EM7 climate sequence. Since we have prescribed that irrigated agriculture will be the first shorted use under water-constrained conditions, we report the total delivered water to this sector and then compare the relative difference among the electric mix scenarios (figure 7). As the drought deepens around 2035, agriculture deliveries increase by nearly 2% annually due to water savings from the reduced demands from the thermoelectric sector. The sharp-drop off in delivered water at the end of the simulation corresponds to the extreme drought conditions, with the relative benefit of the water-conserving electric mix scenarios practically gone. There is little difference between the carbon-constrained scenarios, although the nuclear intensive scenario (CCSNK) is less beneficial in providing additional agricultural water as the drought deepens. The coal intensive, AEO scenario leads to an overall reduction in available irrigation water throughout the simulation period.
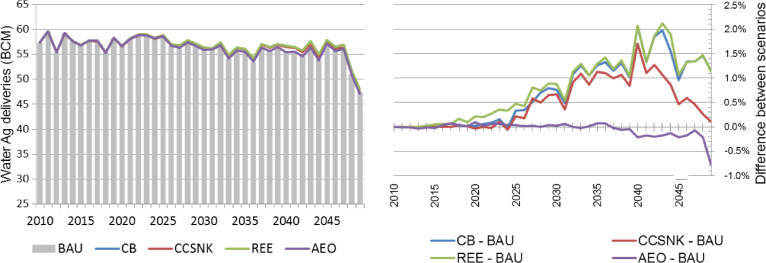
Figure 7. Total water delivered for the different electric mix scenarios (left) and the relative difference among them compared to the BAU scenario (right).
Download figure:
Standard image High-resolution imageFigure 8 depicts the relative difference in combined water storage volumes in Lake Mead and Lake Powell on an annual timescale between the BAU and other electricity mix scenarios. We isolate these two reservoirs because of the dominant role they play in providing the inter-annual storage important to the system's resilience to short and long-term variability in runoff. The figure suggests the extent to which the regional water system's buffering capacity is differentiated across electricity mix scenarios. By focusing on differences among the scenarios, this figure helps isolate the impacts of the electricity mix scenarios from the underlying trends of water stress driven by climate and population. A signal that in any single year is difficult to detect.

Figure 8. Difference in modeled, monthly average volume of water stored in Lake Mead and Lake Powell, between each scenario and the BAU. The CB, CCSNK, and REE scenarios model a carbon budget, and thus follow a similar pattern of increased storage in the later decade relative to the BAU, with the CB and REE nearly identical on the scale shown. The AEO scenario is coal, and thus water intensive.
Download figure:
Standard image High-resolution imageThe impact of the three carbon-constrained scenarios (CB, CCSNK, REE) on reservoir storage volumes is markedly similar. All three become differentiated from the BAU scenario starting about 2020, when the price signal of carbon kicks in and starts leading to retirements of coal facilities. By about 2030 the majority of this effect has already played out. Although the figure depicts monthly storage volumes, these represent cumulative effects because of the carryover of reservoir storage from year to year. After 2030, the differences between the CB, CCSNK, and REE scenarios and the BAU and AEO scenarios stay relatively constant, although the carbon-constrained scenarios appear to converge back toward the BAU scenario, in terms of Mead and Powell storage, in the later, drier years of the model sequence. The CCSNK scenario leads to slightly less storage than the other two carbon-constrained scenarios.
The largest increase in total storage between the scenarios and BAU is about 2.2 billion m3 (BCM) or 1.8 million acre-feet (MAF) and is a substantial difference, particularly in times of water stress. This corresponds to nearly 4% of the storage capacity of these two reservoirs, and more than 13% of the annual average natural flow of the Colorado River. The similar impacts of the CB, CCSNK, and REE scenarios demonstrate flexibility in policies for obtaining similar region-wide water impacts; the carbon budget and its impact on non-CB coal-powered generation in the region is the important driver of the system-wide resilience to water stress. Interestingly, the peak of the 'benefit' from the low-carbon generation is achieved by about 2038. After this year, it is apparent that the low amount of system-wide storage due to greater overall demand combined with the dry climate puts even greater pressure on the water systems of the southwest. After this, even electricity generation adds additional strain on the water resources. The coal intensive scenario (AEO) begins to add additional pressure on the water system around 2035 as it quickly diverges from the carbon-constrained scenarios, and results in an overall decline in total storage of about 6% by 2050.
The impacts on reservoir storage are driven primarily by differences in water consumption among electricity mix scenarios. However, the region's power production is much more dependent on recirculating rather than once-through cooling relative to more water-rich regions, such as the northeastern United States. The common belief is that water consumption of facilities with recirculating cooling is substantially greater than that of once-through cooling facilities. However, once-through systems are often on ponds or lakes, where heat is lost through both thermal transfer and through evaporation in a similar manner to a recirculating system. Thus, consumption among scenarios does not necessarily correspond to differences in water withdrawals. One area in which that difference matters is the utilization of groundwater aquifers, which supply another buffer against water supply stress in the region. Surface water is generally used first before groundwater water, with groundwater constrained to a percentage of withdrawal based on best available current estimates from state data (Yates et al 2013). Thus, while groundwater is considerably tapped in our extended drought scenario, it is constrained.
Although groundwater tends to be a nonrenewable source in many parts of the region, groundwater pumping offers a supplemental water source in some areas with limited surface water supplies. Because anthropogenic groundwater withdrawals typically exceed natural aquifer recharge rates, differing withdrawal rates correspond to differing impacts on the buffering capacity provided by groundwater use.
Figure 9 depicts the differences in cumulative groundwater use between electricity mix scenarios versus that of the BAU scenario and provides another look at the impacts of electricity generation policy choices upon system-wide vulnerability to water stress. Note that groundwater is not necessarily used directly for thermoelectric cooling, rather, the extended dry period forces water users, particularly those in the agricultural sector, to turn to groundwater as their supplemental source. The increased groundwater storage under the carbon-constrained scenarios is thus due to decreased thermoelectric cooling water use, which frees-up surface water for other uses.
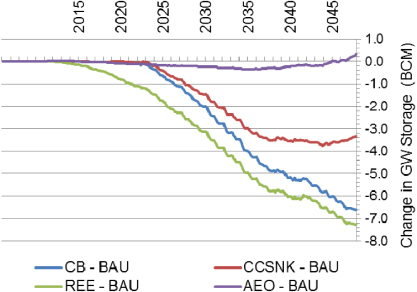
Figure 9. Cumulative difference in net groundwater storage for each scenario versus the reference, measured on a monthly timescale. The CB and REE scenarios experience the largest net difference versus the reference; the CCSNK scenarios ends the period roughly halfway between the other carbon-constrained scenarios and the BAU.
Download figure:
Standard image High-resolution imageAlthough the roughly 7.0 BCM (6 MAF) difference between the CB and REE scenarios and the BAU and AEO scenarios is more than one-third the annual average natural flow of the Colorado River, this corresponds to only about 3% more water withdrawn in the fossil fuel intensive scenarios over the entire 42-year period, for which we model a cumulative groundwater withdrawal of 276 BCM (224 MAF) in the BAU scenario. It is also worth noting that this is likely an overestimate, because we do not model the possible behavioral responses to prolonged aquifer drawdown.
4.2. Examples of localized impacts of electricity mix scenarios
Section 4.1.2 demonstrates that the different electricity mix scenarios correspond to small but clearly observable differences in impacts on system-wide water supplies. However, average, system-wide impacts mask the localized differences that are critically important in the specific context of water use in the region. While the large reservoirs to the west have provided inter-annual storage and enhanced supply reliability in times of extended drought, other southwestern communities rely on the seasonal melting of snow pack to deliver the majority of their surface water supplies. In essence, the snowpack is the reservoir, with trans-continental diversions, smaller reservoirs, and groundwater used to smooth out the natural, but often extreme variability. These systems are likely more susceptible to longer-term drought, as seasonal demands tend to follow the same pattern as seasonal supplies, with agricultural and municipal irrigation, as well as thermoelectric cooling demands, all peaking in the summer. This coincident peaking creates a seasonal potential for conflict between uses and underscores the importance of understanding not just annual supplies and demands but also intra-annual variability. A sample of localized results is offered by highlighting two such regions—the San Juan River in northwest New Mexico, and the South Platte Basin in north-central Colorado.
The San Juan River, New Mexico is shown in figure 10 and reflects how the water system of the region is formulated in the WEAP-SW model. From right to left, are the Navajo Reservoir and the San Juan Chama diversion project; the major Navajo Irrigation project, contained in the H32Niip_2500 catchment object; the indoor (Farmington) and outdoor water demand around Farmington (H33FRM_2500); the thermoelectric demand (PCA31_H33); and an instream flow requirement on the San Juan for maintaining fish flows.

Figure 10. A WEAP-SW screenshot of the San Juan River in northwest New Mexico, with the geographic coordinates of Morgan Lake included in the inset. The red line defines both the state and ReEDS PCA boundaries.
Download figure:
Standard image High-resolution imageThe numbers in parentheses near the objects are their demand priorities, showing thermoelectric cooling and instream flow requirements the highest, with a Priority 1. Irrigated agriculture is primarily for the Navajo Indian Irrigation Project and while they have a 'paramount water claim', it is unqualified. We have assumed that irrigated agriculture has the lowest priority of 5, which will show in shortage, the additional water that could be made available to agriculture or, equivalently, the water taken out of agriculture for higher valued uses. The thermoelectric demand is primarily a 2000 MW, pond cooled, coal fired power plant; which is represented in the WEAP-SW model using a diversion from the San Juan River to Morgan Lake. This plant is owned by the Arizona Public Service, but sits within the boundaries of the Navajo Nation, who supply coal for the plant. Morgan Lake has a capacity of 0.05 BCM (40 000 acre-feet), with the plant cycling the equivalent volume of the lake nearly ten times per month (Bruce Salisbury, Arizona Public Service, Personal Communications). The PCA Region 31 includes additional coal fired generation that is cooled using recirculating technology and is contained in both the PCA31_H32 demand and PCA31_H33 demand objects. We've assumed that the San Juan Chama project has a relatively high demand (Priority 2) as part of the Colorado River Storage Act of 1956 (PL 84-485) and can take 0.14 BCM (0.11 MAF) annually. Here again, the relative use of water for thermoelectric cooling is small compared with other uses, at about 0.06 BCM 0.055 BCM annually (45 000 acre-feet) compared with other uses of about 0.37 BCM (0.30 MAF). Annual water deliveries below the reservoir are dominated by agricultural of about 0.24 BCM (0.21 MAF) annually.
The San Juan River has an average annual and standard deviation of inflow to the Navajo Reservoir of 1.3 BCM (1.05 MAF) and 0.96 BCM (1.2 MAF), respectively; with the reservoir capacity of 2.1 BCM (1.7 MAF). The Animas River, an unregulated tributary to the San Juan below the Navajo Reservoir, adds another 0.68 BCM (0.55 MAF) annually. While current water deliveries are about 0.40 BCM (0.34 MAF) annually, there is authorization of more than 0.6 BCM or nearly half the average annual inflow to Navajo Reservoir.
The result for the Navajo Reservoir follows a similar pattern to Lakes Mead and Powell, except for an extenuated seasonal change from filling and draining within the year. Figure 11 shows the increased storage in the Navajo Reservoir by the end of the simulation period for the carbon-constrained scenarios, which result in about 4% more water stored in the reservoir. Deliveries to the San Juan Chama Project and to the agricultural and municipal uses are nearly identical among the scenarios (not shown), as the reservoir is used to support these uses. This shows that local systems with considerable reservoir storage are more resilient from a water availability perspective. Of course, large reservoirs like Navajo have their own, negative consequences such as land inundation and the impairment of ecological function of the riverine system. As a result of damming of the San Juan River, the razorback sucker (Xyrauchen texanus) and Colorado pikeminnow (Ptychocheilus lucius) are now endangered fish species.

Figure 11. Per cent difference of Navajo reservoir storage for each electricity mix scenario relative to the BAU scenario for the Navajo Reservoir storage under alternative electricity mix scenarios.
Download figure:
Standard image High-resolution imageThe South Platte Basin drains central northeastern Colorado and includes the rapidly growing urban corridor that runs north–south through the center of the state with a population of about 3 million. It includes both large agriculture and industrial sectors, and has substantial thermoelectric generation primarily from both coal and natural gas systems.
Figure 9 shows the WEAP-SW representation of the South Platte Basin, as it extends from Central Colorado, through the rapidly urbanizing corridor that includes Denver, Boulder, Aurora, Fort Collins, and other local municipalities commonly referred to as the Front Range. Historically, about 0.41 BCM (0.33 MAF) has been delivered from Colorado's western slope into the South Platte Basin, which is represented in the WEAP-SW model as two trans-basin diversions (Trans-basin Diversions and ColoBigThom Diversion). The majority of the thermoelectric cooling occurs near the Denver Metropolitan region, while irrigated agriculture is located further downstream, where larger trans-basin diversions occur, most notably the Colorado Big Thompson Project. These geographic differences are important, as changes in thermoelectric water use will have a greater impact on downstream users. In addition to Horsetooth Reservoir, with a capacity of 0.2 BCM (0.16 MAF), the area is characterized by smaller, distributed storage reservoirs, which we have represented in the WEAP-SW using several reservoir objects on the South Platte River. The region includes substantial groundwater irrigation that is tributary and hydrologically connected to the South Platte River that is also included.
A unique characteristic of this region is its lack of substantial over-year water storage, as there simply are not the large reservoirs dedicated to water supply as there are further west in Arizona, Nevada, and Utah; and to a lesser extent, in Utah and New Mexico. Colorado capitalizes on the high elevation of the Rocky Mountains and the corresponding snowmelt and runoff that can extend into late summer as its primary means of water storage. This makes the region particularly vulnerable to warming, especially in the spring and summer, as peak runoff could occur earlier in the spring with reduced flows in the mid and late summer. This could lead to more chronic water shortages during peak demands in the summer, which are concurrent for all water uses, including agriculture, municipal, and thermoelectric.
Figure 13 shows 10-year, monthly average water deliveries for the agricultural and outdoor municipal sectors (top) and monthly average river flows on the Colorado River at Cameo and the South Platte River above Denver (bottom). These were averaged for the BAU scenario, over the periods 2010–2019 and 2040–2049. Seasonal demands drive the overall signal, with the expected pattern of much higher deliveries in summer and almost no deliveries during winter months. Agricultural deliveries increase in the spring when the demand for water is intensified due to warming and more water is available from the early spring melt season. By mid and late summer, less water is available and thus deliveries are reduced to the agriculture sector; while the climatically driven increase in water demand for municipal outdoor water, which has a higher priority than irrigated agriculture, is also reduced but to a lesser extent.
These reduced deliveries are due to decreasing water availability from declining snowpack. The lower elevation watersheds of the east slope of the Rockies show a bigger change, with reductions in the spring peak and late-summer flows of the South Platte above Denver. The changes on the west slope are not as dramatic, as shown by changes in the Colorado River at Cameo, which is on the west slope of Continental Divide and represents a senior water right on the Colorado River system, with the majority of its contributing watershed at high elevation—above 2750 m (9000 ft). This fact is reflected in the modest change in the flow regime at Cameo, with a reduction in the peak and lower mid and late-summer flows. Recall that the domain average temperature increase over the full period (2008–2050) is 2 °C, but the change between these two decadal periods (2010–2019 and 2040–2049) over the Upper Colorado is a more modest 1 °C.
Figure 14 shows for the BAU scenario, the annual delivery of water by sector for the South Platte Basin (dashed line, right-axis), and the per cent change in water delivery to these sectors for the alternative electricity mix scenarios relative to the BAU scenario (colored lines, left-axis).
Population growth drives the increase in indoor water delivery, which with its high priority, is met under all scenarios until around 2040 when reductions are forced to meet thermoelectric and inter-state compact requirements. Outdoor water deliveries decline under the BAU scenario, as pervasive drying forces municipal water restrictions particularly in the Denver-metro portion of the Basin, where trans-basin diversions are smaller and flows smaller. The low-carbon electricity mix scenarios provide a modest 1% increase in outdoor water deliveries. Irrigation occurs further downstream on the South Platte Basin (figure 12), where the influence of reduced thermoelectric use and municipal returns flows are more pronounced, leading to greater relative increases in agricultural deliveries of about 3%–5%.
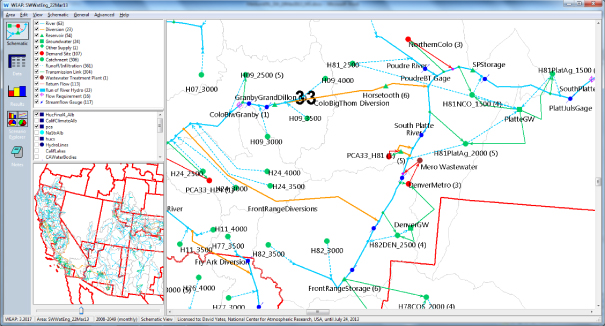
Figure 12. A WEAP-SW screenshot of the South Platte River Basin of Central Colorado. The red line defines a ReEDS PCA boundaries. PCA33_H81 is the demand object that contains the thermoelectric cooling demand for water, and is represented using an off-stream storage object that supplies its water.
Download figure:
Standard image High-resolution image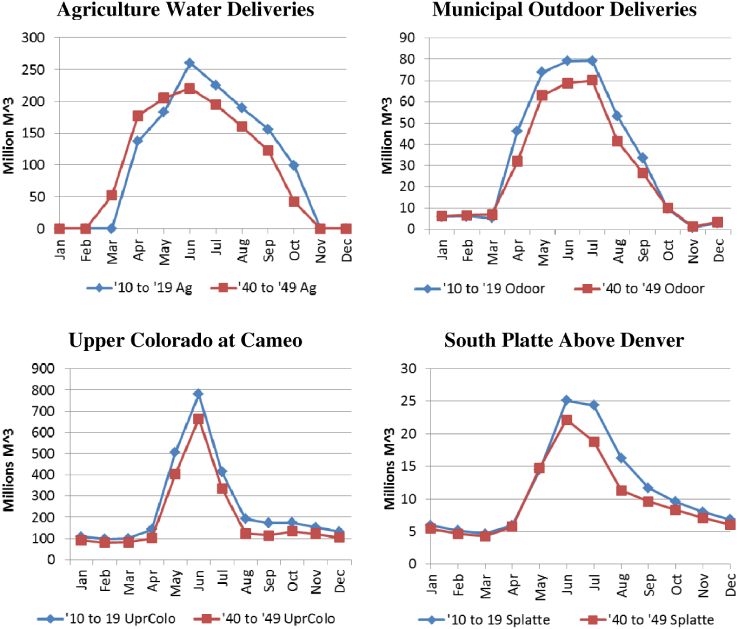
Figure 13. Monthly average water deliveries for agriculture and municipal outdoor uses (top) in the South Platte Basin and the monthly average flows of the Colorado River at Cameo on the west slope of the Continental Divide and the South Platte Basin above Denver.
Download figure:
Standard image High-resolution image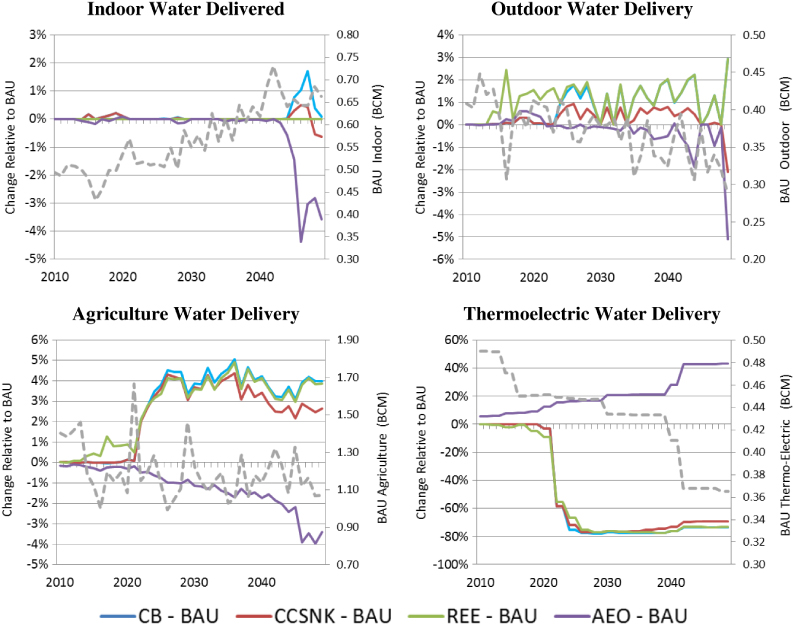
Figure 14. Gray-dotted line is the total annual water delivery for the BAU scenario for municipal indoor (top-left), municipal outdoor (top-right), irrigated agriculture (bottom-left), and thermoelectric cooling (bottom-right) sectors.
Download figure:
Standard image High-resolution image
Despite the differences being relatively small in absolute volumes, they occur in helpful directions on the most important margins, corresponding to additional deliveries when they are most useful for agriculture, because of growing seasons, and for thermoelectric generation, because of increased electricity demands during the summer.
Interestingly, the coal intensive, AEO scenario shows a step-wise increase in thermoelectric cooling water use, and a corresponding decline in water delivered for agriculture and indoor water use around 2040. In contrast, the carbon-constrained scenarios show an increase around this same period. This would suggest there is a threshold, where water availability becomes more constrained in the South Platte Basin and further water conservation would be needed.
5. Conclusions
Substantial capital investments in water infrastructure, including large reservoir and diversion projects over the past century throughout the southwestern US have led to rapid growth. In fact, the southwest has some of the largest and fastest growing cities in the US, which have developed during a period of relatively stable and abundant water supplies. However, one need only peer into the not-to-distant past to realize that hydrologic variability has been much more dramatic. Paleo-flow reconstructions from tree-ring records suggest that there have been long, dry epochs of 40 years or more that are longer and more intense than those observed in the past 100 years. If such an era were to begin today, layered upon a warmer climate, it would severely challenge the socio-economic foundation of the region.
The tightness of water supplies with respect to demands means that even though the power sectors' water use in the southwestern United States is relatively small in absolute terms compared to the water use of other sectors, namely agriculture and municipal use, choices that drive the future electricity mix in the region will impact other water users. At a region-wide level, these choices influence the buffer against further water stress afforded the region through its generous storage capacity in reservoirs. More poignantly, the physical realities and the legal and institutional structures of water use in the region mean that relatively small differences in regional water use across different electricity mix scenarios correspond with more substantial impacts on individual basins and water use sectors. The future electricity mix in the region has important implications on water resources at the local level, both spatially and temporally, with the possibility of different choices either exacerbating or alleviating existing points of water stress.
The BAU and AEO scenarios correspond to continued or increased reliance on fossil-fueled electricity generation, respectively, both lead to greater stress on water storage capacity and on groundwater resources compared to the other three scenarios. Of the three other scenarios, all of which involve the same carbon budget policy, the two with and without a focused increase in renewable energy and energy efficiency (the CB and REE scenarios, respectively) lead to similar carbon and water implications for the region, suggesting flexibility over policies aiming for the same goals in this region. The third carbon budget scenario (scenario 3) leads to water resources impacts somewhat more similar to the reference scenario, despite being driven by an underlying modeling assumption that new nuclear generation will only occur where plants already exist, which is primarily outside the southwestern United States region. Accordingly, development of nuclear-powered electricity generation in new places could lead to substantially different water resource outcomes than those modeled.
Generally, changes in electricity generation technology mix in the region mean a move away from recirculating cooling, which has relatively low water withdrawal requirements but relatively high water consumption requirements. Accordingly, changes in water supplies and the electricity generation technology mix can be anticipated to produce greater impacts to the water available for other users (i.e. the inverse of consumption) than to the water needed for operations (i.e. withdrawal requirements), compared with changes in the electricity generation technology mix in other regions, where other cooling technologies may dominate. In the southwestern United States, different electricity mix scenarios lead to observable differences in impacts on the region's water resources.
Acknowledgments
This work was supported by The Kresge Foundation, Wallace Research Foundation, and Roger and Vicki Sant. We greatly appreciate the support and insight of the Union of Concerned Scientists, the Energy and Water in a Warming World (EW3) contributors, the EW3 Scientific Advisory Committee (Peter Frumhoff, George Hornberger, Robert Jackson, Robin Newmark, Jonathan Overpeck, Brad Udall, and Michael Webber), and particularly Doug Kenney for insight into the regional context. Additional support was provided through the Western Water Assessment and the Cooperative Institute for Research in Environmental Sciences at the University of Colorado Boulder, the Assessment Program at the National Center for Atmospheric Research, and through a NOAA Societal Applications Research Program (SARP) grant (NA10OAR4310186).
Footnotes
- 3
Based on state-level use of groundwater and surface fresh water for CA, NV, UT, CO, AZ, and NM, which sums to approximately 19 800 and 62 400 million gallons per day, respectively.
- 4
For example, in November 2012, Texas's Lower Colorado River Authority sought to restrict water deliveries to agricultural users below the levels required by the state's 2010 Water Management Plan for the second year in a row in response to an ongoing drought in the region (Lower Colorado River Authority 2012).