
Abstract
Soil moisture is an important variable for regulating carbon, water and energy cycles of terrestrial ecosystems. However, numerous inconsistent conclusions have been reported regarding the responses of soil moisture to warming. In this study, we conducted a meta-analysis for examination of the response of soil moisture to experimental warming across global warming sites including several ecosystem types. The results showed that soil moisture decreased in response to warming treatments when compared with control treatments in most ecosystem types. The largest reduction of soil moisture was observed in forests, while intermediate reductions were observed in grassland and cropland, and they were both larger than the reductions observed in shrubland and tundra ecosystems. Increases (or no change) in soil moisture also occurred in some ecosystems. Taken together, these results showed a trend of soil drying in most ecosystems, which may have exerted profound impacts on a variety of terrestrial ecosystem processes as well as feedbacks to the climate system.
Export citation and abstract BibTeX RIS

Content from this work may be used under the terms of the Creative Commons Attribution 3.0 licence. Any further distribution of this work must maintain attribution to the author(s) and the title of the work, journal citation and DOI.
1. Introduction
Soil moisture plays an important role in determining a variety of terrestrial ecosystem structures and functions, and modulating regional climate by impacting both biophysical and biogeochemical processes, including the carbon cycle, water cycle, nitrogen cycle, plant phenology, forest growth, vegetation distribution and microbial activity in decomposition (Rustad et al 2001, Koster et al 2004, Walker et al 2006, Fan et al 2008, Sherry et al 2008, Jung et al 2010, Elmendorf et al 2012, Escolar et al 2012, Schwalm et al 2012). Soil moisture has been found to change substantially with rising global temperatures, and has therefore received increasing interest in recent years (Dai et al 2004, Emmett et al 2004, Dermody et al 2007, Wan et al 2007, Subin et al 2012, Dai 2013, Seager et al 2013).
Numerous studies have shown inconsistent conclusions regarding the effects of experimental warming on soil moisture, with positive (Zavaleta et al 2003, Wang et al 2011), negative (Harte et al 1995, Luo et al 2001, Verburg et al 2005, Xia et al 2010) or neutral effects being observed in various ecosystems (Luo et al 2009a, Li et al 2011). For example, Harte et al (1995) reported that 15 W m−2 downward infrared flux increased summer soil temperature by up to 3 ° C and reduced soil moisture by up to 25% in a montane meadow in Colorado, USA. However, other studies showed opposite conclusions regarding the responses of soil moisture to increased soil temperature. Wang et al (2011) reported that soil water content below 10 cm increased with heating in a desert steppe in Siziwang Banner, Inner Mongolia, China. Similarly, simulated warming in California grassland increased spring soil water content by 5–10% (Zavaleta et al 2003). In addition, when considering factors including precipitation, vegetation, slope and temperature, which could all influence soil water balance, the responses of soil moisture to warming trends are complex and highly variable temporally and spatially (Liancourt et al 2012).
Over the last two decades, as predictions of global warming have become more widely recognized and accepted, the need for information regarding the response of soil moisture to changing temperature has been addressed by a growing number of temperature-manipulation experiments initiated in various ecosystems around the world. Warming experiments have been used to extrapolate future climate conditions on a global scale for many years (Rustad 2008, Aronson and McNulty 2009). Some of the warming experimental sites have long time series and duration (Luo et al 2009b, Xue et al 2011, Xu et al 2012), and it is convenient to study and compare the effects of simulating warming on variations in soil moisture.
In this study, global experimental warming measurements were synthesized to examine responses of soil moisture to experimental warming on a global scale. Specifically, meta-analysis was used to investigate (1) the responses of soil moisture to experimental warming; (2) the extent to which soil moisture is altered by simulating warming; (3) the differences in the response of soil moisture to experimental warming among ecosystem types.
2. Data and methods
2.1. Data collection
In this meta-analysis, we reviewed more than 200 published papers on experimental warming studies recovered from the Web of Science (1980–2013). We selected data according to the following criteria: (1) the studies reported changes in soil moisture in both warming and control groups; (2) the measurements were conducted at least over an entire year; (3) the means, standard deviations of soil moisture and sample sizes were reported or could be calculated. In cases in which no standard errors were reported, we assigned standard deviations that were 1/10 of means (Luo et al 2006). (4) Relevant experimental information was reported, including the mean annual precipitation (MAP), mean annual temperature (MAT), warming methods, increased soil temperature, soil properties, and ecosystem types.
Overall, this study included 41 study sites with 139 paired experimental records for investigation of the response of soil moisture to warming (supplemental table S1, supplemental figure S2, supplemental information S3 available at stacks.iop.org/ERL/8/044027/mmedia). The measurements under different ecosystem managements (i.e., clipping, grazing, etc) or plant communities were considered as independent treatment data. Therefore, the same environmental conditions were maintained for all selected experiments (including rainfall conditions), except for temperature. Moreover, we did another literature research and collected 76 paired records at 31 sites to examine the changes in net primary production (NPP), above-ground net primary production (ANPP), below-ground net primary production (BNPP), leaf area index (LAI) or ecosystem evapotranspiration (ET) in response to warming. Only a few experimental records were collected from the same articles as for soil moisture.
2.2. Statistical analysis
The response ratio (RR, the ratio of the mean value of a concerned variable in warming treatment to that of a control treatment) is used here as an index of the magnitude of experimental warming effects (Hedges et al 1999). An RR value larger than 0, indicates a positive impact of experimental warming on soil moisture with increased soil moisture. The response ratio (RR) was calculated as:

where  and
and  are the mean values of the warming and control groups, respectively.
The variance (ν) was estimated by:
where nt and nc are the sample sizes for the warming and control treatments, respectively, and St and Sc are the standard deviations for the warming and control groups, respectively.
The weighted response ratio (RR++) of each ecosystem type is calculated from the RR of individual pair comparisons between warming and control groups, and the standard errors (S) and weighting factor (wij) are calculated by:
If the 95% confidence interval (95% CI = RR++ ± 1.96S(RR++)) value of RR++ for a variable does not cover zero, the responses of soil moisture to experimental warming differ significantly between the warming and control treatments at a given ecosystem type (Lu et al 2011a, 2011b, Lu et al 2013).
We plotted frequency distributions of RR to display variability among individual studies. The frequency distributions were assumed to follow normal distributions and fitted by a Gaussian function (i.e., normal distribution).
where x is RR, y is the frequency (i.e., number of RR values), a is a coefficient showing the expected number of RR values at x = μ, and μ and σ are the mean and variance of the frequency distributions of RR, respectively. We used a t-test to examine whether the response ratio in the warming treatment was significantly different from that in control. The percentage change of a variable was calculated by the formula: (eRR++ − 1) × 100% (Lu et al 2013).
3. Results
Across all studies, soil surface temperature increased by 1.62 ° C with a range of 0.17–5.52 ° C in response to warming when compared to the control. Warming induced changes in soil moisture showed large variability across studies, ranging from a minimum RR of −0.8109 to a maximum of 0.3276 in all ecosystems (figure 1). On average, experimental warming significantly decreased soil moisture in most ecosystem types, with a decrease of 7.78% being observed in all ecosystems (p < 0.01), 8.50% in grassland (p < 0.01), 11.73% in forest (p < 0.05) and 9.25% in cropland (p < 0.05) (figures 1 and 2; table 1). However, in tundra and shrubland ecosystem types, the effects of warming on soil moisture were insignificant, with a 3.38% decrease occurring in tundra (p = 0.14) and a 1.25% decrease occurring in shrubland (p = 0.48) (figures 1 and 2; table 1).
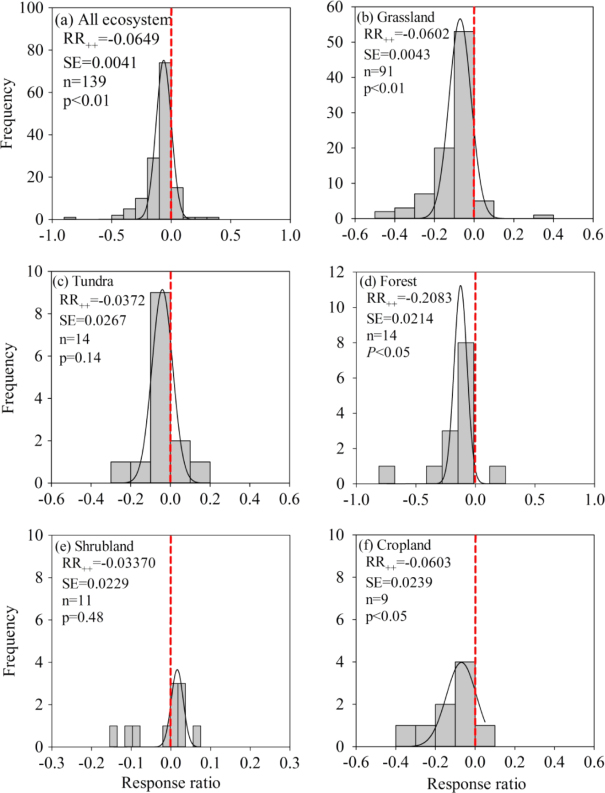
Figure 1. Frequency distributions of response ratios (RR) of soil moisture for all ecosystem (a), grassland (b), tundra (c), forest (d), shrubland (e), and cropland (f). The 'n' is sample size and the solid line is the fitted Gaussian (normal) distribution of frequency data. The x axis is RR and y axis is frequency. The vertical lines are drawn at RR = 0.
Download figure:
Standard image High-resolution image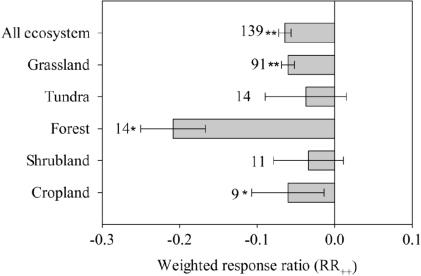
Figure 2. The weighted response ratio (RR++) of those ecosystems responds to simulating warming. The sample size for each ecosystem type is shown next to the bar (*p < 0.05; ∗∗p < 0.01).
Download figure:
Standard image High-resolution imageTable 1. Percentage changes of soil moisture, net primary production (NPP), above-ground NPP (ANPP), below-ground NPP (BNPP), leaf area index (LAI), and ecosystem evapotranspiration (ET) in response to experimental warming. (Note: percentage change was calculated as (eRR++ − 1) × 100%; values are means ± SE.)
| Variable | Percentage change (%) | Sample size (n) |
|---|---|---|
| Soil moisture | ||
| All ecosystem | −7.78 ± 0.91 | 139 |
| Grassland | −8.50 ± 0.99 | 91 |
| Tundra | −3.38 ± 2.37 | 14 |
| Forest | −11.73 ± 4.82 | 14 |
| Shrubland | −1.25 ± 1.62 | 11 |
| Cropland | −9.25 ± 3.79 | 9 |
| Net primary production (NPP) | 3.54 ± 7.59 | 8 |
| Above-ground NPP (ANPP) | 9.80 ± 4.41 | 35 |
| Below-ground NPP (BNPP) | 3.39 ± 8.12 | 12 |
| Leaf area index (LAI) | 20.15 ± 0.06 | 13 |
| Ecosystem evapotranspiration (ET) | 1.67 ± 1.74 | 8 |
We also found a larger decrease of magnitude of soil moisture with elevated soil temperature across all measurements (figure 3(a)). For grassland ecosystems, a majority of the changes in soil volumetric water were negative with increasing soil temperature after removing interference of data (i.e., clipping, grazing; figure 3(b)). Similarly, the response ratios were significantly correlated with elevating soil temperature in all studies (R2 = 0.14,p < 0.01) and grassland without grazing/or clipping (R2 = 0.12,p < 0.01) (figures 3(c) and (d)).
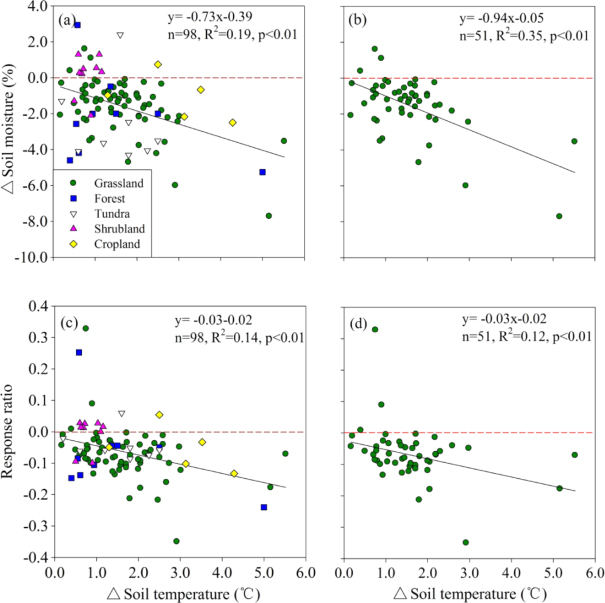
Figure 3. The changes of soil moisture with elevating temperature in different ecosystem (a) and grassland ecosystem without grazing and clipping (b), the changes of response ratio (RR) with elevating temperature in different ecosystem (c) and grassland ecosystem without grazing and clipping (d) in this meta-analysis study.
Download figure:
Standard image High-resolution imageMoreover, we analyzed the responses of vegetation production (NPP: net primary production; ANPP: above-ground NPP; BNPP: below-ground NPP), leaf are a index (LAI) and ecosystem evapotranspiration (ET) to experimental warming. Our results showed that warming stimulated NPP by 3.54%, ANPP by 9.80% and BNPP by 3.39% (figures 4(a)–(c); table 1). Due to the limited dataset of leaf area index (LAI) and ecosystem evapotranspiration (ET) data, we only obtained 13 and 8 paired measurements of LAI and ET, respectively, which covers a few ecosystem types (figures 4(d) and (e)). LAI increased in tundra (p < 0.05), but showed insignificant changes in shrubland under warming conditions (figure 4(d); p = 0.21). Warming stimulated ET by 1.67% in grasslands (figure 4(e), p < 0.05).

Figure 4. The weighted response ratio (RR++) for the response to experimental warming of five variables related to the soil moisture: (a) net primary production (NPP); (b) above-ground NPP (ANPP); (c) below-ground NPP (BNPP); (d) leaf area index (LAI); (e) ecosystem evapotranspiration (ET). Bars represent RR++ and 95% confidence intervals. The sample size for each variable is shown next to the bar. The vertical lines are drawn at RR = 0 (*p < 0.05).
Download figure:
Standard image High-resolution image
4. Discussion
4.1. Responses of soil moisture to warming
Our results showed significant negative effects of experimental warming on soil moisture in most study sites. The overall responses of soil moisture to warming decreased significantly from 8.50% to 11.73% in forest, grassland and cropland (figure 1, table 1). The negative responses of soil moisture to warming conditions could be attributed to the enhanced plant growth and transpiration processes (Wan et al 2002, Xia et al 2010). Evaporation from the soil surface and transpiration by plants are major avenues of water loss from the soil reservoir (Chapin et al 2002). Previous studies have showed that warming can alter plant phenology, leading to changes such as earlier flowering and leafing (Wolkovich et al 2012), increased height and cover of plants (Walker et al 2006), and prolonged growing season (Sherry et al 2007), which may enhance plant growth and eventually increase losses of water from plant transpiration (Xia et al 2010).
Experimental warming stimulated plant growth from both above- and below-ground NPP, leading to increased NPP (figures 4(a)–(c); table 1). Our synthesized results are consistent with those from other meta-analyses that focused on the response of above-ground plant growth to warming (Rustad et al 2001, Lin et al 2010, Wu et al 2011). For example, the latest study indicated that plant growth (NPP, ANPP and BNPP) was enhanced under warming conditions in 16 experimental samples (Lu et al 2013).
The warming induced significant increase LAI in tundra, while shows insignificant changes in shrubland (figures 4(d) and (e)). Previous studies supported our conclusion over various regions. A meta-analysis showed that warming increased plant height and cover at 11 sites across the tundra biome (Walker et al 2006). Another study showed that warming treatment increased the effective green leaf area index (green LAI) at most sites from six European shrublands located along a north–south climatic gradient (Mänd et al 2010). An increased LAI will strengthen plant transpiration and eventually exacerbate the losses of soil moisture with warming.
4.2. Different responses across ecosystem types
The responses of soil moisture to warming may differ considerably among ecosystem types. The results obtained in this synthesis show that experimental warming significantly decreased soil moisture in forests, grasslands and croplands (p < 0.05; figures 1(b), (d), (f) and 2), while the warming induced soil moisture was insignificant in tundra and shrubland (p > 0.05; figures 1(c), (e) and figure 2). Although the weighted response ratio (RR++) of tundra was negative, decreases of soil moisture were not significant (figure 1(c)), owing to changes in surface hydrology induced by warming. In general, tundra ecosystems are located at high latitude regions, where permafrost thaw is an important source of soil moisture in addition to precipitation. Experimental warming may accelerate permafrost melting, leading to increases in soil moisture (Natali et al 2011).
An insignificant decrease in soil moisture was also found in shrublands. More than half of shrubland sites showed increased soil moisture under warming treatments; however, it should be noted that the increase was very low (figure 1(e)). According to previous studies, increases in soil moisture in response to experimental warming were not significant when compared with control treatments (Beier et al 2004). Several studies have reported that warming decreased soil moisture via enhanced plant growth, as indicated by increasing shrub growth and biomass with experimental warming (Klein et al 2007, Peñuelas et al 2007, Mänd et al 2010). Due to the limited experimental data available for shrubland ecosystems, the current meta-analysis can not reflect comprehensive responses of soil moisture. Accordingly, this analysis should be repeated when more experimental data are available.
4.3. Factors influencing the response of soil moisture to warming
Environmental (e.g., mean annual temperature and mean annual precipitation) and ecosystem management (e.g., clipping, grazing) may potentially influence the responses of soil moisture to experimental warming since we extracted data from diverse manipulative experiments at a global scale. Ecosystem management (e.g., clipping or grazing) may indirectly accentuate soil water evaporation by reducing shading of the soil surface, which may in turn lead to large decreases in soil moisture (Xue et al 2011). When compared with the results of a ten years warming study, decreases in soil moisture were larger in clipped than unclipped plots with warming in a grassland in Oklahoma, USA (Luo et al 2009b, Xu et al 2012). The topography (e.g., slope) also indirectly impacts soil water evaporation through different plant cover and species composition (Liancourt et al 2012). Analyses revealed that the soil drying rate was faster on the drier upper slope or with vegetation and faster overall in drier years under warming conditions (Liancourt et al 2012). Moreover, vegetation can not only increase soil drying through plant transpiration, but also by bringing water up from deeper soil layers (Horton and Hart 1998), which may further desiccate deeper soil layers.
Moreover, warming induced phenology changes will strongly influence soil moisture response. In a previously conducted 2-year field experiment, simulated warming increased soil moisture by 5–10% during the end of the growing season (Zavaleta et al 2003). Analyses found that warming accelerated the decline of canopy greenness (normalized difference vegetation index) each spring by 11–16% by inducing earlier plant senescence. Lower transpiration losses resulting from the earlier senescence provide a possible mechanism for the unexpected increases in soil moisture.
4.4. Impacts of soil moisture changes
As an important variable for terrestrial ecosystem structure and function, soil moisture will undergo substantial changes in response to warming, significantly influencing biogeochemical and biogeography processes as well as climate systems (Dai et al 2004, Asharaf et al 2012). Our results showed significantly decreased trends of soil moisture in most ecosystem types (i.e., forest, grassland and cropland), which will result in profound impacts of the vegetation production. Numerous studies showed that soil drying will restrict the plant growth in water-limited ecosystem (Austin and Sala 2002, Schenk and Jackson 2002, Yuan et al 2007). A global analysis employing monthly data records from 238 micrometeorological tower sites distributed globally across 11 biomes revealed that vegetation production was 50% more sensitive to drought than ecosystem respiration (Schwalm et al 2012). Moreover, with decreasing soil moisture, plants will alter their carbon allocation strategy, promoting allocation of photosynthetic product to the root and decreasing its allocation to the stems and leaves (Schenk and Jackson 2002, Mokany et al 2006). More roots may bring water up from deeper soil layers (Horton and Hart 1998), leading to soil drying at deeper soil layers (Shaver et al 2000).
The impacts of soil drying on soil carbon showed large uncertainty (Falloon et al 2011). Laboratory studies and field observations suggest that soil respiration is low under dry conditions, reaches the maximal rate in intermediate soil moisture levels, and decreases at high soil moisture content when anaerobic conditions prevail to depress aerobic microbial activity (Luo and Zhou 2010). Therefore, in humid regions, soil drying alone appears to increase soil respiration and result in soil carbon losses (Smith et al 2005). On contrary, in arid and semi-arid regions, soil moisture changes alone appear to have acted to increase soil carbon storage. This was presumably because drying generally acts to increase soil carbon storage by reducing the respiration rate (Falloon et al 2011).
Soil moisture modulates the land surface energy balances by changing the land surface characteristics and energy components (Chapin et al 2002). Changes in soil moisture can alter land surface albedo and soil thermal capacity (Wang et al 2005). In general, both albedo and emissivity of dry soil are larger, which decreases absorbed shortwave radiation and increases emitted long wave radiation, respectively, leading to local energy reduction (Chapin et al 2002). Therefore, the present study highlights the importance of the responses of soil moisture to warming; however, further investigations simulating soil moisture coupling with the responses of other climate variables to climate change are necessary.
5. Summary
Our findings illustrate the strong impacts of global warming on soil moisture in several terrestrial ecosystems. In forests, grasslands and croplands, experimental warming increased ecosystem evapotranspiration. Moreover, positive responses of soil moisture to experimental warming were observed at several study sites, especially tundras and shrublands. Specifically, permafrost thaw resulting from warming of tundra areas was found to be major resources increasing soil moisture. Overall, our results demonstrate that understanding the response of warming is critical to predicting the dynamics of ecosystem structure and function, which are directly linked to regional climate systems.
Acknowledgments
This study was supported by the National Science Foundation for Excellent Young Scholars of China (41322005), National Natural Science Foundation of China (41201078), the Freedom Project (No. SKLCS-ZZ-2012-02-02) of the State Key Laboratory of Cryospheric Sciences, Cold and Arid Regions Environmental and Engineering Research Institute, Chinese Academy of Sciences, Program for New Century Excellent Talents in University (NCET-12-0060) and the Fundamental Research Funds for the Central Universities.