
Abstract
To determine the role of grazing on CO2 fluxes in a desert steppe, we used paired eddy-covariance systems to measure the net ecosystem exchange (NEE) and microclimate on adjacent pastures of grazed (GS) and ungrazed (FS) steppes on the Mongolian Plateau from 2010 to 2011. The first year was an average precipitation year, while the second year was a dry year. In 2010, there was 91% greater growing seasonal gross ecosystem production (GEP) and 55% greater ecosystem respiration (Re) in the GS than in the FS. As a result, the GS acted as a net carbon uptake of −20 g C m−2 while the FS was a small net carbon release of 10 g C m−2. The greater GEP was mainly caused by the greater photosynthetic capacity due to the suitable environmental conditions and longer growing time in a day and in the growing period accompanied by the enhanced Re that seemed to be responsible for the increased NEE, which compensated for the lower leaf area in the GS. However, an inverse trend was detected in 2011. The seasonal cumulative GEP, Re and NEE were characterized with 92% greater GEP and similar Re in the FS compared with the GS. As a result, the FS acted as a small net carbon uptake of −5 g C m−2, while the GS was a net carbon release of 59 g C m−2. Although the GS had greater carbon uptake in 2010, the variation of daily NEE from both years was lower in the FS, suggesting that the FS has a greater resistance to the changing climate. This also means that future modeling effort should consider year-to-year differences in the carbon balance because relationships between fluxes and climatic regulators change annually in different land use change scenarios.
Export citation and abstract BibTeX RIS

Content from this work may be used under the terms of the Creative Commons Attribution 3.0 licence. Any further distribution of this work must maintain attribution to the author(s) and the title of the work, journal citation and DOI.
1. Introduction
It is well known that land use and the associated management practices affect the ecosystem carbon budget, nutrient cycling, sustainability of ecosystems, and regional climates (Foley et al 2005, Groisman et al 2009, Tan et al 2009). Coupling the land use and climate changes would complicate the underlying mechanisms responsible for ecosystem functions such as carbon production and evapotranspiration (Chen et al 2004, Kato and Tang 2008, Yi et al 2010). Our knowledge on the coupling effects of management and changing climate is continuously needed to develop future management for the mitigation of and adaptation to this climate change (Prescher et al 2010, Zeeman et al 2010, Niu et al 2011).
Grazing is the most ubiquitous land use practice in grassland ecosystems (Polley et al 2008). Global carbon cycles in grasslands are important components of terrestrial surfaces as they comprise approximately 40% of the world's area (Yi et al 2012). The desert steppe, located in the semi-arid region of the European–Asian mid-latitude grassland, is a transitional type that connects the desert and the typical steppe, which is very sensitive to the global climate change, especially on the Mongolian Plateau (IPCC 2007, Qi et al 2012). Here, grazing has substantially modified the canopy structure and the energy balance, resulting in different microclimates such as soil temperature and water (Wan et al 2002, Klein et al 2005, Shao et al 2012). These changes, in return, would alter the magnitude and temporal changes of carbon uptake and emission (Owensby et al 2006, Polley et al 2008). Quantifying the carbon dioxide emission and uptake of grazed and ungrazed desert steppes, therefore, is an essential step for understanding the roles of semi-arid temperate grasslands in global climate change (Wang et al 2005).
Direct effects of grazing on the magnitude, direction, and changes over time of net ecosystem exchange (NEE) in grazed and ungrazed grasslands are difficult to measure because of variable grazing practices at any study site (e.g., within the footprint of a flux tower) and a lack of comparable sites (e.g., similar soil, microclimate; Owensby et al 2006). Meanwhile, quantitative knowledge on how disturbances and changing climate can jointly alter carbon fluxes at broader spatial landscapes is needed to parameterize regional models for predicting carbon sequestration (Yuan et al 2010). Currently, there are several coordinated networks aiming at the direct measurements of fluxes of carbon, water and energy (e.g., FLUXNET, USCCC, etc). However, few have been established at actively managed grasslands (Kato and Tang 2008), preventing us from accessing adequate data for direct assessment of the disturbance effects and estimates of model parameters. Based on our literature review, it seems that few studies focused on the NEE of grasslands under different disturbances but the same environment, which is often needed for model parameterization.
The study objectives of this investigation are to: (1) quantify and compare the daily, monthly, and seasonal variations in NEE and its major components, including ecosystem respiration (Re) and gross ecosystem production between the grazed and ungrazed desert steppe, (2) investigate the response of NEE, Re, and GEP to the most relevant biophysical factors at the two ecosystems, and (3) examine the role of disturbances in the above regulations. We hypothesized that NEE would decrease with grazing, driven by greater decreases in GEP than elevated Re, because grazing will reduce aboveground green biomass. We predict that GEP will have a direct response to the changes in canopy structure and green biomass, whereas Re would remain relatively constant in the absence of major changes in carbon input and will be primarily driven by altered soil temperature and water.
2. Materials and methods
2.1. Study site
Our study site is a Stipa breviflora desert steppe on the Mongolian Plateau, at the Siziwang Experimental Station of the Inner Mongolia Academy of Agricultural and Animal Husbandry Sciences. The region belongs to the mid-temperate zone and has a distinct continental climate. Winters (November–late April) are cold, dry and windy. The spring season, from later April or early May to June, is generally windy and dry. Summers (June–September) are warm and relatively rainy. The long-term mean annual air temperature of the region is 6.7 ° C, with the highest monthly mean temperature in July (22.6 ° C) and the lowest in January (−11.6 ° C, average of 1971–2000). The mean annual rainfall is 180 mm but varies from one year to another with strong seasonal variability (up to 60% variation). Frequent droughts are usually the limiting factor for plant growth.
The fetch for the ungrazed fenced steppe (FS, 41.786 73° N, 111.890 95° E), which was fenced in June 2004, was 500 m2 × 100 m2, and the free-grazed steppe (GS, 41.790 22° N, 111.897 09° E) was more than 500 m in all directions. The GS was grazed (stocking rate: <1.82 sheep unit ha−1 half-yr−1) under collective sheep grazing for over 30 years, which represents a common grazing intensity for the region. Using a footprint analysis following Stannard (1997), equation (18), p 382, under their atmospheric neutral stability assumption, we found that approximately 94% and 98% of the measured scalar fluxes originated from the FS and GS towers, respectively. Both the FS and GS have relatively homogeneous vegetation, dominated by Stipa breviflora (>85%), a perennial bunchgrass. The soil is a light-colored Chernozemic soil (Chinese System of Soil Classification 2001) and equivalent to Cryolls (USDA Soil Classification System, Lin et al 2010). The mean ± SD of soil organic carbon (SOC) in the 0–0.1 m layer are (14.25 ± 0.77) and (14.03 ± 0.64) g kg−1 for the FS and GS, respectively.
2.2. Flux and micrometeorological measurements
Eddy-covariance (EC) towers with affiliated sensors were installed to measure the carbon dioxide (CO2), latent heat (LE), and sensible heat (H) fluxes at 2.0 m above the ground. The open-path EC system consists of an infrared gas analyzer (IRGA, Model LI-7500, LI-COR, Lincoln, NE, USA) and a CSAT3 three-dimensional sonic anemometer (Campbell Scientific Inc. CSI, Logan, UT, USA). The signals of wind speed and gas concentration were sampled at 10 Hz. The IRGA was calibrated before the field setup and growing season in each year. Micrometeorological variables measured on each tower included photosynthetically active radiation (PAR) (LI-190, LI-COR), net radiation (Rn) (Q7.1, REBS, CSI), relative humidity (RH), and air temperature (Ta) (HMP45C, CSI) mounted 2.0 m above the ground. Rainfall was measured continuously by two tipping bucket rain gauges (TE-525, CSI). For each site, soil temperature (Ts) was measured at 0.05 and 0.1 m with CS107 (CSI). The top 0.3 m averaged volumetric soil water content (SWC) was measured using a vertically inserted CS616 (CSI) time domain reflectometer (TDR). Soil heat flux (G) was measured at three locations using heat flux plates (model HFT3.1, CSI) buried 0.02 m below the ground surface, a method reducing the soil heat flux errors (Heusinkveld et al 2004). Instrument maintenance was performed weekly and the online-computed half-hourly mean scalar fluxes and other micrometeorological data, with the raw data, were recorded by a CR5000 datalogger (CSI).
2.3. Energy balance closure
The overall performance of the eddy flux measurement system was evaluated by the energy balance closure (EBC). EBC was calculated on a half-hourly scale through a linear regression between the sum of latent heat (LE) and sensible heat (H) fluxes and the difference between net radiation (Rn) and soil heat flux (G):

where i and k are the intercept and slope, respectively. All of the good data (see below) during the growing season were used. The i, k, and coefficient of determination (r2) were 8.53 W m−2, 0.70 and 0.94 for the FS, respectively, and 6.37 W m−2, 0.77 and 0.92 for the GS, suggesting that the eddy-covariance measurements underestimated (H + LE) by 30% and 23%, for the FS and GS, respectively. The EBC was better in 2011 than in 2010 with the k was 0.78 for the FS and 0.82 for the GS, and both of the 2 years were within the normal range found in most studies (e.g., Wilson et al 2002).
2.4. QA/QC and gap filling
The raw data from the EC systems were processed offline using the EC_Processor (http://research.eeescience.utoledo.edu/ lees/ECP/ECP.html). The planar fit coordinate procedure was performed using the mean wind records of the entire growing season (May–October) or non-growing season (November–April) in each year. The turbulent fluxes were adjusted for fluctuations in air density using the Webb–Pearman–Leuning expression (Webb et al 1980).
A series of data quality controls were conducted through modifications of the EC_Processor and data gap-filling strategy (Noormets et al 2007, 2008, 2010). Data quality was first assessed by atmospheric stability and flux stationarity during periods of well-developed turbulence; obvious outliers were removed when the half-hourly: (1) CO2 flux changes were >20 μmol m−2 s−1, (2) LE > 800 W m−2 or LE <− 200 W m−2, and (3) H > 800 W m−2 or H <− 200 W m−2. With the above quality controls and the remaining data coverage (i.e., good data) was 48% and 42% for the FS and GS, respectively. The data gaps were primarily caused by long periods of dew and rainfall, poor fetch direction (e.g., exclusion of data from the ±15° in lee of sonic anemometer), and poorly developed turbulence (u* < 0.10 m s−1). The 'good data' were then submitted for gap-filling and flux-partitioning procedures. The partitioning of NEE into Re and GEP was performed according to Reichstein et al (2005): the 30 min NEE of CO2 gaps were filled using (Michaelis and Menten 1913, Falge et al 2001):

where α(μmol CO2 μmol−1 PAR) is the apparent quantum yield or the initial slope of the light response curve, PAR unit is μmol m−2 s−1,NEEmax (μmol CO2 m−2 s−1) is the maximum apparent photosynthetic capacity of the canopy, and Re day (μmol CO2 m−2 s−1) is the bulk Re during the daytime derived from the relationship between soil temperature and nighttime NEE. The nighttime NEE was first parameterized with a traditional Q10 model using only the nighttime good data (nighttime conditions are defined by PAR < 4 μmol m−2 s−1 and time before sunrise or after sunset) to fit the nighttime half-hourly soil temperature at 50 mm depth as described by Lloyd and Taylor (1994) and Falge et al (2001):

where a and b are the regression coefficients, and a is the nighttime NEE when soil temperature is 0 ° C. The respiration temperature sensitivity coefficient (Q10) was determined as:

We used one-month NEE to evaluate Q10. By convention, positive values of NEE indicate a CO2 source to the atmosphere and the negative values indicate a CO2 sink by the ecosystem. Because Re is positive, GEP was calculated as GEP = Re−NEE.
2.5. Biophysical regulations
To isolate the vegetation effects on biophysical regulations of C fluxes, we divided the dataset into 2 years: the first year from 15 May 2010 to 14 May 2011 and the second year from 1 January through 31 December 2011 and we defined two growing seasons: the first from 15 May to 31 October 2010 and the second from 1 May to 31 October 2011. In order to detect annual C fluxes and the biophysical regulation differences between the FS and GS, we also subjectively selected the active growth period (9 August–6 September, DOY 221–249) in early summer of 2010 to analyze the following effects. We used non-gap-filled data at both sites to examine the influences of physical conditions: three levels of Ta (Ta ≤ 15 °C,15 °C < Ta = 25 °C, and Ta > 25 °C), SWC (SWC ≤ 10%,10% < SWC ≤ 14%, and SWC > 14%), and water vapor pressure deficit (VPD ≤ 1 kPa,1 kPa < VPD ≤ 2 kPa, and VPD > 2 kPa). For each of the aforementioned levels, the NEE values were grouped by PAR at 100 μmol m−2 s−1 intervals ranging from 0 to 2100 μmol m−2 s−1. The NEE was then averaged for each PAR level (Falge et al 2001, Li et al 2005, Zhang et al 2007).
All of the statistical analyses and the EC_Processor procedure were performed by the SAS software package (version 9.0).
3. Results
3.1. Microclimatic and biotic environment
The net radiation (Rn), soil heat flux (G), air temperature (Ta), soil temperature (Ts), water vapor pressure deficit (VPD), and photosynthetic active radiation (PAR) showed a unimodal shape at both FS and GS from a yearly perspective, with differences between the two sites and the study years (figure 1). For the 2010 growing season, the daily mean Ts at 100 mm depth was 17.72 and 18.15 ° C, daytime Ts was 18.50 and 19.41 ° C, and nighttime Ts was 16.95 and 16.88 ° C at FS and GS, respectively. The VPD was greater at FS than that at GS (1.16 and 1.11 kPa, respectively) with a 15% difference in July (figure 1(f)). In 2011, for the whole year, the daily mean Ts was 6.68 and 6.60 ° C, and the daily mean Ta was 3.30 and 3.04 ° C at FS and GS, respectively. The seasonal variations of soil volumetric water content (SWC, figure 1(e)) showed strong correspondence to the rain events (figure 1(g)) throughout the growing season and the mean SWC was lower at FS than GS. The rainfall events showed clear monthly variability, in the first growing season with 28, 39, 67, 71 and 19 mm from June through October. Most rainfall events were recorded late in the growing season (late August and September) that was outside of the critical plant development in June and July. In the second growing season, rainfall events of 19, 52, 25, 33 and 9 mm were from June through October. The rainfall was 40% lower in the second growing season than the first one. In the summer of 2010, the peak PAR, Ta and Ts values were recorded in June and July but in August and September for precipitation—a mismatch of water and energy resources for the steppes.

Figure 1. Monthly change in daily net radiation (Rn,MJ m−2 d−1, (a)), soil heat flux at 0.02 m depth (G,MJ m−2 d−1, (b)), air temperature at 2 m height (Ta, ° C, (c)), soil temperature at 0.05 m depth (Ts, ° C, (d)), soil volumetric water content at 0–0.3 m depth (SWC, %, (e)), vapor pressure deficit (VPD, kPa, (f)), rainfall (mm, (g)), and photosynthetically active radiation (PAR, mol m−2 d−1, (h)) for the fenced and grazed desert steppes in Siziwang, 2010–2011.
Download figure:
Standard image High-resolution imageThe changes in green net primary productivity (GNPP) of the FS and GS were bimodal for both years, likely because the plant growth was depressed by the severe droughts in June and July of 2010 and less rainfall in August of 2011 (figure 2). In 2010, the maximum GNPP was (117.9 ± 12.3) g m−2 for FS in early September and (81.3 ± 7.5) g m−2 for GS in mid-September. The mean dead standing and litter biomass was (8.10 ± 5.52) and (8.13 ± 4.57) g m−2 for FS, and for GS was (3.01 ± 1.32) and (3.33 ± 0.80) g m−2, respectively. Canopy height and cover of the FS during the peak biomass period was threefold and twice of GS (P < 0.05). In 2011, the maximum GNPP was found in late August at (64.6 ± 6.0) g m−2 for FS and (27.6 ± 7.0) g m−2 for GS, which was less than those in 2010, especially in GS.

Figure 2. Seasonal variations of green biomass in the fenced and grazed desert steppes in 2010 and 2011.
Download figure:
Standard image High-resolution image3.2. Biophysical regulation of NEE
3.2.1. Daytime NEE responses to PAR, Ta, SWC, VPD.
To understand how grazing affects biophysical regulation of NEE, and why the C absorption ability was greater in GS than in FS in 2010 (see below), the active growth period (figure 3, table 1) of daytime NEE was subjectively selected in 2010 to examine its relationship with PAR under different Ta, SWC, and VPD conditions. The active growth period gave a clear difference between GS and FS. Overall, NEE increased with PAR but leveled off or decreased as PAR exceeded the saturation point (i.e., NEEmax) at ∼1200–1400 μmol m−2 s−1. The mean light saturation point was ∼1150 μmol m−2 s−1 for FS and 1300 μmol m−2 s−1 for GS; the NEEmax was −2.11 and −3.07 μmol CO2 m−2 s−1, respectively.

Figure 3. Daytime NEE light response curves under different air temperature (Ta, ° C), volumetric soil water content (SWC, %), and vapor pressure deficit (VPD, kPa) levels during the vegetation active periods of DOY 221–249 in the fenced and grazed steppes in 2010. Equation (2) was used to fit the data and the regression coefficients are presented in table 1.
Download figure:
Standard image High-resolution imageTable 1. Estimated coefficients describing the rectangular hyperbolic responses of daytime NEE to incident PAR (equation (2)) under different air temperature (Ta), soil water content (SWC), and vapor pressure deficit (VPD) levels in the fenced steppe (FS) and grazed steppe (GS).
| Variable range | NEEmax (μmol CO2 m−2 s−1) | Reday (μmol CO2 m−2 s−1) | α (μmol μmol−1) | r2 | ||||
|---|---|---|---|---|---|---|---|---|
| FS | GS | FS | GS | FS | GS | FS | GS | |
| Ta ≤ 15 °C | −4.77 ± 0.28 | −7.41 ± 0.33 | 1.18 ± 0.35 | 1.31 ± 0.34 | −0.012 ± 0.002 | −0.016 ± 0.003 | 0.98 | 0.99 |
| 15 °C < Ta ≤ 25 °C | −4.99 ± 1.65 | −6.96 ± 0.99 | 2.34 ± 1.94 | 2.28 ± 1.39 | −0.025 ± 0.009 | −0.017 ± 0.004 | 0.71 | 0.80 |
| Ta > 25 °C | −3.42 ± 0.42 | −4.25 ± 0.46 | 1.07 ± 0.49 | 0.78 ± 0.57 | −0.016 ± 0.005 | −0.013 ± 0.003 | 0.21 | 0.18 |
| SWC ≤ 10% | −0.4 ± 0.45 | — | −0.88 ± 0.28 | — | 0.0002 ± 0.001 | — | 0.55 | — |
| 10% < SWC ≤ 14% | −4.41 ± 2.86 | −2.92 ± 2.16 | 2.55 ± 3.01 | 1.04 ± 2.51 | −0.0473 ± 0.026 | −0.025 ± 0.01 | 0.70 | 0.63 |
| SWC > 14% | −5.16 ± 1.02 | −6.44 ± 0.49 | 1.92 ± 1.35 | 1.75 ± 0.67 | −0.0175 ± 0.004 | −0.017 ± 0.004 | 0.78 | 0.94 |
| VPD ≤ 1 kPa | −4.79 ± 0.43 | −7.38 ± 0.49 | 1.68 ± 0.81 | 1.51 ± 0.71 | −0.019 ± 0.004 | −0.018 ± 0.003 | 0.96 | 0.96 |
| 1 kPa < VPD ≤ 2 kPa | −3.51 ± 0.35 | −4.50 ± 0.40 | 1.03 ± 0.42 | 0.74 ± 0.51 | −0.014 ± 0.004 | −0.012 ± 0.003 | 0.25 | 0.22 |
| VPD > 2 kPa | −3.92 ± 2.26 | −5.75 ± 1.14 | 1.97 ± 2.57 | 1.21 ± 0.61 | −0.017 ± 0.007 | −0.005 ± 0.001 | 0.68 | 0.88 |
The NEEmax in FS was greater (i.e., more C uptake ability) when Ta < 25 °C than that when Ta > 25 °C (table 1). Interestingly, NEEmax in GS was nearly 50% greater than that in FS when Ta < 25 °C. SWC also had notable effects on NEEmax. Absolute values of NEEmax increased with increasing SWC, with no record of SWC < 10% at GS. At FS, NEEmax under SWC > 14% with −5.2 μmol m−2 s−1 was much greater than that when SWC ≤ 10% with −0.4 μmol m−2 s−1. With SWC > 14%, the NEEmax of GS was 20% greater than that of FS. Separated by 1 kPa, the NEEmax of both ecosystems decreased with increasing VPD, but kept stable when VPD was <2 kPa. The NEEmax of both ecosystems under low VPD (≤1 kPa) were 25% more than those at the high VPD (>2 kPa). The NEEmax in GS was 50% greater than that of FS under VPD < 1 kPa. The apparent quantum yield at the ecosystem level (α) also showed differences in both ecosystems. The α and bulk daytime ecosystem respiration (Reday) of the two sites at optimum temperatures (15 °C < Ta ≤ 25 °C) was high. When Ta increased to >25 °C,NEEmax and α were depressed (table 1).
3.2.2. Nighttime NEE and soil temperature.
The NEE of nighttime carbon (i.e., Re) responded to changes in soil temperature (Ts) and water with clear differences between the disturbed and undisturbed steppe (using data with u* > 0.10 m s−1). To avoid the confounding effects of grass phenology and soil water on the temperature function, a specific response curve for each month of 2010 was developed throughout the summer months (figure 4). The exponential function (i.e., equation (3)) described the relationships between Ts and Re very well. In the growing season, high Q10 values were observed in initial growth and mid to later stages (May and October), whereas low Q10 values were mostly in dry months when the grass was less active (June and July, figure 4). Obviously differences were found between drought and non-drought periods. In drought-prone June and July, the Re showed little change with Ts and with a similar Q10 between the two ecosystems. In other non-drought months, the Re increased exponentially with increasing Ts. The estimated Q10 values were estimated to vary between 1 and 4 in the growing season, with consistently greater Q10 in GS than in FS during the active growth period of August–September (figure 4).
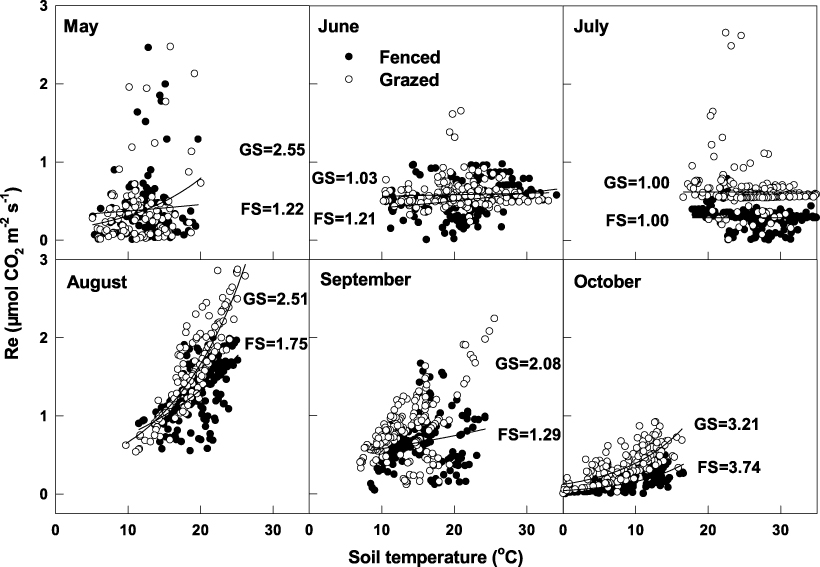
Figure 4. Response of nighttime ecosystem respiration (Re) to soil temperature at 50 mm depth in each month during the growing season in 2010. Numbers showed the Q10 values of the fenced (FS) and grazed (GS) desert steppes. The data fit curves r2 from May to October were 0.27, 0.06, 0.01, 0.77, 0.38, and 0.77 in GS and 0.06, 0.24, 0.01, 0.36, 0.22, and 0.72 in FS, respectively. Re data that fell short of the quality control (see methods) were discarded.
Download figure:
Standard image High-resolution image3.3. Ecosystem C fluxes at multiple temporal scales
3.3.1. Daily changes.
The daily amplitude of C fluxes (NEE, Re, and GEP) varied substantially within the growing seasons in both years (figure 5). Overall, GS had greater peak values of NEE, Re, and GEP than those of FS in 2010. The largest daily changes in the two ecosystems were recorded for August at both sites. The NEE was greater before noon than in the afternoon in the months when there was no severe drought (and high VPD), leading to an asymmetrical distribution of NEE around noon. Both ecosystems showed net C gains in August and September. The daily NEE peaked before noon at both sites, while the daily maximum Re occurred at around 15:00 h. The daily minimal NEE in August was −2.41 and −3.71 μmol m−2 s−1, while the maximal NEE was 1.53 and 1.72 μmol m−2 s−1, and the daily peak Re was 1.96 and 3.61 μmol m−2 s−1 at FS and GS, respectively.

Figure 5. Daily variations of the monthly means of carbon fluxes (NEE, Re, and GEP) at the fenced and grazed steppes from May to October in 2010 and 2011. GEP = gross ecosystem production; NEE = net ecosystem exchange; Re = ecosystem respiration. The 30 min data shown are means for all days in each month for the two ecosystems.
Download figure:
Standard image High-resolution imageIn contrast to 2010, net C gains were in both FS and GS in May 2011 (figure 5). In June, FS also appeared to be a C gain but GS was near neutral or a small C source. Only in June was the GS a C uptake during the daytime. From June to August, the Re in GS was a little greater than in FS. And only in May, the Re in FS was greater than that in GS. The daily minimal NEE in May was −3.83 and −2.73 μmol m−2 s−1, while the maximal NEE in August was 0.99 and 0.46 μmol m−2 s−1 at FS and GS, respectively. The peak Re appeared in July as 0.70 and 0.92 μmol m−2 s−1 at FS and GS, respectively.
3.3.2. Daily and monthly changes.
In 2010, the daily changes of C fluxes at FS and GS showed similar inter/intra-annual changes with high NEE, which were contributed by greater Re and GEP at GS (figure 6). In August, NEE, Re, and GEP reached their peaks, followed by a sharp decrease as vegetation senescence began (figure 2). The mean daily NEE was 0.06 and −0.11 g C m−2 d−1 for FS and GS, respectively. Toward the end of October, the Re in both ecosystems reached near zero. The daily Re averaged 0.60 ± 0.50 and 0.93 ± 0.67 g C m−2 d−1, and GEP averaged 0.55 ± 0.64 and 1.04 ± 0.92 g C m−2 d−1 during the growing seasons of FS and GS, respectively. For May–October, the monthly NEE, Re and GEP were significantly different between FS and GS. The steppes were C uptakes in four months in GS and two months in FS.

Figure 6. Daily variation of NEE (a), Re (b), and GEP (c) for the fenced and grazed desert steppes from 2010 to 2011 in Inner Mongolia, China.
Download figure:
Standard image High-resolution imageIn 2011, NEE, Re and GEP reached their peaks in May–June (figure 6). The mean daily NEE was −0.03 ± 0.60 and 0.32 ± 0.33 g C m−2 d−1 for FS and GS, respectively. The daily Re averaged 0.54 ± 0.18 and 0.61 ± 0.23 g C m−2 d−1, and GEP averaged 0.57 ± 0.66 and 0.29 ± 0.31 g C m−2 d−1 during the growing seasons of FS and GS, respectively.
The growing seasonal cumulative GEP, Re and NEE in 2010 were characterized with 91% greater GEP (178 versus 93 g C m−2) and 55% greater Re (158 versus 103 g C m−2) in GS than those in FS (figure 7). As a result, the GS acted as a small net C uptake of −20 g C m−2, while the FS was a small net C release with 10 g C m−2. Similarly, the annual cumulative GEP, Re and NEE were characterized with 70% greater GEP (175 versus 103 g C m−2) and 15% greater Re (168 versus 146 g C m−2) in GS than those in FS. As a result, the GS also acted as a small C sink with a magnitude of −6 g C m−2, while the FS was a small C source with a magnitude of 43 g C m−2.

Figure 7. Two growing seasons accumulative variations in NEE, Re, and GEP for the fenced and grazed desert steppes in Inner Mongolia.
Download figure:
Standard image High-resolution image
The seasonal cumulative GEP, Re and NEE in 2011 were characterized with 92% greater GEP (105 versus 55 g C m−2) and similar Re (100 versus 113 g C m−2) in FS than those in GS (figure 7). As a result, the FS acted as a small net C uptake with a magnitude of −5 g C m−2, while the GS was a net C release with a magnitude of 59 g C m−2. Similarly, the annual cumulative GEP, Re and NEE were characterized with 70% greater GEP (111 versus 66 g C m−2) and 19% greater Re (157 versus 132 g C m−2) in FS than those in GS. As a result, both the two ecosystems showed as C sources with magnitudes of 48 and 70 g C m−2 in FS and GS, respectively.
3.3.3. Responses of carbon fluxes to GNPP, SWC, Ta, SWC, VPD, PAR.
Our multiple linear stepwise regression analysis of daily GEP, Re and NEE against the potential drivers (i.e., GNPP, SWC, temperature, VPD and PAR) for using the active period data from 9 August to 6 September in 2010 (df = 27) was performed with following linear models:
For FS:
GEP =− 0.038GNPP + 5.131, F = 11.8, P = 0.002;
Re =− 0.033GNPP + 4.471, F = 31.7, P < 0.001;
NEE =− 0.419VPD + 0.293, F = 6.6, P = 0.016.
For GS:
GEP =− 0.046GNPP + 4.679, F = 11.9, P = 0.002;
Re = 0.19Ts − 1.867, F = 90.2, P < 0.001.
No model was selected for NEE in GS.
In sum, GNPP (i.e., plant growth) dominated GEP in both ecosystems and influenced Re in FS but not in GS where Ts appeared more important. VPD was the most important driver for NEE in FS, but no single driver was selected for predicting the NEE of GS. Multiple linear stepwise regressions of the monthly NEE of the entire growing season were also analyzed with the same monthly influencing factors. SWC was also found to be an important driver (also see figure 5).
4. Discussion
4.1. Dependence of the NEE–PAR relationship on abiotic factors
Our results clearly indicated that SWC, air temperature and VPD were the major factors regulating ecosystem C uptake during the active growing season of 2010. The GS had a stronger ability to uptake C than the FS under the same soil water, air temperature, and VPD conditions. This indicates that grazing creates a suitable microclimate and stimulates plant growth. Water is the most critical environmental limiting factor for plant growth of this semi-arid desert steppe. Generally, water deficit causes a decline in net C uptake and leads to decreases in leaf internal CO2 concentrations through adjusted closed leaf stomata (Farquhar et al 1980). NEEmax also clearly showed a decrease with decreasing SWC/precipitation (table 1), which was consistent with the results from other studies in the typical steppe of the Mongolian Plateau (Li et al 2005, Wang et al 2010). Compared to FS, GS had a greater NEEmax and light saturation point in relatively greater soil water (>14%), which might be related to its more physiologically active leaves and single-leaf photosynthetic capacity because its GNPP and leaf area index (LAI) were reduced by grazing (Shao et al 2012). Owensby et al (2006) also reported that grazing did not reduce canopy photosynthesis and NEE in the tallgrass prairie, although biomass decreased.
Grazing also indirectly affected C uptake by increasing soil temperature as reported by Polley et al (2008). The growing season averages of daytime (6:30–18:00 LT) and daily (24 h) soil temperature were greater in GS than FS by 0.91 and 0.43 ° C, respectively, because grazing reduced the biomass of litter and dead standing that further caused the increase in soil heat flux—the dominant energy flux in our ecosystem (Shao et al 2008). Temperature influences photosynthesis and respiration of plants primarily via temperature-dependent enzyme activity, especially Rubisco (Farquhar et al 1980). In our study, the optimum soil temperature for NEEmax appeared to be between 15 and 25 ° C (figure 3). A significant reduction in carbon assimilation was found when Ta was >25 °C in both ecosystems (similar to those reported by Zhang et al 2007). The temperature regulation difference between the FS and GS was that the NEEmax of FS shared the maximum value when 15 °C < Ta ≤ 25 °C, while for the GS it was when Ta ≤ 15 °C. The GS showed that relatively greater C uptake under low air temperature conditions might be the result of an open canopy with more sunshine in GS. This means that there was longer C uptake time in GS during the day than in FS.
Separated by 2 kPa, the NEEmax of both ecosystems decreased with increases in VPD. At greater VPD, there was a reduction in NEE because of stomatal closure under drought conditions (Farquhar et al 1980, Chen et al 2002). Greater NEEmax was found in GS than that in FS when VPD > 2 kPa.
4.2. Response of Re to temperature in growing season
In the growing season of 2010, high Q10 values were observed in growth initial and mid-later stages (May and October), whereas low Q10 values were mostly in the dry months when the grass was less active (June and July, figure 4). Q10 values ranged from 1.0 to 3.7 in FS and 1.0 to 3.2 in GS. A wider variation in Q10 values has been observed in grasslands. Flanagan and Johnson (2005) reported Q10 values of 1.5–2.5 in a northern temperate grassland. Yet, Xu and Baldocchi (2004) estimated a narrower variation in Q10 values, ranging from 2.1 to 2.5 during the season of 2000–1 in a Mediterranean C3 grassland. As numerous authors found that temperature sensitivity of Re requires adequate water, our results indicate that only when the SWC was greater, the Re increased with a soil temperature increase, while the reduced soil water in the semi-arid steppe would decrease the soil temperature sensitivity of Re. This reduction in Q10 related to decreases in soil water was documented for other typical steppes in Inner Mongolia, where decreases from more than 3.3 at >10% of SWC to 2.9 in dry soil were reported (Zhang et al 2007). Zhao et al (2006) also reported high Q10 values (near 4.5) in the initial growth stage, whereas, in contrast to our results, low Q10 values were mostly in wet months when the grass was very active over an alpine shrubland ecosystem. This might be caused by the contributions of different components of Re (i.e., autotrophic and heterotrophic respiration). It further indicated that the temperature sensitivity of Re depended not only on the soil water conditions but also on the biome type and the phenological stage of plant growth and development (DeForest et al 2006). Thus, in modeling long-term ecosystem respiration, how Q10 varies over the season with changes in soil water, temperature, phenology, and biome type should be comprehensively considered (Xu and Baldocchi 2004, Zhao et al 2006).
Comparison of the two ecosystems suggests that GS was more sensitive to the change in temperature than FS in the active growing season of 2010 (e.g., May, August and September), presumably because of the contributions of different components of Re with different temperature sensitivities for Ra and Rh. From our stepwise regression analysis, Ts controlled Re more in GS, indicating that GS enhanced Re through an increase in the Rh, which nearly correlated with Ts. GNPP controlling Re in FS means that the proportion of Ra in FS was greater than in GS because Ra was determined by the GNPP. This is reasonable because SWC was greater in GS than in FS through most of the season (figure 1(e)). Grazing reduced evapotranspiration, which would maintain greater soil water levels (Bremer et al 2001). Better soil water would induce greater microbial respiration and even the total respiration in GS as compared to FS. Liu et al (2009) found that elevated soil water caused significant increases in total and microbial respiration through a laboratory soil water gradient experiment. Grazing disturbed soil structure and accelerated decomposition of soil organic matter (especially with moderate soil water levels), which could increase Rh rates (Lindroth et al 1998) and result in a greater contribution to Re. It is demonstrated that only about 24% of soil CO2 flux was due to root respiration in the steppe (Li et al 2002). Thus, the Q10 value of Re in the GS was high during the peak growing season without water stress.
4.3. C budgets of grasslands
The minimal NEE was −2.4 and −3.7 μmol m−2 s−1 in FS and GS, respectively in 2010 while it was −3.8 and −2.4 μmol m−2 s−1 in FS and GS in 2011. These values are within the range of those observed for the grassland ecosystems with similar low LAI (e.g., typical grasslands in Mongolia, Li et al 2005, Wang et al 2008) and a tussock grassland in New Zealand (Hunt et al 2002) and differ considerably from those for North American C4-dominant prairies (e.g., Ham and Knapp 1998, Suyker et al 2003). It showed that this desert steppe shared lower minimal NEE compared to the tallgrass grasslands (Owensby et al 2006) and typical steppes (Zhang et al 2007, Wang et al 2008). Similar to our conclusion in 2010, Owensby et al (2006) compared carbon fluxes between grazed and ungrazed areas via eddy-covariance in tallgrass prairies in the US. They also found that the daytime NEE was greater (more C uptake) in GS than in FS over a 2 yr active period.
The grazed B. stipa desert steppe acted as a small carbon sink with a magnitude of −6 g C m−2, while the FS was a small carbon source of 43 g C m−2. It means that a light- or mid-grazed desert steppe can contribute more on atmospheric carbon uptake than the 7 yr ungrazed fenced steppe despite a substantially greater green leaf area on the ungrazed area. We found, however, that an inverse trend appeared in 2011, with magnitudes of 48 and 70 g C m−2 in FS and GS, respectively.
Large variability found in the literature is likely due to the diverse vegetation and climate types present in grassland ecosystems. Here, we selected the 2 years that have grazed and ungrazed labels under the same environment to compare within our sites (table 2). Some researchers suggest that carbon budgets of grassland ecosystems are near equilibrium (Owensby et al 2006, Wang et al 2008). Wang et al (2008) reported that an ungrazed typical steppe site in Inner Mongolia released 7 g C m−2 from May through October in the similar dry-to-wet alternated summer, which meant that there was a near release ability. From the yearly evaluation, GS acted as carbon neutral while FS acted as a small C source. Frank and Dugas (2001) and Frank (2002) also reported a 9 g C m−2 yr−1 greater release in ungrazed than their grazed mixed prairie in Nevada, USA. The CO2 fluxes in this study are within the range reported by Li et al (2005) and Wang et al (2008) in the Mongolia steppe. However, the GS in this study was a bit lower in C uptake than the grazed typical steppe (Li et al 2005) and grazed mixed prairie where LAI was similar (Frank 2002).
Table 2. Comparison of ecosystem characteristics of our steppe with other grasslands. LAI, leaf area index; NEE, net ecosystem CO2 exchange; F, fenced ungrazed; G, grazed. Unit is μmol CO2 m−2 s−1 for min and max NEE, g C m−2 d−1 for daily NEE, and g C m−2 yr−1 for annual NEE.
| Grassland | LAI | Min NEE | Max NEE | Min daily NEE | Annual NEE | Source | |
|---|---|---|---|---|---|---|---|
| Northern moist-mixed temperate grassland in Canada | F | 1.2 | −8 to −14 | 3.5 | −2.4 to −5 | −112–18 | Flanagan et al 2002 |
| L. chinensis typical steppe in Inner Mongolia, China | F | 107–140 | Fu et al 2009 | ||||
| Mixed prairie in Nevada | G | 0.4–0.6 | −36 | Frank 2002 | |||
| Mixed prairie in Nevada | F | 0.4 | −11 | 7 | −3 | −45 | Frank and Dugas 2001 |
| Typical steppe in Mongolia | G | 0.6 | −3.6 | 1.2 | −2.3 | −41 | Li et al 2005 |
| Typical steppe in Inner Mongolia, China | F | 0.8–1 | −8 to −3 | −15–30 | Wang et al 2008 | ||
| Grassland in Portugal (dry season) | G | 1.8 | −12.2 | −2.4 | 49 | Aires et al 2008 | |
| Grassland in Portugal (normal season) | G | 2.5 | −31.0 | −5.1 | −190 | ||
| Tallgrass prairie in USA (wet 1998) | F | 2.1 | −8.4 | 3.1 | −1.8 | 31 | Owensby et al 2006 |
| G | 1.3 | −6.5 | 3.3 | −1.8 | 5 | ||
| Tallgrass prairie in USA (wet turn to dry 1999) | F | 2.6 | −3.5 | 1.3 | −1.1 | 40 | |
| G | 0.6 | −4.0 | 1.5 | −0.9 | 11 | ||
| Tallgrass prairie in USA (dry 2000) | F | 1.6 | −6.8 | 1.2 | −1.4 | −66 | |
| G | 1.1 | −6.2 | 1.2 | −1.1 | 0 | ||
| Desert steppe in Inner Mongolia, China (dry turn to wet 2010) | F | 0.7 | −2.4 | 1.5 | −0.9 | 43 | This study |
| G | 0.6 | −3.7 | 1.7 | −1.7 | −6 | ||
| Desert steppe in Inner Mongolia, China (dry 2011) | F | 0.4 | −3.8 | 1.0 | −1.5 | 48 | |
| G | 0.2 | −2.4 | 0.5 | −1.0 | 70 |
There were marked greater seasonal summed GEP and Re in GS than that in FS in 2010 (figure 7). Similar to our discoveries, LeCain et al (2002) also found elevated soil respiration rates at both light and heavy grazed treatments, compared to the ungrazed reference shortgrass steppe in northeastern Colorado, US. Craine et al (1999) concluded that shading (likely happening in FS) would decrease soil CO2 flux by 40% in a Minnesota grassland. Bremer et al (1998) also showed similar findings in a Kansas tallgrass prairie. The improvement in microclimates (Xu and Baldocchi 2004, Zhang et al 2007), the enhancement in carbohydrates (Davidson et al 2006, Fu et al 2006), and the influence of animal saliva on grass growth (Liu et al 2012) were credited for the increases. In a study conducted at the same area, Lin et al (2010) reported that light grazing increased soil fertility via increasing available nitrogen, leading to another mechanism for enhancing ecosystem productivity. Despite a substantially greater green leaf area on the ungrazed site, greater C uptake occurred on the grazed area during the active late season in 2010. Clearly, grazing had enhanced ecosystem photosynthesis and respiration because partial removal of above ground biomass (including leaves) will thin the canopy but not reduce the total canopy photosynthesis. Meanwhile, it will stimulate the development of new leaves that have higher photosynthesis capacity that will compensate the loss from reduction in leaves (Owensby et al 2006). From our sites, considering the combination of grazed biomass and NEE, the carbon uptake in the grazed site will be further greater than 20 g C m−2 (figure 6(c) in 2010). Although Re at the GS site was also elevated, but the net carbon gain was found in 2010 at the GS site. However, in 2011, both ecosystems turned into carbon sources, with a greater C loss observed at GS than that at FS. Consequently, grazing had caused a greater interannual variation in all three measures of carbon fluxes (i.e., GEP, Re, and NEE).
5. Summary and conclusions
This is the first time in a desert steppe where CO2 fluxes were determined by the eddy-covariance technique in this large and vulnerable ecological area (desertification) on the Mongolian Plateau. Paired towers with grazed and fenced labels were used for this study. Compared with the 7 year fenced desert steppe, a near-mid-grazed steppe can contribute more on atmospheric carbon uptake in the year with average precipitation, whereas this effect does not occur in the next year with less precipitation. We identified the major reasons responsible for the greater gross ecosystem production that accompanied by greater ecosystem respiration and caused greater carbon uptake to occur on the grazed area in the first year. The consistently greater growing season gross ecosystem production that occurred at the grazed site was mainly caused by greater photosynthetic capacity due to the suitable environmental condition and longer growing time in a day and in the growing period than the fenced site. Growing season ecosystem respiration was greater at the grazed site than the fenced site, especially in a non-severe drought season when the grass was active in this study. We believe that increased heterotrophic respiration, or at least including the increase in heterotrophic respiration, may be among the primary mechanisms.
The lack of increased carbon storage in ungrazed systems indicates that in natural grassland systems, eliminating grazing to increase carbon sequestration is likely not a viable option for the specific year. Results also indicate that the variability caused by grazing in this study may significantly influence carbon exchange on this northern desert steppe. In addition, immediately fencing a severely degraded steppe for the vegetation restoration is necessary, which could also increase the litter and carbon input into the soil. A light- or mid-grazed desert steppe can contribute more to atmospheric CO2 uptake than the 7 year ungrazed fenced steppe in this study. Higher CO2 uptake potential exists in the semi-arid desert steppe if the suitable land use and soil/vegetation management were adopted in a wide area.
Acknowledgments
This study was supported by the Natural Science Foundation of China (31229001, 31170454, 31130202), the State Key Basic Research Development Program of China (2013CB956600), the NASA-NEWS Program (NN-H-04-Z-YS-005-N), and the USCCC. We would like to thank Asko Noormets for providing and training for the 'EC_Processor' software. We also greatly appreciate the constructive and careful reviews by Lisa Delp Taylor and two anonymous reviewers.