
Abstract
Extreme climatic events like droughts, floods, heat waves and ice storms impact ecosystems as well as human societies. There is wide concern about how terrestrial ecosystems respond to extreme climatic events in the context of global warming. In this study, we used satellite-derived vegetation greenness data (Normalized Difference Vegetation Index; NDVI), in situ weather station data (temperature and precipitation) and the Palmer Drought Severity Index (PDSI) to analyze the spatio-temporal change of the area experiencing vegetation greenness anomalies and extreme climatic events in China from 1982 to 2009. At the national scale, we found that China experienced an increasing trend in heat waves and drought events during the study period. The average fraction of climate stations with drought events (defined by growing season PDSI <− 2) detected increased from 8% in the 1980s, to nearly 20% in the 2000s, at a rate of 0.6% yr−1 (R2 = 0.61, P < 0.001). In contrast, the area showing negative anomalies of vegetation greenness decreased at the rate of 0.9% yr−1 from 1982 to 2009 (R2 = 0.29, P = 0.003), although this trend stalled or reversed during the 2000s, particularly in northern China. The decrease in vegetation growth during the last decade over northern China was accompanied by the increase in extreme drought events in the 2000s. In southern China, although both precipitation and PDSI data suggest a greater area experiencing drought events during the 2000s than in the 1980s, the area showing negative vegetation greenness decreased consistently during the whole study period.
Export citation and abstract BibTeX RIS
1. Introduction
One important feature of recent climate changes has been the increasing frequency of intense precipitation and extreme heat waves, which may have already imposed significant impact on natural ecosystems and human societies (IPCC 2007). For example, extreme droughts over the Amazon in 2005 and 2010 seemed to have caused a significant increase in tree mortality which led to a loss of 1.2–1.6 Pg of forest biomass carbon (Phillips et al 2009, Lewis et al 2011). In Europe, following the 2003 drought and extreme summer heat waves, gross primary productivity was estimated to drop by 30%, which changed the European ecosystems to a net CO2 source (0.5 Pg C yr−1) offsetting roughly four years of carbon that it usually sequesters (Ciais et al 2005). Moreover, it is projected that the probability of extreme climatic events is likely to increase in the future, as a result of anthropogenic climate change (Easterling et al 2000, IPCC 2007). Therefore, evaluation of the impacts of extreme climatic events on vegetation activity is critical for better understanding the vulnerability of the terrestrial carbon cycle and the sustainable use of natural vegetation resources.
One remarkable feature of China's ecosystem over the past two decades has been the rapid increase of forest area. The ambitious afforestation programs have increased forest area by 30% during the last two decades (Chinese Ministry of Forestry 2009), contributing to about one tenth of the carbon sink over terrestrial ecosystems in China (Fang et al 2001, Piao et al 2009). The terrestrial carbon sink in China was estimated to mitigate 28–37% of its fossil carbon emissions on average during the past 20 years (Piao et al 2009). This regional carbon sink could be vulnerable to climate change, especially to extreme climatic events, which appear to have become more frequent during the past several decades in China (Piao et al 2010). For instance, large increases of dry areas in Northeast, North and eastern Northwest China since the 1990s are unprecedented during the past half century and drought could persist for 4–5 years in some regions in northern China (Zou et al 2005). In the mid-to-lower reaches of the Yangtze River, in contrast, extreme daily precipitation (95th percentile) was likely to be more frequent over the past few decades (Zhai et al 2005). Thus, one key question is how vegetation activity in China is responding to extreme climate events, and the spatio-temporal variability of this response. To address this question, we use a time series dataset of satellite vegetation greenness, Normalized Difference Vegetation Index (NDVI) available from 1982 to 2009 (Tucker et al 2005), precipitation, temperature, and Palmer Drought Severity Index (PDSI) datasets to investigate anomalies of vegetation greenness linked with extreme climatic events, particularly with drought.
2. Methods and datasets
2.1. Datasets
NDVI, defined as the ratio of the difference between near-infrared reflectance and red visible reflectance to their sum, is a useful indicator of vegetation greenness (Myneni et al 1997). It has been frequently applied in models to assess vegetation productivity (Potter et al 1993, Nemani and Running 1997, Zhao and Running 2010). We used NDVI with 8 km spatial resolution and 15 day temporal resolution derived from the National Oceanic and Atmospheric Administration's Advanced Very High Resolution Radiometer (NOAA/AVHRR) dataset by the National Aeronautics and Space Administration (NASA) Global Inventory Monitoring and Modeling Studies (GIMMS) group (Tucker et al 2005). The GIMMS NDVI dataset has been corrected to minimize the influence of non-vegetation factors, such as atmospheric aerosol by volcano eruptions, change in solar zenith angle and sensor errors (Kaufmann et al 2000, Tucker et al 2005). Though some cloud and aerosol contamination may still remain in the dataset (Fensholt et al 2009), previous studies have also suggested that GIMMS NDVI has a suitable quality for monitoring change in vegetation greenness over the past three decades (e.g. Zhou et al 2001, Slayback et al 2003, Fensholt et al 2009, De Jong et al 2012).
In order to eliminate spurious NDVI trends due to winter snow, we adopted the growing seasons derived from MODIS data (Zhang et al 2003), which generally were in accordance with recent studies on the growing season of China's temperate vegetation (Piao et al 2006). According to the growing season data, the AVHRR NDVI data were aggregated into monthly mean values and further into average values of the growing season with a spatial resolution of 1/12°*1/12° to analyze inter-annual change of vegetation greenness over China. In addition, pixels bearing average growing season NDVI values less than 0.1 have been excluded to enhance data quality, because changes in very low NDVI values like in deserts are more likely to be disturbed by random factors and are not important in our analysis.
Monthly mean temperature and precipitation data from 728 meteorological climate stations across China were obtained from the National Meteorological Center of China Meteorological Administration (National Meteorological Information Center of China Meteorological Administration, www.nmic.gov.cn). Among them, 418 stations were eligible for time series analysis with continuous climate data during the last three decades and average growing season NDVI greater than 0.1. Using these monthly temperature and precipitation datasets, we calculated the PDSI, one of the most prominent drought indices (Heim 2002), which measures the cumulative departure in atmospheric moisture supply and soil water demands (Palmer 1965, Dai et al 2004). Similarly to NDVI data, temperature, precipitation and PDSI data were also aggregated into average value of growing seasons.
2.2. Analyses
The greenness anomaly is defined as the standardized departure (σ) from average growing season NDVI equation (1) (Lotsch et al 2005).

where NDVI(i) is the growing season NDVI for the year i, and Mean(NDVI) and Std(NDVI) are the average and standard deviation (SD) of the growing season NDVI during 1982–2009, respectively. Anomalies were binned into moderate (|σ(i)| ≤ 1; AM+ for positive moderate anomaly and AM− for negative moderate anomaly), large (|σ(i)| > 1; AL+ for positive large anomaly and AL− for negative large anomaly) and extreme (|σ(i)| > 2; AE+ for positive extreme anomaly and AE− for negative extreme anomaly) deviations. Together, we denoted A+ (A−) for σ(i) > 0 (σ(i) ≤ 0). In this way, A+ is equal to the sum of AM+ and AL+ and the same for A−. Temperature and precipitation variations were also defined in the same way, and we used the PDSI value to define drought events, since it has already been standardized during its computation. Here we adopted the initial classification of Palmer (1965) and defined moderate drought (wet) as PDSI between −4 and −2 (2 and 4), extreme drought (wet) as PDSI below −4 (above 4) and binned them together to define drought (wet) as PDSI below −2 (above 2).
Based on the anomaly values, percentages of land areas (station numbers for climatic variables) experiencing different anomaly levels were calculated each year. To further analyze the changes of NDVI and climatic variables in different sub-regions, we divided the whole of China into nine climatic zones, as indicated in figure 1, and calculated the land fraction of different anomaly levels.
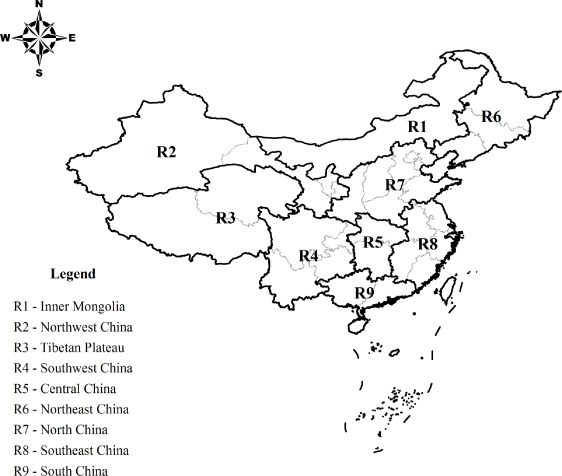
Figure 1. Spatial distribution of the studied sub-regions (R1–R9) in China. The names and numbering of the regions are shown in the legend. Region definition follows Piao et al (2009). Note that Taiwan Island (the island in the southeast) belongs to R8 and Hainan Island (the island in the south) belongs to R9.
Download figure:
Standard image3. Results and discussion
3.1. At country scale
3.1.1. Change in the area experiencing different NDVI anomalies.
Figure 2(a) shows inter-annual variations in the percentage of land area experiencing different NDVI anomalies from 1982 to 2009 and tables S1 and S2 (available at stacks.iop.org/ERL/7/035701/mmedia) list trends of land fractions in different anomaly levels. The area bearing vegetation greenness A+ increased from 27% in the early 1980s (1982–4) to 61% in the late 2000s (2007–9) by 0.9% yr−1 (R2 = 0.29, P = 0.003), which suggests an overall increasing trend in vegetation greenness during the whole study period (Peng et al 2011). Vegetation greenness AL+ and AM+ showed simultaneous increase, and each contributed half for the increase in positive anomalies. The increasing rates for AL+ and AM+ were 0.5% yr−1 (R2 = 0.26, P = 0.006) and 0.5% yr−1 (R2 = 0.17, P = 0.028), respectively. Despite a general positive trend, the spatial expansion of greening happened mainly in 1980s and 1990s, which supported the earlier finding that the enhanced vegetation productivity mainly occurred during the 1980s and 1990s (Park and Sohn 2010, Piao et al 2011). The average area of positive greenness anomalies (A+) in the 2000s (54%) is slightly lower than that in the 1990s (58%) and no significant trends of A+, AM+ and AL+ were found from 1999 to 2009 (table S1 available at stacks.iop.org/ERL/7/035701/mmedia).

Figure 2. Inter-annual variations in the standardized departure of the growing season (a) NDVI as a percentage of land areas, (b) temperature, (c) precipitation, and (d) PDSI as a percentage of climate stations over China from 1982 to 2009. Standardized departure of NDVI, temperature, precipitation and PDSI at each pixel (climate station) each year is calculated according to equation (1).
Download figure:
Standard imageAccordingly, the area showing vegetation greenness A− decreased from 1982 to 2009, at the same rate of −0.9% yr−1 (R2 = 0.29, P = 0.003). Unlike the case in A+, such a significant decline in the area of A− was mainly contributed by the decrease in the area of vegetation greenness AL− rather than in the area of vegetation greenness AM−. During the whole study period, the land fraction of vegetation greenness AL− decreased by −0.6% yr−1 (R2 = 0.28, P = 0.004), which is about twice of the decreasing rate for AM− (−0.3% yr−1, R2 = 0.14, P = 0.046). Although statistically vegetation greenness AL− decreased significantly during the whole study period, two distinct periods of its changes are observed. Fitting a piecewise linear regression model (Toms and Lesperance 2003) showed that the area of AL− dropped at −1.3% yr−1 (R2 = 0.38, P = 0.009) before 1998, but lost the negative trend after then and slightly increased from 7% (1997–9) to 12% (2007–9).
3.1.2. Change in the area experiencing different climate anomalies.
Climate change has been correlated with changes in vegetation greenness at large scales, in particular over the northern hemisphere (Zhou et al 2001, Lucht et al 2002, Tucker et al 2005). Figures 2(b)–(d) show inter-annual variations in percentages of climate stations over China which describe the growing season climatic anomalies over 1982–2009 and tables S1 and S2 (available at stacks.iop.org/ERL/7/035701/mmedia) list trends of percentages in different anomaly levels. Temperature anomalies showed a strong warming trend. The percentage of climate stations with temperature AL+ significantly increased from 1% in the early 1980s (1982–4) to 44% in the late 2000s (2007–9) (1.9% yr−1, R2 = 0.56, P < 0.001). However, this increase was largely attributed to an abrupt increase around 1998 (figure 2(b)). The percentage of climate stations experiencing temperature AL+ rapidly proliferated from 4% before 1998 (1995–7) to 24% immediately after 1998 (1999–2001), which may imply a sudden expansion of heat waves around the year 1998. Temperature was found to have a positive correlation with vegetation productivity in mid–high latitudes through lengthening growing season (Myneni et al 1997, Wang et al 2011). However, this rapid warming up did not result in a significant NDVI rise in the 1980s and 1990s. This could possibly be explained by the acceleration of soil moisture depletion through increased evapotranspiration, which suppressed vegetation productivity (Zhao and Running 2010).
The PDSI time series showed a tendency towards increasing droughts in China (figure 2(d)). In the early 1980s (1982–4), drought events (PDSI <− 2) were observed only in 8% of the climate stations. This figure increased to nearly 20% at the end of 2000s (2007–9) (figure 2(d)), rising at the rate of 0.6% yr−1 (R2 = 0.61, P < 0.001). Like the temperature trend, there was a sharp rising in the range of drought around 1998, from 12% (1995–7) to 21% (1999–2001). At the national scale, the percentage of climate stations experiencing large and extreme growing season precipitation, however, did not show statistically significant changes (figure 2(c)), suggesting little contribution from precipitation change on the long-term PDSI trend.
3.2. Spatial patterns
The inter-annual climate variability of China is highly heterogeneous in space. We further analyzed spatial patterns of extreme events in northern (including Inner Mongolia (R1); Northwest China (R2); Northeast China (R6); North China (R7)) and southern (including Southwest China (R4); Central China (R5); Southeast China (R8); South China (R9)) China. All the region numbers are in accordance with figure 1.
3.2.1. Northern China.
As shown in figure 3, changes in the area experiencing vegetation greenness anomalies exhibited a pronounced geographical heterogeneity, resulting from the differences in regional climatic conditions (figures 4–6). Several studies showed that climate in northwestern China was changing from warm-arid to warm-wet, with increasing rainfall and runoff, and enhanced vegetation activity during the 1980s and 1990s (Shi et al 2007). Our results are generally consistent with earlier findings. As shown in figure 6, drought extent indicated by PDSI percentage (PDSI <− 2) showed a shrinking trend over Inner Mongolia (R1) and Northwest China (R2) in the 1980s and 1990s, due to the increase in precipitation (figure 5). Accordingly, the area experiencing positive vegetation greenness (A+) increased in these regions during the same period (figure 3 and table S1 available at stacks.iop.org/ERL/7/035701/mmedia). However, like the general trend at the national scale, this trend changed dramatically and the area experiencing positive vegetation greenness (A+) even tended to decrease in the 2000s (table S1 available at stacks.iop.org/ERL/7/035701/mmedia), which may be explained by the increase in PDSI trend caused by drastic precipitation and temperature change (figures 4 and 5 and table S2 available at stacks.iop.org/ERL/7/035701/mmedia). Similar stalling of increasing area experiencing positive vegetation greenness (A+) also occurred in Northeast China (R6). Inner Mongolia (R1), Northwest China (R2) and Northeast China (R6) are the driest regions in China where mean annual precipitation is usually below 400 mm (figure 5). The decreasing PDSI in recent decades may intensify the drought stress to the forests over these regions, where the survival of the forests is strongly limited by available water (Cao et al 2010, 2011).
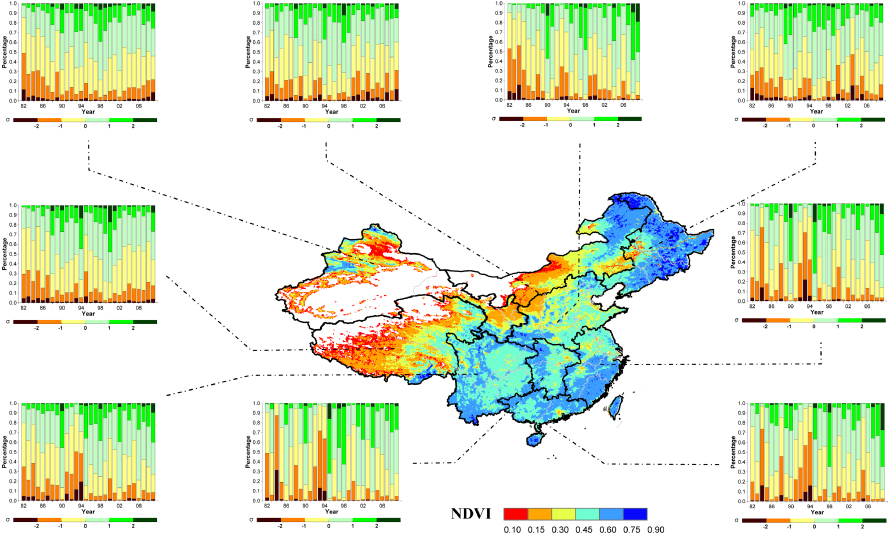
Figure 3. Inter-annual variations in standardized departure of growing season NDVI as a percentage of land areas over nine regions (R1–R9 as indicated in figure 1) from 1982 to 2009. The standardized departure of each pixel is calculated according to equation (1). Black lines show regional boundaries and background colors indicate mean growing season NDVI during 1982–2009.
Download figure:
Standard image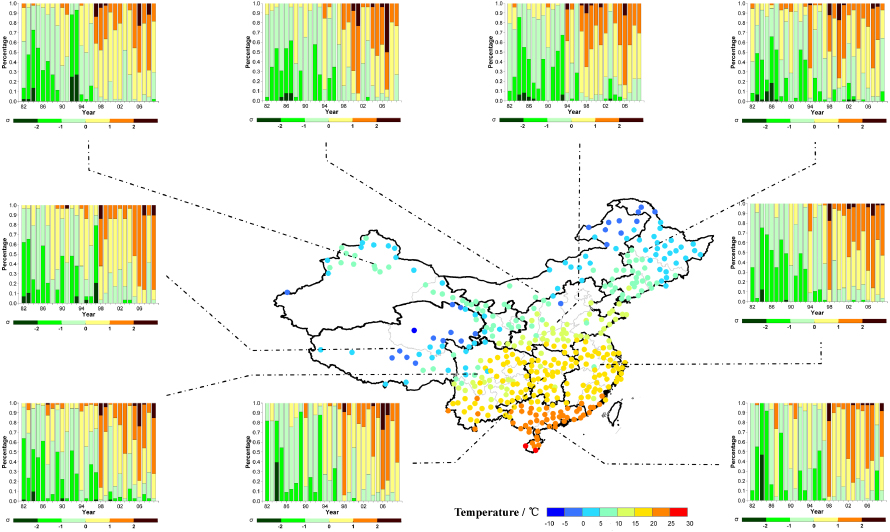
Figure 4. Inter-annual variations in standardized departure of growing season temperature as a percentage of climate stations over nine regions as in figure 3. Black lines show regional boundaries and dots show the location of climate stations with colors indicating mean annual temperature during 1982–2009.
Download figure:
Standard image
Figure 5. Inter-annual variations in standardized departure of growing season precipitation as a percentage of climate stations over nine regions as in figure 3. Black lines show regional boundaries and dots show the location of climate stations with colors indicating mean annual precipitation during 1982–2009.
Download figure:
Standard image
Figure 6. Inter-annual variations in PDSI as a percentage of climate stations over nine regions as in figure 3. Black lines show regional boundaries and dots show the location of climate stations with colors indicating mean annual PDSI during 1982–2009.
Download figure:
Standard imageNorth China (R7) suffered drought threats during the 1980s and 1990s (figure 6). Despite the drying trend in this region, the area experiencing vegetation greenness A+ significantly increased during the whole study period (1.9% yr−1, R2 = 0.32, P = 0.002). After the browning induced by a severe drought in the early 2000s (figures 3 and 6), vegetation greenness in this region recovered quickly although there existed a drying trend. A similar phenomenon was also found in some water-limited regions of Australia, where moisture condition was not improved but vegetation greenness became better, driven by increase of perennial vegetation (Donohue et al 2009). It is possible that perennial woods, shrubs or species with better water use efficiency expanded in North China after drought and elevated CO2 might also have helped to reduce soil water loss through stomatal responses (Field et al 1995). Besides, human activities should not be ignored in North China. In this region, 60% of the land area is cropland, and thus vegetation greenness in this region is not only influenced by climate change, but also regulated by agriculture management activities, which may contribute to the inconsistency between NDVI and PDSI trends.
3.2.2. Southern China.
One important feature of China's climate change over the last decade is the increased drought frequency in its wet southern regions (Wu et al 2011). Indeed, both precipitation and PDSI data confirmed that regional drought events in the 2000s were much more frequent than those in the 1980s across all southern China (figures 5 and 6). But the magnitude of the increase is not as large as that in northern China, in both severity and spatial ranges. Unlike in Inner Mongolia (R1) and Northwest China (R2), vegetation greenness anomalies over southern China responded in a much more complicated way to changes in water availability (figure 3). For example, in Southwest China (R4), although the percentage of climate stations experiencing drought (PDSI <− 2) kept increasing from 1999 to 2009 at a rate of 1.4% yr−1 (R2 = 0.31, P = 0.073), the vegetation greenness AL+ (σ > 1) area showed a marginal increasing trend of 1.8% yr−1 (R2 = 0.22, P = 0.141) (tables S1 and S2 available at stacks.iop.org/ERL/7/035701/mmedia).
Several mechanisms may explain the phenomenon that the area experiencing vegetation greenness A+ increased in southern China in the 2000s despite the expansion of drought indicated by decreasing PDSI. Firstly, this phenomenon may be partly related to the increase in solar radiation accompanied by the decrease of precipitation. A previous study suggested that solar radiation is one of the main limiting factors for vegetation productivity over southern China, and thus increase in solar radiation generally led to an increase in vegetation growth in southern China (Nemani et al 2003). Secondly, unlike Inner Mongolia (R1) and Northwest China (R2) where grassland is the main vegetation type, forest dominates in southern China. It has been suggested that forests may be more resilient to drought than grasslands, at least in response to short-term drought (Teuling et al 2010), due to its deeper root system than grasslands (Jackson et al 1996). As drought stress may not limit forest growth in southern China, the forest could possibly benefit from warming-induced earlier spring onset (e.g. Black et al 2000, Richardson et al 2009). Finally, anthropogenic activities (such as afforestation and reforestation due to land abandonment during migration into urban areas) may also partly contribute to the expanding areas of positive vegetation greenness (A+) in southern China in the 2000s. Forest plantation has been increasing steadily since 1980, from 22.19 million ha during 1977–81 to 61.69 million ha during 2004–8, and more than 60% plantations are distributed in southern China (Chinese Ministry of Forestry 2009). For example, several forestry projects, such as the Upper and Middle Reaches of the Yangtze River Shelter Forest Project, and Pearl River Valley Conservation Forest, have been performed in southern China in the 1990s (Wang et al 2004).
It should be noted that cloud conditions were suspected to affect NDVI values (Chen et al 2004, Fensholt et al 2009), particularly over southern China where cloudy weather is common in the growing season. Using Climate Research Unit (CRU) data (Mitchell and Jones 2005), we explored the potential influence of cloud cover on vegetation greenness change by studying change in cloud cover over southern China during 1982–2009 (figure S1 available at stacks.iop.org/ERL/7/035701/mmedia). As shown in figure S1 (available at stacks.iop.org/ERL/7/035701/mmedia), the cloud cover did not exhibit significant trends during 1982–2009 (−0.021% yr−1, P = 0.67 for Southwest China (R4); 0.007% yr−1, P = 0.84 for South China (R9)), nor did it significantly correlate with inter-annual variations of land fractions bearing different vegetation greenness anomalies (P > 0.05 for A+, AM+, AL+, A−, AM−, AL− in all the sub-regions). Therefore, the observed greening trend over southern China is not an artifact induced by change in cloud conditions, though cloud contamination may partly remain in the GIMMS NDVI dataset (Fensholt et al 2009). Further studies with ground-based vegetation greenness and biomass measurements are needed to confirm our satellite-based observations.
4. Summary and conclusion
Our results presented in this study show that although extreme climatic events, particularly hot climate and drought events, increased across China, the area experiencing positive vegetation greenness has significantly increased over the last three decades, particularly over southern China. However, there exists a spatial heterogeneity in vegetation's response and it would be too early to predict that future extreme climate events will not significantly reduce vegetation greenness in southern China. IPCC global climate models project a widespread drought in many regions under future climate change (IPCC 2007). If the frequency and intensity of drought continue to increase in the future, one cannot rule out the possibility that the severe droughts could reduce vegetation productivity (e.g. Reichstein et al 2007) and even trigger vegetation die-off (Breshears et al 2005, Adams et al 2009).
Change in vegetation growth could not only result in change in the land carbon sink (Ciais et al 2005, Ma et al 2012) but also lead to change in evapotranspiration and surface albedo. These changes in biogeophysical properties have important feedback to the climate system, for instance, through slowing/accelerating the land surface warming (Bounoua et al 2010) and altering the intensity of the extreme heat waves (Teuling et al 2010). Monitoring the impact of extreme events on vegetation greenness could also shed light on the change in crop production (Fuller 1998, Vicente-Serrano et al 2006) and in the livestock carrying capacity of grasslands (Kawamura et al 2005), and it also helps in assessing the ecosystem vulnerability to extreme climatic events (Propastin et al 2010).
Further long-term field experiments and process-based modeling studies are highly desired, in order to obtain a more general picture of the impacts of extreme climate events on vegetation greenness.
Acknowledgments
This study was supported by China Educational Foundation for Undergraduate Students of Sciences (No. J1103406/J0105), the National Natural Science Foundation of China (grants 41125004) and the Foundation for Sino-EU Research with the cooperation of the Ministry of Science and Technology of China (1003). The contribution of RBM was made possible through NASA Earth Science Research Grants.