

Abstract
Humans affect fire regimes by providing ignition sources in some cases, suppressing wildfires in others, and altering natural vegetation in ways that may either promote or limit fire. In North America, several studies have evaluated the effects of society on fire activity; however, most studies have been regional or subcontinental in scope and used different data and methods, thereby making continent-wide comparisons difficult. We circumvent these challenges by investigating the broad-scale impact of humans on fire activity using parallel statistical models of fire probability from 1984 to 2014 as a function of climate, enduring features (topography and percent nonfuel), lightning, and three indices of human activity (population density, an integrated metric of human activity [Human Footprint Index], and a measure of remoteness [roadless volume]) across equally spaced regions of the United States and Canada. Through a statistical control approach, whereby we account for the effect of other explanatory variables, we found evidence of non-negligible human–wildfire association across the entire continent, even in the most sparsely populated areas. A surprisingly coherent negative relationship between fire activity and humans was observed across the United States and Canada: fire probability generally diminishes with increasing human influence. Intriguing exceptions to this relationship are the continent's least disturbed areas, where fewer humans equate to less fire. These remote areas, however, also often have lower lightning densities, leading us to believe that they may be ignition limited at the spatiotemporal scale of the study. Our results suggest that there are few purely natural fire regimes in North America today. Consequently, projections of future fire activity should consider human impacts on fire regimes to ensure sound adaptation and mitigation measures in fire-prone areas.
Export citation and abstract BibTeX RIS

Original content from this work may be used under the terms of the Creative Commons Attribution 3.0 licence. Any further distribution of this work must maintain attribution to the author(s) and the title of the work, journal citation and DOI.
Introduction
Humans affect fire regimes worldwide, sometimes causing profound changes to ecosystem structure and function (McWethy et al 2013). In many parts of the world, people increase fire activity beyond what is naturally expected by deliberately or accidentally setting fire to natural vegetation (Carcaillet et al 2009, Bowman et al 2011). This is the case, for example, in African savannas, where cultural practices of frequent burning make it the archetype of a 'human-tended' fire regime (Archibald et al 2012). Conversely, in other regions or ecosystems of the world, such as in parts of North America, land-use change and a culture of aggressive fire suppression may limit fire activity (Cumming 2005, Finney et al 2009). Globally, humans are usually responsible for the majority of ignitions; however, many regions where human ignitions are prevalent are also subject to intense fire management programs aimed at extinguishing fires before they become large (Stocks et al 2002, Stephens 2005). In addition to these direct effects on fire activity, humans may exert pervasive and enduring indirect effects on fire regimes by altering, or removing, the natural vegetation (e.g., change in forest structure, invasive annuals, logging, conversion to irrigated agriculture) (Cochrane 2003, Pausas and Keeley 2009, Perry et al 2012, Fréjaville and Curt 2015).
Several investigations of wildland fire in North America show a dramatic effect on fire activity following the arrival of Europeans. An initial surge in area burned at the time of settlement due to slash-and-burn practices in some areas (Weir and Johnson 1998) was followed by a large-scale reduction in fire activity that was largely the result of fire suppression and human modifications to the natural vegetation cover (Marlon et al 2008). Over the past three decades, however, substantial increases in wildfires have been reported, notably in the western United States (Westerling et al 2006) and in the boreal zone (Kasischke and Turetsky 2006). Although this phenomenon has been largely attributed to a warmer and drier climate, it is increasingly recognized that, in some areas, humans may have played a role (Stephens et al 2007, McWethy et al 2013). Paradoxically, some of the recent increases in fire activity in parts of the continent, notably in the west, may be due to a legacy of fire management policies that were too successful (Stephens and Ruth 2005). Almost a century of active fire suppression has led to unintended biomass accumulation that consequently increased the average size and intensity, as well as ecological impact, of modern fires (Keane et al 2002). The impact of humans on fire is thus inherently complex: some human activities yield more fire, whereas the opposite is true of others (Sturtevant and Cleland 2007, Parks et al 2015), thereby challenging our assessment of the net effect of humans on wildland fire activity in North America and elsewhere.
In North America, the influence of humans on fire activity is assumed to be highly variable, ranging from extreme in areas of high population and altered land use to seemingly negligible in unmanaged wildlands. Areas with historically active fire regimes (whether natural or anthropogenic), notably in the northeastern United States and adjacent Canada, now experience virtually no wildland fire (Clark and Royall 1996, Nowacki and Abrams 2008). In contrast, the heavily populated regions of southeastern North America, where a culture of prescribed burning has existed for centuries, have highly active fire regimes that are largely human dominated (Waldrop et al 1992, Slocum et al 2007). In the center of the continent, in the American Midwest and Canadian Prairies, where vast grasslands were converted to agriculture, previous high fire activity has been greatly diminished or even excluded altogether (Collins and Wallace 1990, Brown et al 2005). Currently, most fire activity in North America occurs in the western United States and in the boreal forests of Canada and Alaska, where, in spite of large pockets of urbanization and agriculture, fire is promoted by expansive wildlands combined with fire-conducive climates and vegetation (Swetnam 1993, Westerling et al 2003). However, though quite active, it has been argued that fire regimes in most forests of western North America are far from natural, having been shaped by a century of fire suppression and forest management (Stephens and Ruth 2005). The most natural fire regimes of North America are presumed to occur in the northern forests of Canada and Alaska (Flannigan et al 2009). Not only are these regions sparsely populated, but, given their regimes of low-frequency, high-intensity fires, some have suggested that fire suppression is less effective here than it is in other forest types (Johnson et al 2001).
Most evaluations of the influence of human activity on North American fire regimes have been conducted for specific countries, subregions, or landscapes (e.g., Cardille et al 2001, Sturtevant and Cleland 2007, Syphard et al 2007, Gralewicz et al 2012, Hawbaker et al 2013, Liu and Wimberly 2015). Moreover, published studies have been carried out at various temporal and spatial scales and using different data types and modeling techniques, thereby preventing an unbiased comparison among regions (but see Bistinas et al 2013). A continent-wide assessment that uses a consistent approach would complement previous efforts with the added benefit of providing a baseline for large-scale policy or management plans. As such, the overarching goal of this study was to conduct a comprehensive evaluation of the effect of humans on fire activity across North America. Our specific objectives were to (1) assess the importance of human influence on fire activity and (2) evaluate the shape of this relationship (positive, negative, unimodal). This was achieved by partitioning the United States and Canada into 16 hexagonal polygons (size = 1.38 × 10⁶ km2) and, for each hexagonal polygon, creating a statistical model of fire probability (based on area burned) for the 1984–2014 time period as a function of climate, enduring features (topography and percent nonfuel), lightning, and indices of anthropogenic influence. These models allowed us to (1) statistically control for the effect of other factors when assessing the influence of humans on fire activity and (2) evaluate the spatial variability in these relationships at a continental extent.
Methods
The study area covers the United States (US) and Canada (hereafter North America; 19 437 101 km2) (figure 1(a)), excluding Hawaii and the Caribbean islands. Full coverage of North America was not possible due to lack of data for Mexico. The study area was partitioned into 16 hexagonal polygons (hereafter hexels) (hex 1 to hex 16) having a width of 1260 km and an area of 1 374 902 km2 (figure 1(b)). Explorations showed that this size and placement of hexels represent a good tradeoff between capturing subcontinental variability in fire activity and producing robust models of fire activity across the study area. The response variable is sampled within burned areas, and consequently the modeled response quantifies the probability that any given pixel burned over the 1984–2014 time period (hereafter fire probability). For each hexel, we built a statistical model of fire probability as a function of climatic normals, enduring features (topography and nonfuel), lightning, and measures of anthropogenic influence.
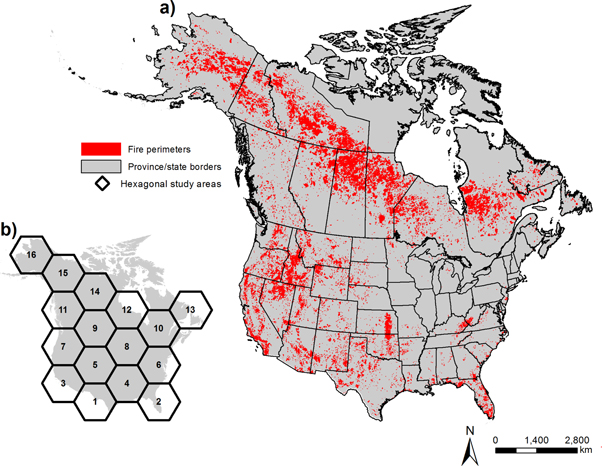
Figure 1. The study area (United States and Canada) with political boundaries and area burned by fires for the1984–2014 time period (in red) (a). Models are created for each of the hexels superimposed on the study area (b).
Download figure:
Standard image High-resolution imageThe fire probability models were fully comparable among hexels, as they were built using the same set of explanatory variables and used the same model settings. We evaluated the importance of indices of anthropogenic influence to determine the human impact on fire activity by controlling (statistically) for the effect of climate, enduring features, and lightning patterns in each hexel. We then plotted the relationship of each of these metrics to assess whether fire probability decreased, increased, or had a nonlinear (e.g., unimodal) relationship to the anthropogenic variables in each hexel.
Data
Models of fire probability were built as a function of several explanatory variables likely to influence fire activity for each hexel. Although a large set of independent variables was initially considered for modeling, we selected a subset of variables that were not highly correlated with one another and also had good explanatory power for predicted area burned across North America (table 1; figure B1). The description that follows focuses on the variables selected for the modeling. The full list of variables is found in table A1. We processed all model variables using a North America Albers equal-area conic projection at a 1 km pixel resolution.
Table 1. Description of variables used in the statistical modeling of fire probability in the United States and Canada. The time period covered is 1984–2014 for the area burned and 1981–2010 for climate variables. The mean and range values of pixels are given for each variable. All variables were resampled to a resolution of 1 km.
| Variable name | Description | Units | Mean (range) |
|---|---|---|---|
| Fire | |||
| Area burned | US fires merged with Canadian fires. US fires from MTBS database 1984–2014. Canadian fires from Canadian National Fires database 1984–2014. Fires over 400 ha used. | ha | 5311 (400–2 205 060) |
| Climate (1981–2010 normals) | |||
| CMI | Hargreave's climatic moisture index | Dimensionless | 299.4 (0–1754) |
| DegDaysU18 | Degree days under 18 °C | Degree days | 5043 (0–11 539) |
| MeanPrecip | Mean annual precipitation | mm | 722 (50–10 149) |
| RelHumid | Mean annual relative humidity | (%) | 59.6 (36–85) |
| Enduring | |||
| HeatLoadIndex | Heat load index, an index calculating the southwestness of a slope | Dimensionless | 0.64 (0.096–1.03) |
| SurfAreaRatio | Surface area ratio | Dimensionless | 1.01 (1–1.40) |
| TopoPosIndex | Topographic position index calculated at 2000 m scale | Dimensionless | –0.34 (–489–843) |
| PctNonfuel | Percent nonfuel at a 1000 km2 moving window size. Nonfuel classified as barren lands, water, snow, and ice. From 2005 land cover | % | 4.5 (0–99.7) |
| Lightning | |||
| Lightning | Average number of lightning strikes per year from 1995 to 2005 | Flashes km–2 year–1 | 5.9 (0–46.4) |
| Anthropogenic | |||
| HumanFoot | Human Footprint Index, an index of human influence for the year 2004. Calculated from a 100 km2 moving window. | Dimensionless | 16.5 (0–98.1) |
| LogPopDens | Log of population density for the year 2000 | People km–2 | –0.51 (–4 to 4.3) |
| RdlsVol | Roadless volume calculated with a 10 000 km2 moving window | km3 | 6.5 (0.067–100) |
Fire
The US fire data were obtained from the Monitoring Trends in Burn Severity (MTBS) project (Eidenshink et al 2007), whereas Canadian data were obtained from the Canadian Forest Service National Fire Database (Parisien et al 2006). Because only fires ≥400 ha are included in the western US, this size threshold was applied to the entire study area; fires <400 ha were numerous but represent a small fraction of the total area burned (<5%). Both datasets include prescribed burns, but these comprise <7% of the fires and <2% of the total area burned across the study area. We noted two limitations with these data: (1) fires were inconsistently reported from 1984 to 1995 in Ontario north of 54° N and (2) unburned islands were not mapped (or incorrectly mapped) for many of the fire perimeters in the dataset. Neither limitation is expected to greatly affect estimates of area burned at the spatial extent of a hexel.
Fire occurrence, as integrated in the model, consists of points randomly sampled within fire perimeters of mapped fires ≥400 ha from 1984 to 2014. We considered areas as either burned or unburned over the 31 year time period and did not distinguish areas that may have burned more than once. This approach was deemed the most suitable given the low proportion of re-burned areas during the study time period (∼8% of the total area burned). The points were sampled within the polygon data (rather than a raster dataset); therefore, there was no loss of spatial resolution in this process.
Climate
A suite of 30 year climate variables describing gradients of energy (temperature) and moisture (precipitation and humidity) for the 1981–2010 time period was generated. This time period represents a slight mismatch to that of the fire data (1984–2014), but is not expected to greatly influence the results. The Climate WNA software (Wang et al 2012) was used to interpolate the climate data from a digital elevation model. Of the climate variables selected for modeling, two depicted patterns of moisture: mean annual precipitation (MeanPrecip) and mean annual relative humidity (RelHumid). One variable was a measure of temperature, the degree days under 18 °C (DegDaysU18), and another, the climate moisture index (CMI), was an annual integrative measure of energy and moisture (precipitation–potential evapotranspiration).
Enduring features
Enduring features are those components of the landscape that vary little, if at all, during the time scale of the study. Elevation-derived metrics describing topography comprised most of this category of variables. Heat load index (HeatLoadIndex), which is a measure of potential sun exposure, and surface area ratio (SurfAreaRatio), which is a measure of surface roughness, were computed with Geomorphometry and Gradient Metrics Toolbox 2.0 (Evans et al 2014). Topographic position index (TopoPosIndex) describes the relative position along a valley-to-peak gradient; this metric was computed with a 2000 m window. Percent permanent nonfuel (PctNonfuel), which included open water, glaciers, barren ground, and urban areas from the 2005 global land cover (Friedl et al 2010), was computed at 100 and 10 000 km2 scales using moving window averages at each of the radii to account for possible scale-dependent effects (Parisien et al 2012); PctNonfuel at the 10 000 km2 scale was retained for modeling.
Lightning
Patterns of lightning were used to describe natural ignition potential across the study area. The density of cloud-to-ground lightning strikes for the 1995–2005 time period was obtained from the NASA LIS/OTD 0.5° high-resolution annual climatology dataset (Christian et al 2003). In spite of the lightning dataset having only partial overlap with the time period of the study and a coarser resolution than the other variables, it was deemed acceptable for depicting lightning strike patterns at the spatial scale of this study.
Anthropogenic influence
Three anthropogenic variables were considered in our evaluation of the influence of humans on fire activity in North America. Population density (log10-transformed; LogPopDens) was obtained from the Center for International Earth Information Network (Balk et al 2006). High values of this metric are concentrated in urban areas and, as such, it effectively separates urban versus rural (including wild) areas. The Human Footprint Index (HumanFoot) is an integrated index of human influence derived from roads, urban areas, and nighttime light (Sanderson et al 2002). Because it is based on a range of features, this index reveals more about human activities than LogPopDens. We evaluated LogPopDens and HumanFoot variables at the 1 km2 (resolution of raw data) and 100 km2 scales (moving window average); only the best-performing scale was selected. Roadless volume (RdlsVol; Watts et al 2007) is a metric of isolation from human influence computed from road data (ESRI 2008). It represents the product of the footprint (area of cells containing roads) and the mean distance to roads and was computed at 100 and 10 000 km2 scale. Though similar to HumanFoot, RdlsVol is simpler and better emphasizes remoteness. Road density was initially considered but subsequently dropped because of its strong correlation with RdlsVol.
Variable selection
A subset of 12 variables from the initial pool of explanatory variables (table A1) was selected for model building according to their degree of correlation and ability to predict fire activity (table 1; figure B1). First, correlations were computed between each pair of variables to identify those correlated at |r| > 0.7 across the study area and within each hexel. Although correlations varied among hexels, explorations showed that a hexel-wise selection yielded similar variable sets than for the entire study area. This variable selection approach thus provides a good trade-off between model performance and the ability to compare results among hexels. In each grouping of correlated variables, a single variable was chosen according to its ability to explain fire activity in bivariate MaxEnt models of fire according to the area under the curve (AUC) metric (see Statistical modeling). Because we were primarily interested in human influences on fire activity, LogPopDens, HumanFoot, and RdlsVol were retained in spite of correlations |r| > 0.7. Of these variables, LogPopDens and RdlsVol were correlated to the DegDaysU18 climate variable at r = 0.80 and r = −0.72, respectively. Anthropogenic variables were also correlated with one another: LogPopDens–HumanFoot at r = 0.86; LogPopDens–RdlsVol at r = −0.78; and HumanFoot–RdlsVol at r = −0.75.
Statistical modeling
Statistical models of fire probability using 12 explanatory variables (table 1) were produced for each of the 16 hexels. Models were built using MaxEnt v.3.3.3k (Phillips et al 2006), a machine-learning technique designed for presence-only data (i.e., when true absences are unknown). A presence-only framework was deemed adequate because a lack of fire need not be interpreted as a true absence over the 31 years of fire data for which we conducted this study (i.e., many areas that did not burn will likely burn in future years); however, presence-only or presence–absence framework have been shown to produce similar models of fire probability (Parisien and Moritz 2009). MaxEnt evaluates the environmental space of the points sampled within the fire perimeters ('fire presence') in contrast to that of the entire environment of study area ('background'). It does so by fitting the probability distribution of maximum entropy to the environmental variables at each fire-presence point. This modeling technique allowed us to model highly complex relationships without overfitting the responses. MaxEnt settings were selected following the advice of Elith et al (2011) and through careful explorations in which the aim was to produce robust models for the ensemble of hexels. To this end, we opted for a regularization value of four and did not use the 'hinge' feature, which tends to produce unrealistic (i.e., overfit) responses.
A large number of fire presences and background points were sampled to ensure that the appropriate degree of variability was captured for statistical modeling. Points were randomly sampled in burned areas at a density of 1 point per 5 km2 for fire presences and across the hexel's landmass at a rate of 1 point per 50 km2 for the background. Points were never sampled within permanent nonfuels (water, glacier, urban, rock). Because of variation in both area burned and hexel landmass, the number of sample points varied among hexels. To reduce spatial autocorrelation in model residuals, a random subset of total fire-presence points were selected for model building. One hundred such subsets were used and their results were subsequently averaged (see Parisien et al 2012). This strategy was appropriate across the study area because it limited overfitting while yielding robust models of area burned for each hexel.
Four models of fire probability were produced for each hexel. The first model (hereafter 'full model') was built using all 12 variables, and its output was used to determine the importance of the four categories of variables: climate, enduring features, lightning, and anthropogenic influence. The other three models (simply named after the variable of interest; e.g., LogPopDens) were created to highlight the singular effect of each of the anthropogenic variables. These three models were each built using a total of 10 explanatory variables, including climate, enduring features, lightning, and a single anthropogenic variable. These models were used to evaluate the response of area burned to each of the three anthropogenic variables; the reason for incorporating only one of these variables was to avoid any distortion of the response due to the anthropogenic variables' correlation to one another.
Model evaluation was performed on each of the 100 subset models and subsequently averaged for each hexel. As a measure of overall of model performance, the AUC was computed from the true positives and false positives (Liu et al 2005). AUC values may range from 0.5, where prediction accuracy is no better than if samples were randomly selected, to 1, which indicates perfect classification accuracy. However, in a presence-only framework, as in this study, it is impossible to achieve an AUC value of 1 because absences (hence false positives) are unknown. The maximum achievable AUC in a presence-only framework is equal to 1 − a/2, where a is generally the fraction of the study area covered by fire (i.e., the prevalence). For the sake of adjusting the AUC value, we considered a to be the percentage of 1 km2 pixels where fire was observed. This provides a fair, yet underestimated, approximation of prevalence. Additional evaluation metrics are provided in table C1.
Assessment of anthropogenic influence
The contribution of each of the four variable categories (climate, enduring features, lightning, and anthropogenic influence) for each hexel was calculated from the full model by summing the relative importance of the variables in each category. Variable importance was calculated as the model gain associated with each variable (Phillips et al 2006). Although it was impossible to compute an absolute measure of variable importance, this could be approximated by comparing the values to the model performance metrics (e.g., AUC). The relationship of each anthropogenic variable by hexel was then plotted from the results of the LogPopDens, HumanFoot, and RdlsVol models. We use partial dependence plots, which measure the effect of a variable when the value of all other variables are held constant at their means, to statistically control for the effect of non-anthropogenic variables on fire probability. To estimate the effect of this statistical control, bivariate relationships of fire probability as a function of individual anthropogenic variables were also produced.
Results
Overall, models of fire probability as a function of all variables (i.e., the full model) performed well (figure 2). The test AUC averaged 0.776 among hexels, and ranged from 0.672 (hex13) to 0.891 (hex8). AUC values increased, sometimes substantially, when adjusted for prevalence (mean 0.804).
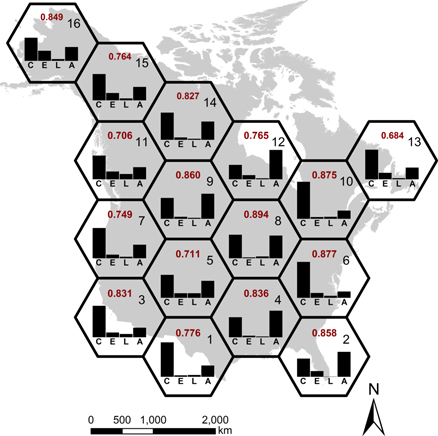
Figure 2. The relative contribution of variables for full models of fire probability by hexel in each of the four variable categories: climate (C), enduring features (E), lightning (L), and anthropogenic influence (A). The value (in red) in the top-center of each hexel represents the adjusted area under the curve (see methods). The y-axis is a percentage and is the same for all plots.
Download figure:
Standard image High-resolution imageThe relative importance of climate, enduring features, lightning, and anthropogenic variables varied substantially among hexels (figure 2). For all hexels, the two most influential categories of variables were climate and anthropogenic. The anthropogenic category was ranked as the most important in four hexels (hex2, hex7, hex9, hex12) and the second-most important in the remaining 12 hexels. Climate was the most frequent dominant control on fire activity, having the highest variable importance in all but four hexels (i.e., the ones dominated by anthropogenic variables). Enduring features ranked third in terms of importance in all hexels except four (hex1, hex5, hex8, hex10), where this category was the least important and lightning had the third-highest contribution. Lightning was otherwise the least important variable. The importance of each anthropogenic variable, calculated both from the full model and models with a single anthropogenic variable, is reported by hexel in table 2. All three anthropogenic variables were useful in explaining fire probability models, but their relative importance varied substantially among hexels.
Table 2. Relative contribution of the three anthropogenic variables for models of fire probability for each hexel. Values were calculated according two to model types: one that incorporates only the anthropogenic variable of interest (single) in combination with the other explanatory variables and the other (full) that incorporates all three anthropogenic variables. LogPopDens, population density (logged); HumanFoot, Human Footprint Index; RdlsVol, roadless volume.
| LogPopDens | HumanFoot | RdlsVol | ||||
|---|---|---|---|---|---|---|
| Single | Full | Single | Full | Single | Full | |
| Hex1 | 30.9 | 11.8 | 4.43 | 5.25 | 29.5 | 6.05 |
| Hex2 | 44.4 | 50.3 | 23.9 | 0.31 | 24.3 | 0.276 |
| Hex3 | 4.65 | 7.97 | 2.54 | 3.23 | 4.39 | 8.37 |
| Hex4 | 44.5 | 34.4 | 44.4 | 15.3 | 75.7 | 4.58 |
| Hex5 | 16.6 | 15.0 | 21.6 | 13.2 | 8.46 | 6.42 |
| Hex6 | 13.9 | 10.2 | 2.12 | 0.764 | 18.8 | 1.84 |
| Hex7 | 14.3 | 12.4 | 16.3 | 11.3 | 15.2 | 4.05 |
| Hex8 | 33.3 | 32.9 | 9.13 | 6.18 | 20.0 | 7.24 |
| Hex9 | 51.5 | 24.2 | 54.3 | 21.3 | 61.3 | 5.19 |
| Hex10 | 6.32 | 3.12 | 9.09 | 8.25 | 10.6 | 5.30 |
| Hex11 | 10.6 | 4.70 | 2.81 | 9.74 | 10.1 | 10.3 |
| Hex12 | 9.91 | 3.52 | 51.6 | 52.7 | 21.5 | 3.83 |
| Hex13 | 14.0 | 5.18 | 7.49 | 6.54 | 29.4 | 12.3 |
| Hex14 | 6.37 | 0.924 | 29.4 | 32.4 | 8.59 | 4.06 |
| Hex15 | 9.07 | 4.86 | 16.0 | 18.0 | 8.77 | 4.55 |
| Hex16 | 2.00 | 5.32 | 25.4 | 20.0 | 4.23 | 3.10 |
| Mean | 19.5 | 14.2 | 20.0 | 14.0 | 21.9 | 5.46 |
The relationship between fire activity and human influence varied as a function of the specific anthropogenic variable, but was overall fairly coherent among hexels. Area burned usually decreased as a function of increasing LogPopDens, except in hexels where there was a strong (hex8) or moderate unimodal response (hex1, hex2, and hex3) (figure 3). The HumanFoot variable had a decaying form in all hexels, though the range of slopes varied considerably (figure 4). The response to the RdlsVol was the most diverse of the three anthropogenic variables (figure 5). Fire activity increased monotonically as a function of RdlsVol in some hexels (hex3, hex4, hex5, hex6, hex7, hex13), decreased in some hexels (hex10, hex12, hex15, hex16), and was unimodal in others (hex3, hex8, hex9, hex14). The bivariate relationship between fire activity and anthropogenic variable show broadly similar patterns to the partial dependence plots (figure D1).

Figure 3. Partial dependence plots of the modeled response of fire probability as a function of log10 of population density. The red line indicates the mean response, whereas the blue areas represent the standard deviation calculated from the 100 model subsets. Note that the x-axes are variable among hexels and its values have been scaled from 0 to 100 for ease of visualization; the y-axis is the same for all hexels.
Download figure:
Standard image High-resolution image
Figure 4. Partial dependence plots of the modeled response of fire probability as a function of Human Footprint Index. The red line indicates the mean response, while the blue areas represent the standard deviation calculated from the 100 model subsets. Note that x-axes are variable among hexels; the y-axis is the same for all hexels.
Download figure:
Standard image High-resolution image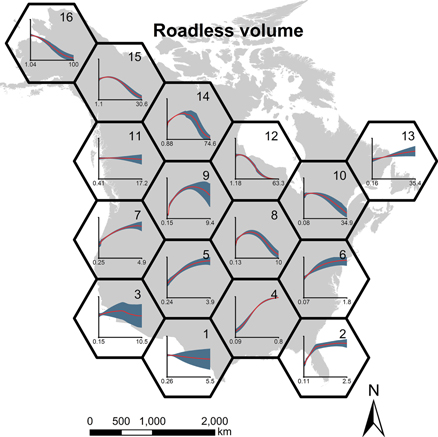
Figure 5. Partial dependence plots of the modeled response of fire probability as a function of roadless volume. The red line indicates the mean response, while the blue areas represent the standard deviation calculated from the 100 model subsets. Note that x-axes are variable among hexels and its values have been scaled from 0 to 100 for ease of visualization; the y-axis is the same for all hexels.
Download figure:
Standard image High-resolution imageDiscussion
Because of its extensive wildlands and low human densities over much of its territory, North America is often viewed as having fire regimes that are closer to natural than those in other parts of the world (Lavorel et al 2007). Although this may hold true to some degree, Cardille and Lambois (2010) have shown in the conterminous US that, even in seemingly 'intact' areas, very few landscapes are completely free of some human imprint. The results of this study similarly suggest that the human impact on fire regimes is widespread and pervasive. Climate is nevertheless the dominant environmental control on fire in most of North America, thereby supporting the claim that its fire activity today—as it has been for millennia—is mainly regulated by top-down controls (Swain 1973, Flannigan et al 2005, Guyette et al 2012). There are clearly, however, other 'non-natural' controls that exert an influence on fire, even overriding the effect of climate in some portions of the continent, as shown by Hawbaker et al (2013) in the conterminous US. We found a non-negligible impeding influence of humans on fire, even in some of the least densely populated areas. Though our results show a remarkably coherent negative influence of humans on fire, the specific nature—and hence outcome—of the human–fire relationship is far from uniform. A potentially interesting exception to the negative effect of people on fire is observed in some of North America's most remote areas where, despite the lack of humans, we saw little fire activity.
One of the most surprising aspects of this study's results is the relatively strong influence of humans on fire activity across North America. Anthropogenic effects were usually substantially greater than enduring features and lightning, and even greater than climate in some areas. Our expectations were that more sparsely populated parts of the continent would have a relatively lower anthropogenic effect on fire. As shown in all of the boreal hexels (hex10, hex12, hex13, hex14, hex15, hex16), this expectation did not bear out. More aligned with our expectations was the high anthropogenic impact of the Midwest (hex4, hex8), Great Plains (hex5, hex9), and Gulf of Mexico (hex2, hex4), areas that have undergone widespread land conversions and that are at a more advanced stage of anthropogenic fire-regime transformation (Guyette et al 2002, Bowman et al 2011). By contrast, some heavily human-altered hexels of the conterminous US show an unexpectedly moderate effect of humans on fire activity, perhaps because climate is simply much more dominant than other environmental controls. This may be the case in coastal California (hex3), where a clear anthropogenic effect (Syphard et al 2008) may be masked by strong climate forcing (Moritz et al 2010).
Any large-scale effect of population density on fire activity can be confounded by the type of human activities on the landscape (Hawbaker et al 2013). For example, the culture of prescribed burning in the southeastern US and, more recently the tolerance of lightning-ignited fire in some of the protected areas in western North America, may be idiosyncratic and not found elsewhere at similar population densities. Overall, our results agree with those of Knorr et al (2014) and Hantson et al (2015), who found a globally negative relationship between fire and population density, and are coherent with the conclusions of Marlon et al (2008) and Mouillot and Field (2005), who reported a decrease in area burned in relation to increased population trends in boreal and temperate biomes. As observed in this study, Bistinas et al (2013) found this relationship to be spatially variable, but there are discrepancies in the direction of relationships (positive and negative) between the two studies. In some parts of the continent (southwestern US, Florida, and the Great Lakes area), we observed the unimodal relationship reported by Syphard et al (2007), whereby the peak in fire ignitions occurred at intermediate population densities, suggesting that both intense human activity and the near absence of humans is associated with fewer fires. We also observed that the per capita effect of humans on fire activity varies widely across North America. Notably, in the boreal zone we found a non-negligible human impact on fire activity in spite of that region's low population densities. This may be due in part to the spatially expansive nature of human features and policies of aggressive fire suppression (Cumming 2005, Martell and Sun 2008). In this region, the effects of humans on fire are spatially structured, in that most fires are ignited by humans close to roads, but it is the remote lightning-ignited fires that are responsible for the majority of the area burned (Gralewicz et al 2012).
While many large-scale wildland fire studies may include a single variable describing anthropogenic impacts on fire (e.g., Krawchuk et al 2009, Bistinas et al 2013), we included three conceptually different variables to capture varying aspects of the fire–human relationship. We were expecting the Human Footprint Index, which accounts for land use and infrastructure in addition to population density, to have a different relationship with area burned compared to population density. Results, however, show that population density and the Human Footprint Index have a remarkably similar (negative) relationship with fire. This provides further support to the idea that, at the spatiotemporal frame of this study, the anthropogenic factors that impede fire activity (e.g., suppression, landscape fragmentation) outweigh those that promote it (e.g., ignitions) in North America. Our third index, the roadless volume, tells a somewhat different story, and therefore we caution against using a single index to measure human influence on fire regimes. Even our use of multiple indexes can probably not describe all important human impacts. For instance, the invasion of exotic cheatgrass species (Bromus spp.) have profoundly modified fire regimes in parts of the western US (Balch et al 2013, Parks et al 2015), but are not fully captured by our three indexes. The same could be said for the effect of past fire management policies on current fire activity, given that these have likely altered the nature of the fire−environment relationship in some areas (Higuera et al 2015, Ruffault and Mouillot 2015).
The roadless volume represents a more accurate depiction of the degree of isolation from human activities than the population density and the Human Footprint Index. That is, the 'stretch' of values in this metric is more heavily weighted towards the distance from roads (i.e., low-impact areas), translating into a more diverse set of human−fire relationships. Much of the northern and western parts of North America, for instance, show a unimodal response of fire to roadless volume, which suggests less fire in the most isolated areas (mainly protected areas) compared to areas of moderate-to-high remoteness. These results are consistent with what Parisien et al (2012) reported in the western US; however, our results show that a single response for the western US masks the variability in the fire responses across such a large area. Notwithstanding, there is a relative decrease in fire probability in some of the most remote areas of some hexels. Reasons why some remote areas may have experienced relatively less fire than adjacent anthropogenized areas may be due to differences in fire environments, past fire-management policies, or simply that there have experienced comparatively fewer ignitions (Cardille et al 2001, Miller et al 2012, Haire et al 2013).
We suspect that the unimodal response of fire to human influence (roadless volume) in some areas of North America is the result of ignition limitation, as observed in some studies in California (Syphard et al 2007, Keeley et al 2011) and other parts of the globe (Bradstock 2009, Kraaij et al 2013). Flannigan et al (2005) hinted that this may be the case in the largely uninhabited parts of the lightning-poor boreal zone. Some of the most remote areas of the western US may also be ignition limited simply because they encompass some of the highest mountains and because lightning ignitions are deficient at very high elevations (Dissing and Verbyla 2003) (figure E1). It must be noted that some remote areas may have experienced more fire in the past if they were subjected to frequent burning by humans, but the extent to which these past fire regimes were 'natural' or not is debated and likely varies greatly among areas (Vale 2002, White et al 2011). Nevertheless, in an era of rapid and sometimes drastic change, it is important to evaluate the potential effect of changes in ignition loads, especially given the sensitivity of some ecosystems to changes in fire activity (McWethy et al 2013).
Limitations
As is the case with all modeling studies, this study's results are subject to limitations both in terms of the data and the modeling approach. In spite of our dataset being largely comprehensive, the missing fire data of hex12 (northern Ontario and Manitoba) may have significantly affected the results; therefore, results for this hexel should be interpreted with caution. Although our systematic partitioning of the continent into hexels allows us to see broad patterns in human–fire relationships, comparison among hexels is complicated by the widely varying range of values in the three anthropogenic variables. For example, the maximum value for roadless volume in hex4 (southern Midwest) is lower than the minimum value for in hex16 (Alaska). The dichotomization of the response variable into burn and unburned precluded consideration of areas that burned more than once. Although the fraction of these areas was low for the study time period it may be important to explicitly consider them as fire history atlases are updated with new data in future years. Interpretation may also be complicated by the modeling technique. For instance, even though an effort was made to statistically control for the effects of other variables, the influence of anthropogenic variables may still conflate with non-anthropogenic variables in some parts of North America. This may be the case at the forest/tundra transition characterizing the northernmost band of hexels, for example, where the presumed human influence may be partly masked by other gradients in climate and vegetation.
The difficulty in pinpointing specific mechanisms by which humans affect fire ignition and spread from statistical relationships is further exacerbated by the potential scale-dependence of these relationships. The fire–human relationships reported in this study are not necessarily expected to hold over much smaller or greater spatial extents. For instance, whereas the negative association of wildfire with humans over large areas, such as our hexels, is partly due to greater area burned in some protected areas, this relationship could in fact be positive over areas where humans are responsible for most (or all) of the fire ignitions. Parisien et al (2011) observed a consistently negative response of area burned to the Human Footprint Index at four spatial scales in the boreal forest of Canada. The scale-dependence of the fire–human relationship, however, requires further investigation and, as such, the results of this study should thus not be extrapolated to greatly varying spatio-temporal scales. Humans influence aspects of the fire regime other than fire frequency or area burned. For instance, human-induced changes to the seasonality of fire occurrence, though difficult to detect, may lead to fairly drastic ecological changes in some biomes (Le Page et al 2010). It would be interesting and important to consider other components to paint a more complete picture of human influence on this disturbance process (Whitman et al 2015). Liu and Wimberly (2015), for example, found that humans had a greater impact on fire size than fire occurrence of high-severity burns in the western US.
Except for the percentage of permanent nonfuel, the fire probability models of this study did not explicitly consider vegetation. There is compelling evidence that biota affects spatial and temporal patterns of fire activity (Girardin et al 2013, Terrier et al 2013), and vegetation-related variables have been often incorporated into to large-scale biophysical models of fire (Sturtevant and Cleland 2007, Hawbaker et al 2013, Liu and Wimberly 2015). Although these variables can be very useful in explaining fire activity, they are also highly correlated with climatic gradients at the spatio-temporal scale of study. In fact, Parisien and Moritz (2009) showed there was virtually no loss of model performance when vegetation class was removed from models of fire activity built for the conterminous US that included several climate variables. Information on vegetation is certainly useful in explaining potential feedback mechanisms that can regulate fire occurrence via postfire succession, but this level of detail is beyond the scope of this large-scale study. Another reason for focusing on climate and not incorporating vegetation composition into this study is that it is usually impossible to know the state of the vegetation at the time of burning. This caveat convinced us that, to meet the goal of our study, it was more appropriate to use climatic gradients; however, it must be acknowledged that detailed vegetation information at the time of burn would have likely substantially improved our models.
Conclusion
The results of this study suggest that there may be few truly natural fire regimes in North America today. While this study points to a general impeding effect of people on fire across North America, it also paints a complex picture of anthropogenic effects on fire across the continent—one where fire is as variable as the biophysical environment that defines it. Because of this complexity, the specific mechanisms by which humans alter fire ignition and spread may be difficult, or even impossible, to identify. Further, humans can indeed distort or mask fire–climate relationships, thereby undermining our ability to predict current and future fire activity in a changing climate (Parks et al 2014). Consequently, this study's results should be viewed as another building block towards more in-depth investigations of the spatial variability of human impacts on North American fire regimes. The statistical relationships reported here could, for example, be incorporated into a process-based model to enhance our understanding of changing human–fire relationships (e.g., Thonicke et al 2010). As adaptation and mitigation measures are developed for fire-prone areas, it will become imperative that wildland fire scientists and land managers account for human influences in projections of future fire.
Acknowledgments
This study was partially funded by the Adaptation Program of Natural Resources Canada. We are grateful to Nicolas Mansuy and two anonymous reviewers for constructive comments.
Appendix A
Table A1. List of all variables initially considered for the modeling of fire probability. A subset of variables was selected to build the fire probability models in this study.
| Variable name | Description | Units | Mean (range) |
|---|---|---|---|
| Climate (1981–2010 normals) | |||
| StartFrostFree | Julian date on which the frost-free period begins | Day of year | 135 (0–208) |
| CMI | Hargreave's climatic moisture index | Dimensionless | 299 (0–1754) |
| DegDaysA18 | Degree days above 18 °C | Degree days | 345 (0–3044) |
| GrowDegDays | Degree days above 5 °C (growing degree days) | Degree days | 2081 (0–7643) |
| ChilDegDays | Degree days under 0 °C (chilling degree days) | Degree days | 1358 (0–5339) |
| DegDaysU18 | Degree days under 18 °C | Degree days | 5043 (0–11 539) |
| EndForstFree | Julian date on which the frost-free period ends | Day of year | 271 (0–365) |
| MinTemp | Extreme minimum temperature over 30 years | °C | –35 (–63 to 10) |
| Eref | Hargreave's reference evaporation | Dimensionless | 749 (0–1924) |
| MaxTemp | Extreme maximum temperature over 30 years | °C | 36 (19–53) |
| FrostFree | frost-free period | Days | 136 (0–365) |
| MeanPrecip | Mean annual precipitation | mm | 722 (50–10 149) |
| MeanTemp | Mean annual temperature | °C | 4.9 (–13 to 26) |
| MeanTempCold | Mean temperature of the coldest month | °C | –9.1 (–32 to 22) |
| SumPrecip | Mean summer (May–September) precipitation | mm | 347 (6–3175) |
| MeanTempWarm | Mean temperature of the warmest month | °C | 18.7 (2–38) |
| NumFrostFree | Number of frost-free days | 179.9 (0–365) | |
| SnowPrecip | Precipitation as snow | mm | 154.2 (0–6608) |
| SumPrecip | Summer (June–August) precipitation | mm | 217.5 (0–1678) |
| WintPrecip | Winter (December–February) precipitation | mm | 150.5 (8–3013) |
| RelHumid | Mean annual relative humidity | % | 59.6 (36–85) |
| SumHeatMoist | Summer heat moisture index, calculated as MWMT/(MSP/1000) | °C mm–1 | 89.9 (1–4085) |
| SumTemp | Summer (June–August) mean temperature | °C | 17.3 (1–36) |
| WintTemp | Winter (December–February) mean temperature | °C | –7.7 (–31 to 22) |
| Anthroprogenic | |||
| HumanFoota | Human Footprint Index, an index of human influence for the year 2004 | Dimensionless | 16.5 (0–100) |
| LogPopDensa | Population density for the year 2000 | People km–2 | –0.51 (–4 to 4.3) |
| RdsDensb | Road density using 2014 roads data with only primary and secondary roads used | Roads area–1 | 0.11 (0–4.3) |
| RdlsVolc | Roadless volume | km3 | 6.5 (0–100) |
| Enduring | |||
| HeatLoadIndex | Heat load index, an index calculating the southwestness of a slope | Dimensionless | 0.64 (0.096–1.03) |
| SurfAreaRatio | Surface area ratio | Dimensionless | 8178 (8100–42 944) |
| TopoPosIndex | Topographic position index calculated at 2000 m scale | Dimensionless | –0.34 (–489 to 843) |
| PctNonfuelc | Percent nonfuel. Non-fuel classified as barren lands, water, snow, and ice. From 2005 land cover. | % | 4.5 (0–99.7) |
| GPP | Gross primary productivity from 2014 | kg_carbon m–2 | 7144.6 (0–35 508) |
| Lightning | |||
| Lightning | Average number of lightning strikes per year from 1995 to 2005 | Flashes km–2 year–1 | 5.9 (0–46.4) |
| Fire | |||
| Area burned | US fires merged with Canadian fires. US fires from MTBS database 1984–2014. Canadian fires from Canadian National Fires database 1984–2014. Fires >400 ha used. | ha | 5311 (400–2 205 060) |
aVariables calculated at 1 and 100 km2 scale. bVariables calculated at 10, 50, and 100 km2 scale. cVariables calculated at 100 and 10 000 km2 scale.
Appendix B

Figure B1. Map of the explanatory variables incorporated in the statistical models of fire probability for each hexel.
Download figure:
Standard image High-resolution imageAppendix C
Model evaluation erlaa3227t4followed the method of Parisien et al (2012) and was performed on each of the 100 subset models and subsequently averaged for each hexel. As a measure of overall of model performance, the AUC was computed from the true positives and false positives. AUC values may range from 0.5, where prediction accuracy is no better than if samples were randomly selected, to 1, which indicates perfect classification accuracy. However, in a presence-only framework, as in this study, it is impossible to achieve an AUC value of 1 because absences (hence false positives) are unknown. The maximum achievable AUC in a presence-only framework is equal to 1 – a/2, where a is generally the fraction of the study area covered by fire (i.e., the prevalence). For the sake of adjusting the AUC value, we considered a to be the percentage of pixels where fire was observed. This provides a fair, yet underestimated, approximation of prevalence. Also calculated were the estimated fraction of the suitable (i.e., burnable) area, which represents an approximation of the false positive rate, and the omission, which is the false negative rate. These two metrics were measured at the fire probability threshold that minimizes the sum of these errors of the two metrics (Liu et al 2005). As such, they can be interpreted as the expected rate of false negatives for a given predicted suitable area.
Table C1. Performance metrics of the fire probability model for each hexel (see figure 1).
| Test AUC | Adjusted AUC | Suitable area (%) | Omission error (%) | |
|---|---|---|---|---|
| Hex1 | 0.752 | 0.776 | 0.370 | 0.247 |
| Hex2 | 0.831 | 0.858 | 0.293 | 0.172 |
| Hex3 | 0.797 | 0.831 | 0.333 | 0.191 |
| Hex4 | 0.827 | 0.836 | 0.231 | 0.273 |
| Hex5 | 0.700 | 0.711 | 0.295 | 0.411 |
| Hex6 | 0.881 | 0.877 | 0.249 | 0.118 |
| Hex7 | 0.701 | 0.749 | 0.424 | 0.281 |
| Hex8 | 0.891 | 0.894 | 0.211 | 0.115 |
| Hex9 | 0.839 | 0.860 | 0.298 | 0.167 |
| Hex10 | 0.837 | 0.875 | 0.308 | 0.155 |
| Hex11 | 0.700 | 0.706 | 0.394 | 0.315 |
| Hex12 | 0.704 | 0.765 | 0.539 | 0.154 |
| Hex13 | 0.672 | 0.684 | 0.507 | 0.192 |
| Hex14 | 0.746 | 0.827 | 0.501 | 0.094 |
| Hex15 | 0.715 | 0.764 | 0.487 | 0.184 |
| Hex16 | 0.818 | 0.849 | 0.343 | 0.137 |
| Mean | 0.776 | 0.804 | 0.361 | 0.200 |
Appendix D

Download figure:
Standard image High-resolution image
Download figure:
Standard image High-resolution image
Figure D1. Modeled fire probability as a function of the three anthropogenic variables obtained from bivariate models (i.e., area burned as a single anthropogenic variable, without controlling for the effects of climate, enduring features, and lightning). The red line indicates the mean response, whereas the blue areas represent the standard deviation, calculated from the 100 model subsets.
Download figure:
Standard image High-resolution imageAppendix E

Figure E1. The relationship between roadless volume (x-axis) and lightning density (y-axis), as used in the statistical models of fire probability. The red line indicates the fit between the two variables using a self-fitting generalized additive model. Note that in some of the hexels the most remote areas (high values of roadless volume) have lower ignition densities than in the areas of higher human influence.
Download figure:
Standard image High-resolution image