


Abstract
A potential decline in irrigation due to groundwater depletion or insufficient surface water would not only directly affect agriculture, but also could alter surface climate. In this study we investigated how loss of irrigation affects heat wave frequency, duration, and intensity across fifteen heat wave indices (HINs) using a regional climate model that incorporated dynamic crop growth. Averaged across all indices, loss of irrigation increased heat wave frequency, duration, and intensity. In the United States, irrigation effects on heat waves were statistically significant over irrigated cropland for the majority of HINs, but in non-irrigated regions, the effects were significant only for a few HINs. The heat index temperature metrics that include humidity were less sensitive to loss of irrigation due to the trade-off between increased temperature and decreased humidity. Using the same temperature metric but different temperature thresholds resulted in qualitatively similar effects on heat waves. Regions experiencing strong groundwater depletion, such as the southern high plains, may suffer more and longer heat waves with reduced irrigation.
Export citation and abstract BibTeX RIS

Content from this work may be used under the terms of the Creative Commons Attribution 3.0 licence. Any further distribution of this work must maintain attribution to the author(s) and the title of the work, journal citation and DOI.
1. Introduction
Long-term temperature observations have indicated an increased frequency and intensity of heat waves since the 1950s (Gaffen and Ross 1998, IPCC 2007), resulting in higher heat-related mortality and other public health challenges. For example, there were at least 700 excess deaths during the 1995 Chicago heat waves (Semenza et al 1996), and 15 000 excess deaths during the 2003 heat waves in France (Fouillet et al 2006). More frequent and hotter heat waves can also increase heat stress in livestock, wildlife, crops, and forests (Hahn 1999, Ciais et al 2005, van der Velde et al 2010) and therefore affect regional economies and ecosystems (Jolly et al 2005, Reusch et al 2005). Projections of future climate using global climate models suggest more heat waves over nearly all land areas (IPCC 2007, 2012, 2014). Therefore, understanding factors that contribute to heat waves is becoming increasingly important for impact prediction and decision-making.
Human activities are contributing to the increased frequency and intensity of heat waves. Many studies have shown that industrial greenhouse gas emissions increase both global mean temperature and heat index (HI) of heat waves (Tett et al 1999, Karoly et al 2003, Stott et al 2004, Stott et al 2011, Christidis et al 2012), yet land use and land use change can also alter heat waves at the regional scale. Urban heat islands exacerbated the impact of heat waves in the Midwest in 1995 (Kunkel et al 1996) and historical meteorological data indicate that agricultural irrigation raised the dew point temperature during heat waves in Chicago (Changnon et al 2003). With the same air temperature, higher dew point temperature can increase the apparent temperature (Steadman 1984) resulting in greater mortality and severe human health effects (Smoyer 1998, Naughton et al 2002, Conti et al 2005).
Agricultural irrigation has been found to affect climate through changes to water and energy cycles (Adegoke et al 2003, Ozdogan and Salvucci 2004, Cook et al 2011, Jin and Miller 2011, Sorooshian et al 2011, Harding and Snyder 2012b). The extra water applied to the soil enhances evapotranspiration, thereby reducing surface temperature through evaporative cooling (Kueppers et al 2007, Lobell et al 2009, Sacks et al 2009) increasing near surface humidity and precipitation in the regions where atmosphere and soil moisture are strongly coupled (DeAngelis et al 2010, Harding and Snyder 2012a).
These effects would be expected to reverse under scenarios of water resource declines due to ground water depletion (Famiglietti and Rodell 2013) in major irrigated agricultural regions. Irrigation water withdrawals increased from 1950 to 1980 by more than 68% and then decreased and from 1985 to 2005 by 17%, consuming 28% of surface water and 67% of groundwater withdrawals in the United States (US) in 2005 (http://water.usgs.gov/edu/wuir.html). In the Southern High Plains, 35% of the area will be unable to support irrigation within the next 30 years under current ground water depletion rates (Scanlon et al 2012). Besides the ground water depletion, surface water decline in drought years also results in loss of irrigation, for example in California's Central Valley. Studying effects of irrigation loss on heat waves is especially important for these drought years due to enhanced risks to ecosystems already degraded by water withdrawals (Scanlon et al 2007). Moreover, there have been few studies of the effects of irrigation on temperature extremes (Lobell et al 2008) and the degree to which irrigation affects heat wave frequency, duration, and intensity has not been studied at continental scales.
In this paper, we analyze the effects of loss of irrigation on heat waves in the contiguous US using a newly coupled regional climate-land surface model (WRF3.3-CLM4crop), which includes a weather-sensitive irrigation scheme and dynamic crop growth. A key issue in prior studies that we've addressed is that the simulation models used to explore irrigation effects typically have prescribed crop leaf area values that do not respond to environmental change. This prescribed approach could overestimate or underestimate evapotranspiration from croplands, depending on time of year, climate variability and crop management, because crop leaf area and physiological activity are known to dynamically respond to environmental variation (Fang et al 2001, Porter and Semenov 2005). In our simulations, crop growth depends on growing season temperatures and soil moisture, capturing interannual variability in crop growth. We also adopted a diversity of heat wave indices (HINs) because variation in definition resulted in different geographic distributions. As pointed out by Smith et al (2013), climate researchers use a statistical quantile from a period of climate data as a threshold to detect heat waves, while health researchers use absolute critical temperature values that could result in human disease or death to determine heat waves. Therefore, we adopted the same fifteen HINs summarized in Smith et al (2013) to quantify responses important both for climate and human health.
2. Methods
We coupled version 4.0 of the Community Land Model that includes crop growth and management (CLM4crop) into the Weather Research and Forecasting model version 3.3 (WRF3.3). The crop growth module calculates the leaf area index (LAI), stem area index, canopy height, and carbon and nitrogen in leaf, stem, grain, and root at each time step based on environmental conditions. The LAI, stem area index, and canopy height are used in hydrology and radiation modules to calculate the energy and water state variables that are transferred into the atmospheric modules. LAI and plant carbon allocation differ according to phenological stage (planting, leaf emergence, grain filling, and harvest). Transitions between phenological stages are controlled by growing degree days (with a base of 8 °C for C3 crops and 10 °C for C4 crops). We used C3 and C4 crop types to represent major crops (e.g., C3 crops: wheat, soybean, and C4 crops: corn, sorghum). C3 and C4 crops differ in their photosynthetic pathways. C3 photosynthesis is more efficient than C4 under cool, moist, and normal light conditions, but C4 photosynthesis is more efficient than C3 under high light intensity and high temperatures. In CLM4crop, C3 (Farquhar et al 1980, Collatz et al 1991) and C4 (Collatz et al 1992) photosynthesis are represented by different parameterizations for stomatal resistance and photosynthesis, and also have different phenological thresholds.
We performed two 10-year (2002–2011) simulations using WRF3.3-CLM4crop to evaluate irrigation effects on heat waves. One is a simulation without irrigation (hereafter referred to as CROP), and the other includes irrigation (hereafter referred to as CROPIRR). The physical modules used in all simulations include the MYNN boundary layer scheme (Nakanishi and Niino 2006), the CAM longwave/shortwave radiation scheme (Collins et al 2004), the new Grell cumulus scheme (Grell and Devenyi 2002), and the Thompson microphysics scheme (Thompson et al 2004). The simulations focused on the continental US with 10 soil layers, 25 atmospheric layers and 50 km horizontal resolution. We interpolated (using the inverse distance weighting method) 0.5° CLM surface input data (including plant functional types, plant function type percent, LAI, and stem area index) into the model domain. We used NCEP/DOE Reanalysis II data as lateral boundary conditions (Kanamitsu et al 2002). The 10-year period included strong (2009–2010), moderate (2006–2007), and weak (2004–2005) El Niño events. For analysis, we removed 8 grid cells from the full perimeter of the domain as a buffer, which diminished the original domain from 109 × 129 to 93 × 113 grid cells. The first two years of the simulations were discarded as spin-up and the analysis focused on the final eight years (2004–2011).
Irrigation water is applied as a function of root water stress (βt), leaf temperature (Tveg) and LAI. Root water stress (βt) is a parameter in CLM that indicates plant water stress, which is a function of a plant wilting factor and the fraction of roots at each soil layer. It varies from near zero (dry) to one (wet). βt is used to calculate the maximum rate of carboxylation in the photosynthesis code. Leaf temperature also is used to more realistically simulate irrigation systems (Howell et al 1984, Wanjura et al 1992) and maintain optimum plant growth, because high leaf temperature can inhibit plant photosynthesis (Wise et al 2004). The irrigation scheme was activated after leaf emergence (LAI > 0.1 m2 m−2), and irrigation is turned on when either root water stress occurs (βt < 0.99) or leaf temperature is too high (Tveg > 35 °C), and is turned off when the above two thresholds are not satisfied. Irrigation is applied in the form of rain over the irrigated cropland based on the irrigation map from (Siebert et al 2005). We tested several different irrigation rates within the range of current irrigation systems (0.004–0.018 L min−1 m−2) and selected a constant rate of 0.0002 mm s−1. We simulated sprinkler irrigation, which accounts for 50% of current US irrigation equipment. The simulated annual irrigation water use is within 14% of US water usage estimated by the USGS for 2005 (Kenny et al 2009). The range in annual simulated irrigation water use from 2004–2006 was 428–564 billion liters per day (541 for 2005); the USGS survey estimated 484 billion liter per day in 2005 (http://ga.water.usgs.gov/edu/wuir.html). Although the irrigation rate is constant, the amount of irrigation has large spatial and temporal variation that depends on how often the soil is below the dry threshold or how often the leaf temperature is above 35 °C at each irrigated grid cell.
Validation of the coupled model for the ten-year simulation is presented elsewhere(Lu et al 2015), but a brief summary is provided here. The coupled model has a warm and dry bias in the Midwest, but the magnitude of the bias is significantly reduced relative to the previous version of the coupled model (Lu and Kueppers 2012). We evaluated LAI, temperature, precipitation, soil moisture, and surface energy fluxes for the simulations used in this study (Lu et al 2015). We found that the dynamic crop growth scheme overestimated peak LAI by 58% on average over three sites, but improved the simulation of interannual variability in LAI (Lu et al 2015). The model simulated a similar increase in LAI due to irrigation as in the site-level observations (29.8% higher modeled versus 29% higher observed). With addition of an irrigation scheme, soil moisture and surface energy flux partitioning also were improved at irrigated sites.
We analyzed irrigation effects on fifteen HINs summarized in Smith et al (2013) table 1 (auxiliary material table S1). We also used the daily mean HI (Schoen 2005) during a heat waves to represent the intensity of the heat wave consistently across all indices because it includes both temperature and humidity effects. The HI is defined as:

where T is temperature and Td is dew point temperature at the lowest atmospheric layer.
We compared 8-year (2004–2011) differences (CROP-CROPIRR) in heat wave frequency (number of heat waves per year), duration (number of consecutive days comprising each heat wave), and intensity (HI value during a heat wave day) to quantify effects of loss of irrigation on heat waves. We discuss statistically significant results based on a student t test (n = 24, which includes JJA over the 8 years, p < 0.05).
We validated simulated heat wave frequency and durations in CROPIRR against PRISM datasets (Daly et al 1997). We calculated heat wave frequency and duration using PRISM 2002–2011 daily temperature for HI01, HI02, HI03, HI04, HI05, HI06, HI07, HI11, and HI12. We didn't validate heat wave intensity for the other HINs because daily humidity data are currently not available in PRISM.
Finally, we performed an analysis for the Southern Great Plains (Kansas, Nebraska, Oklahoma, and Texas) to answer the question: How does gradual reduction in irrigated area and irrigation amount affect heat wave frequency, duration, and intensity? This question cannot be answered by the difference between CROP and CROPIRR, which tells a sudden decline to non-irrigation effects. We understand the gradual reduction irrigation effects by comparing subsets of grid cells with low irrigated area/irrigation amount to subsets with high irrigated area/irrigation amount in CROPIRR. In particular, we assigned all grid cells to seven bins of irrigated area (0%, 0–10%, 10–20%, 20–30%, 30–40%, 40–50%, >50%) and calculated 8-year April–September averages for each bin and variable. Then we evaluated changes in each variable due to irrigation reduction for all pairs of bins. For example, we calculated the ΔT2 when irrigated area was reduced by 20–30% using (50–60% bin—30–40% bin), (40–50% bin—20–30% bin), (30–40% bin—10–20% bin), and (20–30% bin—0–10% bin). Such differences give T2 changes due to both irrigation reductions and spatial variation because the bins occupy different grid cells. To correct for the spatial effects, we use CROP as a reference case, where the differences between bins tell the spatial effects in the absence of any irrigation. To do this correction, we did the same binned calculations for the CROP simulation, using the bin assignments as determined by CROPIRR. We then subtracted the spatial effects. We also repeated the same analysis using six bins (0, 0–1, 1–2, 2–3, 3–4, >4 mm/day) instead of seven for irrigation amount.
3. Results
On average across 9 HINs, the model underestimated heat wave frequency by 0.17 events/year and overestimated heat wave duration by 0.34 days/event. In the Southern Great Plains, the model also underestimated heat wave frequency and duration. The model's warm bias did not lead to overestimates of heat wave frequency and duration for HINs (HI01–HI07) using relative thresholds, but did contribute to overestimates of heat wave frequency (up to 1.51 events/year) and duration (up to 1.58 days/event) in the Midwest and Eastern US for HINs (HI11 and HI12) using absolute thresholds.
Most HINs showed significant irrigation effects on heat waves in California's Central Valley and the Southern High Plains (figure 1). On average across all 15 HINs in the US, loss of irrigation increased heat wave frequency, duration, and intensity by 0.70 events/year, 0.62 days/event, and 0.24 °C. Heat wave frequency and duration was significantly increased without irrigation in California's Central Valley and the Southern High Plains for up to 8 out of 15 HINs (figures S1 and S2), with the greatest increases in the Southern High Plains of up to 3 events/year and 2 days/event for frequency and duration respectively (figures 1(a) and (b)). While heat wave intensity increased due to loss of irrigation on average, there was large spatial variability in intensity changes. For example in the Southern High Plains, seven HINs (HIN01–HIN07) had decreased intensities of 0.2–1.0 °C while 6 HINs (HIN08–10, HIN13–15) had increased intensities of 0.2–1.0 °C (figure S3), yielding an average decrease of 0.2–0.6 °C (figure 1(c)).
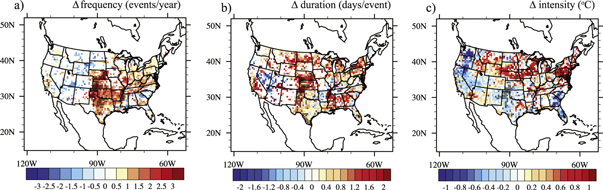
Figure 1. Eight-year (2004–2011) averaged differences (CROP-CROPIRR) in heat wave (a) frequency, (b) duration, (c) and intensity across the heat wave indices showing significant differences (t-test, n = 24, p < 0.05). For grid cells with significant differences in more than one index, we averaged differences across the indices. The stippled areas indicate significant differences in more than five heat wave indices. Significant differences for all heat wave indices are in supplement figure 1–3.
Download figure:
Standard image High-resolution imageDifferent HINs selected different calendar days as heat wave days, so the effects of irrigation loss differed by HIN, and largely related to whether the temperature metric in a HIN included humidity. For the HINs that exclude humidity (e.g., use only mean/min/max temperature), the dominant effect is of increasing heat wave frequency and duration over highly irrigated regions because irrigation loss increased temperature causing more grid cells and more days to exceed temperature thresholds. However, for HINs that adopted humidity related metrics (apparent temperature and HI), there is a trade-off between increased temperature and reduced humidity due to lower evapotranspiration. When dew point temperature (Td) decreases more than T increases, the humidity-related temperature can decrease; otherwise it increases. Such trade-offs limit the number of grid cells with significant changes in heat wave frequency, duration, and intensity with loss of irrigation. Furthermore, this trade-off is also apparent in heat wave intensity calculated for all HINs using a HI (equation (1)). HI is a function (equation (1)) of air temperature (T) and dew point temperature (Td), and increases with higher T and Td. Td is always lower or equal to T depending on humidity; the dryer the air, the lower Td. Td equals T when relative humidity (RH) is 100% (extremely wet). In other words, higher RH means higher Td. So reduced humidity could reduce the Td and HI. Whether HI increases or decreases with reduction in irrigation depends on the trade-off between decreasing Td (humidity) and increasing T. For example, for HIN01, heat wave intensity decreased by 0.08 °C due to a reduction in Td of 0.45 °C even though T increased by 0.25 °C. For HIN08, heat wave intensity increased by 0.42 °C due to increased T of 1.55 °C, even though Td decreased by 1.53 °C.
Loss of irrigation yielded divergent effects on the fifteen HINs as initially irrigated area increased (figure 2). Most HINs were more strongly affected as initially irrigated area increased, and effects were strongest with irrigated area >50%. A few indices (H13–H15) were generally insensitive to the initially irrigated area. In intensively irrigated cropland (irrigated percent >50%), loss of irrigation increased heat wave duration by 0.1–2.6 days/event across all HINs. While loss of irrigation reduced heat wave frequency by 0.1–1.0 events/year for 3 HINs, it increased frequency by 0.1–4.2 events/year for the other 12 HINs. Heat wave intensity decreased by 0.05–1.8 °C for 7 HINs but increased by 0.05–0.8 °C for the other 8 HINs.
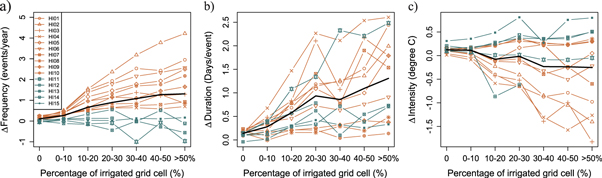
Figure 2. Eight-year (2004–2011) averaged differences (CROP-CROPIRR) in heat wave (a) frequency, (b) duration, and (c) intensity for fifteen heat wave indices as irrigated cropland percentage increases. Indices using relative versus absolute thresholds are colored orange and green, respectively. The black line indicates the average over the 15 indices.
Download figure:
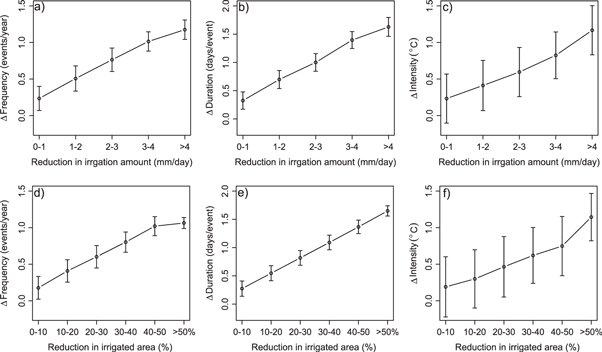
Standard image High-resolution imageWe found a gradual increase in heat wave frequency, duration, and intensity with gradual declines in irrigation amount (figures 3(a)–(c)) or irrigated area (figures 3(d)–(f)) in the Southern Great Plains. With a small reduction in irrigated area of 0–10% or in irrigation amount of 0–1 mm/day, heat wave frequency, duration, and intensity increased by 0.18 or 0.24 events/year, 0.27 or 0.33 days/event, and 0.19 or 0.23 °C (averaged across all fifteen HINs). For the same reduction in irrigated area or irrigation amount, increases in heat waves vary with the initial condition. For example, moderately irrigated regions (<30%) have higher increases in heat wave frequency (0.26 versus 0.09 events/year), duration (0.36 versus 0.18 days/event), and intensity (0.24 versus 0.14 °C) than intensively irrigated regions (>30%), with 0–10% decline in irrigated area.
Figure 3. 2004–2011 averaged changes in heat wave (a) frequency, (b) duration, and (c) intensity with reduction in irrigation amount, and changes in heat wave (d) frequency, (e) duration, and (f) intensity with reduction in irrigated area in the Southern Great Plains (Kansas, Nebraska, Oklahoma, and Texas). The error bars show the propagated standard errors of the mean changes.
Download figure:
Standard image High-resolution image
4. Discussion and conclusions
Our primary goal was to evaluate how loss of irrigation in currently irrigated agricultural areas affects heat wave frequency, duration, and intensity across a diversity of climatological and health-related HINs. Effects were statistically significant for the majority of HINs over irrigated cropland, but the effects were significant only for a few of the HINs in non-irrigated regions. Effect size, and in some cases sign, varied across the fifteen HINs evaluated. However, on average across all HINs, loss of irrigation increased heat wave frequency, duration, and intensity in our model. These effects were amplified as the percent of land area that was irrigated in a model grid cell increased. With partial irrigation reduction, effects were smaller, but the patterns were consistent.
The Southern High Plains are most likely to suffer more and longer heat waves if there is a reduction in irrigation due to groundwater depletion. Although both California's Central Valley and the Southern High Plains are both experiencing groundwater deficits (Famiglietti and Rodell 2013) and they both displayed significant changes in heat waves with loss of irrigation, Scanlon et al (2012) suggested that the groundwater in the Central Valley is renewable through artificial recharge with excess surface water. However, in the Southern High Plains, 35% of the area will be unable to support irrigation within the next 30 years under current depletion rates (Scanlon et al 2012). Our results indicate that such declines in irrigation will lead to an increase in heat wave frequency and duration, exacerbating anticipated increases in temperature due to global climate change. Therefore, sustainable irrigation and adaptation are required in these regions not only to overcome direct drought damages, but also to diminish the potential climate consequences of less irrigation.
Potential loss of irrigation resulted in more frequent, longer, and severe heat waves, which could result in more mortality and agricultural failures. We found that the most significantly affected areas (sum of the stippled area in figures 1(a)–(c)) are in Texas, Kansas, Nebraska, and California, where irrigated area is greatest. Nearly 35 million people live in counties sensitive to heat wave increases with irrigation decline, mostly in California and Texas. Tan et al (2007) found mortality was strongly correlated (r = 0.83) to heat wave duration by comparing heat waves in Shanghai, China. Palecki et al (2001) found increased heat-related deaths in 1995 relative to 1999 in St. Louis partially due to the longer duration of the 1995 event. With up to 2 days/event longer duration without irrigation, heat-related mortality is a concern in six counties (Fresno, Kern, Madera, Merced, Stanislaus, and Tulare) in California's Central Valley and many other counties in the Southern High Plains based on a county level comparison to the spatial distribution of heat wave effects. In terms of agricultural failures, loss of irrigation could directly lead to abandonment of some currently irrigated cropland and reduce crop yield and production due to heat stress. Schlenker and Roberts (2009) found that crop yields decline when temperatures rise above certain thresholds, and Deryng et al (2014) found that extreme heat stress during anthesis under the RCP 8.5 climate scenario could reduce maize, spring wheat, and soybean production.
Using fifteen different HINs extended our understanding of how loss of irrigation affects heat waves. In particular, whether the HI temperature metric includes humidity has a large impact on the index's sensitivity to irrigation loss because of the trade-off between increasing temperature and decreasing humidity. For example, loss of irrigation decreased heat wave intensity for HIN01–HIN04 (mean daily temperature metric) but increased heat wave intensity for HIN08–10 (maximum daily apparent temperature metric). Using the same temperature metric but different temperature thresholds resulted in qualitatively similar irrigation effects on heat waves. For example, loss of irrigation increased heat wave frequency for HIN01–HIN04 significantly in California's Central Valley and the Southern High Plains, although the magnitude decreased as the temperature thresholds increased. Finally, we found that climatological HINs (i.e., the relative indices) are generally more sensitive to irrigation than the health related indices (i.e., the absolute indices) (figure 2). Climatological indices were significantly affected over wider areas, and also showed greater consequences from loss of irrigation for heat wave frequency and duration compared to health related indices.
There are several limitations of this study. Due to the model warm bias, the simulated heat wave frequency and duration are higher for HINs using absolute thresholds compared to PRISM data. Whether the overestimated heat wave baselines for HI11–HI15 affects our estimate of irrigation loss effects (difference between CROP and CROPIRR) is unknown. However, evaluation of the coupled model indicated that by implementing dynamic crop growth and irrigation, model performance is improved over prior versions (Lu et al 2015). In addition, we only simulated sprinkler irrigation (not drip or flood) and were unable to consider variability in irrigation systems across US fields, due to lack of data at the continental scale. However, we expect that variation in irrigation approaches is smaller than the difference between irrigated and non-irrigated landscapes. Further, the increase in latent heat flux due to irrigation is comparable to other model results and observations (Sacks et al 2010, Cook et al 2011, Harding and Snyder 2012b). Therefore, although the actual magnitude may differ from what is represented in the model, we believe the pattern of response to loss of irrigation to be qualitatively correct. Our simulations focused on recent years when the model has been extensively validated and used a hypothetical irrigation loss scenario to understand an extreme case for effects on heat waves. We used a spatial analysis to estimate intermediate cases of partial irrigation loss and found consistent, but smaller effects. Direct simulation of gradual irrigation decline in the future would be more realistic, but also will introduce uncertainties in the distribution, rates and magnitude of irrigation loss. This remains an important avenue for future research.
Acknowledgments
We thank UC Merced for summer GRC fellowships and the computing cluster. The work was supported, in part, by USDA AFRI (award number 2012-68002-19872). The coupled model (WRF3.3-CLM4crop) and model outputs used to generate figures are available by contacting the corresponding author.