
Abstract
The biocompatibility and neuron regenerating properties of various bioactive glass (BG)/polyhydroxyalkanoate (PHA) blend composites were assessed in order to study their suitability for peripheral nerve tissue applications, specifically as lumen structures for nerve guidance conduits. BG/PHA blend composites were fabricated using Bioactive glass® 45 S5 (BG1) and BG 1393 (BG2) with the 25:75 poly(3-hydroxyoctanoate/poly3-hydroxybutyrate), 25:75 P(3HO)/P(3HB) blend (PHA blend). Various concentrations of each BG (0.5 wt%, 1.0 wt% and 2.5 wt%) were used to determine the effect of BG on neuronal growth and differentiation, in single culture using NG108-15 neuronal cells and in a co-culture along with RN22 Schwann cells. NG108-15 cells exhibited good growth and differentiation on all the PHA blend composites showing that both BGs have good biocompatibility at 0.5 wt%, 1.0 wt% and 2.5 wt% within the PHA blend. The Young's modulus values displayed by all the PHA blend/BG composites ranged from 385.6 MPa to 1792.6 MPa, which are able to provide the required support and protective effect for the regeneration of peripheral nerves. More specifically, the tensile strength obtained in the PHA blend/BG1 (1.0 wt%) (10.0 ± 0.6 MPa) was found to be similar to that of the rabbit peroneal nerve. This composite also exhibited the best biological performance in supporting growth and neuronal differentiation among all the substrates. The neurite extension on this composite was found to be remarkable with the neurites forming a complex connection network.
Export citation and abstract BibTeX RIS

Original content from this work may be used under the terms of the Creative Commons Attribution 4.0 license. Any further distribution of this work must maintain attribution to the author(s) and the title of the work, journal citation and DOI.
1. Introduction
After injury, peripheral nerves are able to regenerate spontaneously as a result of the action of Schwann cells, promoting a favourable environment for axonal growth. However, the regeneration and recovery of nerve function depends on the injury gap length and the type of lesion. Suturing of the two stumps (i.e. end-to-end suture) is a suitable and common method to bridge small gaps (less than 2 mm). For larger gaps, nerve regeneration is severely impeded and the repair of nerve tissue requires nerve grafting with an autologous nerve graft being accepted as the 'gold standard' procedure [1]. However, common complications of autografting such as additional surgery, loss of nerve function, donor site morbidity and scar tissue formation limit the success of patient recovery.
Bioartificial tubular devices, widely known as nerve guidance conduits (NGCs) are a promising alternative to autografting. Neural tissue regeneration based on NGCs prevents additional surgical intervention required to harvest autologous nerves and thereby less surgical trauma is inflicted. Moreover, fibrous scar tissue infiltration is reduced, whereas the accumulation of soluble factors is maximized. In addition, the use of NGCs avoids mismatched fascicles between the injured nerve and the autograft [1]. In addition to biocompatibility, a bioresorbable NGC has to be a mechanically robust device, which combines good flexibility with compressive resistance, preventing compression of the growing nerve tissue or collapse of the tubular structure. There are several commercial NGCs made from natural and synthetic materials, such as poly(L-lactide-co-caprolactone) (PLCL), poly(glycolic acid) (PGA), poly(vinyl alcohol) (PVA), collagen type I and extracellular matrix [2]. The regeneration outcomes achieved with the current NGCs are comparable with the autologous nerve graft only for short gaps (less than 10 mm). For longer nerve defects, i.e. critical gaps, autografting performs better when compared with NGCs.
Hence, the main focus of further progress in NGCs is the development of intraluminal architecture. Modifications in the lumen of NGCs have been shown to enhance nerve regeneration in vitro and in vivo [1]. A range of different types of internal structures serving as physical cues have been explored including grooves, random and aligned fibres to guide neuronal growth, reducing neurite misdirection [1, 3, 4]. Both synthetic and natural polymers have been used for the manufacturing of these internal structures. However, with recent advances in applications of inorganic bioactive glasses (BGs) in soft tissue engineering [2], BGs have recently been studied in nerve tissue regeneration [5]. Despite the intrinsic brittleness of BGs, interest in their application for nerve regeneration is driven by their proven biological activity due to the leaching of bioactive ions. In contrast, polymers provide good support for cell growth, but they do not exhibit such an inherent release of factors with biological activity. Hence, BGs can not only enhance cell adhesion through the formation of a hydroxyapatite (HA) layer, but release ions that can trigger cell signalling processes that favour tissue regeneration [3].
Various types of BGs have been shown to have regenerative properties in a neuronal context. For example, Bioactive glass® 45S5 fibres are biocompatible with rat Schwann cells and fibroblasts in vitro, and have been shown to promote axonal regeneration in vivo [6]. Phosphate glass fibres are biocompatible with the neonatal olfactory bulb ensheathing cell line [1, 7] and dorsal root ganglion (DRG) neurons [7, 8]. In addition, these fibres provide a directional cue for growing axons [1, 7]. Moreover, bioactive borate glass scaffolds have not only shown biocompatibility with embryonic chick DRG, but have been shown to support neurite extension [9]. Mohammadkhah et al [10] fabricated composites using different BG compositions consisting of 50 wt% polycaprolactone (PCL) combined with 50 wt% 1393 B3 borate glass; 50 wt% 45S5 silicate glass and with a blend of 25 wt% 1393 B3 and 25 wt% 45S5 silicate glass. The resulting composites were found to be compatible with DRG neurons isolated from embryonic chicks and had a positive effect on neurite outgrowth [10]. In order to overcome BG brittleness, both BG fibres [11] and BG particles [12] were embedded into polymeric matrices.
Herein, we have designed bioresorbable hybrid composites by combining a blend of bioresorbable polyhydroxyalkanoates (PHAs) with particulate BGs. BG/PHA blend composites were fabricated using Bioactive glass® 45S5 (BG1) and BG 1393 (BG2) with the 25:75 P(3HO)/P(3HB) blend. We extend our previously reported work [13] in the development of flexible PHA blends, which were highly biocompatible with neuronal cells and thereby provided good support for the growth of nerve tissue. Here, we demonstrate that adding BGs as fillers to a 25:75 poly-3-hydroxyalkanoate/poly-3-hydroxybutyrate, 25:75 P(3HO)/P(3HB) (PHA blend) has a further positive effect on the growth and differentiation of RN22 Schwann and NG108-15 neuronal cells. This effect depends on the BG content, confirming the biological activity of BGs incorporated in the bioresorbable polymer matrices. Quite counter-intuitively, the introduction of BGs decreased the stiffness of the PHA blends. This combination of suitable mechanical properties and enhanced ability to support growth and differentiation of neuronal cells confirmed the possible application of these highly bioactive composite scaffolds as a lumen coat within the bioresorbable NGCs, to be used for critical gap repair.
2. Materials and methods
2.1. Production and extraction of poly(3-hydroxyalkanoate) and poly(3-hydroxybutyrate)
The production, extraction, purification of both PHAs, P(3HO) and P(3HB), and the determination of lipopolysaccharides was carried out as previously described [13]. Briefly, P(3HO) and P(3HB) were produced through bacterial fermentation using Pseudomonas mendocina and B. cereus SPV followed by soxhlet extraction.
2.2. Production and composition of BGs
The BGs were produced by the conventional glass melting method and subsequent milling to obtain micrometric-sized powders. The production of BG1 and BG2 is described in previous studies [14, 15]. Scanning electron microscopy (SEM) micrographs showing the morphology of the used glass powders BG1 and BG2 are presented in the supplementary information, figure S1 (stacks.iop.org/BMM/15/045024/mmedia). The chemical composition of BG1 and BG2 is shown in table 1.
Table 1. Chemical composition of BG1 and BG2.
| Bioactive glass | Composition (wt%) |
|---|---|
| BG 45S5 | 45 SiO2, 24.5 CaO, 24.5 Na2O, 6 P2O5 |
| BG 1393 | 53 SiO2, 20 CaO, 6 Na2O, 4 P2O5, 12 K2O, 5 MgO |
2.3. Composite film preparation
This study focuses on the evaluation of cellular response towards PHA-based composites, which was conducted on planar surfaces. Films of PHA blend along with BG1 and BG2 were prepared using the solvent casting method [13]. The PHAs were dissolved in chloroform (Sigma-Aldrich, Gillingham, UK) in order to obtain a total polymer concentration of 5 wt/vol% of the 25:75 P(3HO)/P(3HB) blend. After polymer dissolution, the required amounts of each BG introduced into the polymer solution to obtain formulations containing 0.5 wt%, 1.0 wt% and 2.5 wt% of BG with respect to the PHAs. BGs were dispersed by sonication using a probe sonicator. The polymer solutions containing dispersed BGs were cast in 6 cm glass petri dishes. The films were air dried and produced in triplicate in order to obtain a total of 21 films including the control 25:75 P(3HO)/P(3HB) blend. In addition, films of PCL, an established biocompatible and bioresorbable polymer, were used as a control polymeric material. The PCL was provided by Vornia Biomaterials Ltd (Dublin, Ireland). The PCL contained a methyl ether polyethylene glycol block, which was used as an initiator in the ring opening polymerisation of caprolactone. This block made PCL relatively more hydrophilic. PCL films were prepared, as described above, for composite films using 5 wt% PCL solution in chloroform. All polymer films were aged for 5 weeks at room temperature. During this period, crystallization of the polymers was expected to be completed for all samples [16].
2.4. SEM of PHAs/BG composites
The surface topography of the films and PHA/BG composites was analysed using an FEI XL30 Field Emission Gun Scanning Electron Microscope (FEI, Netherlands). All the samples were previously sputter coated with a 20 nm film of palladium using a Polaron E5000 sputter coater. The operating pressure of the sputter coating was 5 × 10⁻⁵ bar with a deposition current of 20 mA for a duration of 90 s. The images were then recorded and the diameters of the pores were measured at different magnifications at 5 kV using the FEI software.
2.5. Profilometric surface analysis
The surface roughness of the films was analysed using a Sony Proscan 1000 Laser Profilometer (Sony, Japan) with a measuring range of 400 μm, resolution of 0.02 μm and maximum output of 10 mW. Scans of 0.5 mm2 were obtained from each sample. Nine random coordinates were selected from each specimen in order to measure the root mean square (RMS) roughness (Rq) defined as the RMS average of the profile height deviations from the mean line. The formula defining Rq is as follows:
where n is the number of intersections of the profile at the mean line (intersections) and γ the profile slope at the mean line (°) [17].
2.6. Surface wettability of the films
The wettability of the films was measured by using a KSV Cam 200 goniometer (KSV, Finland). About 200 μl of deionized water was dropped onto the surface of the films using a gas-tight micro-syringe. As soon as the water droplet made contact with the sample, a total of ten images was captured with a frame interval of one second. The analysis of the images was performed using the KSV Cam software. For each sample, three random points were analysed to obtain a total of nine measurements for each type of film.
2.7. Mechanical properties
Tensile testing was carried out using a 5942 Instron Testing System (High Wycombe, UK) equipped with a 500 N load cell at room temperature. The test was conducted using films of 5 mm width and 3.5–5 cm length. The deformation rate was 5 mm min−1. The average values for five specimens were calculated.
2.8. Differential scanning calorimetry (DSC)
Thermal transitions for the composites were characterized using a DSC 214 Polyma (Netzsch, Germany), equipped with an Intracooler IC70 cooling system. Scanning was conducted between −70 °C and 200 °C at a heating rate of 10 °C min−1 under the flow of nitrogen at 60 ml min−1. The enthalpy of fusion for P(3HB) was normalised to the weight fraction of P(3HB) in composites or a polymer blend.
2.9. NG108-15 neuronal and RN22 Schwann cell culture
The NG108-15 cell line is a hybrid of mouse neuroblastoma and rat glioma, whereas RN22 Schwann cell is a rat origin cell line. Cells were grown in Dulbecco's modified eagle medium (DMEM) under a humidified atmosphere of 5% CO2 at 37 °C (DMEM) (Sigma-Aldrich, Gillingham, UK), supplemented with 10% (v/v) fetal calf serum (Sigma-Aldrich, Gillingham, UK), 1% (w/v) glutamine (Sigma-Aldrich, Gillingham, UK), 1% (w/v) penicillin/streptomycin (Sigma-Aldrich, Gillingham, UK), and 0.5% (w/v) amphotericin B (Sigma-Aldrich, Gillingham, UK). Cells were only used in experiments once they were 80% − 90% confluent. For culture of NG108-15 neuronal cells, 3 × 10⁴ cells were trypsinised and seeded directly onto the PHA film samples within the 12 well plates in 3 ml of DMEM (Sigma-Aldrich, Gillingham, UK). The cultures were maintained for 4 d, with half of the medium being removed and replaced with fresh serum-free DMEM (Sigma-Aldrich, Gillingham, UK) on day 2 to stimulate experimental differentiation. NG108-15 cells were used between passages 10–20 while RN22 Schwann cells were used between passages 15–25. For co-culture with RN22 Schwann cells, 1.5 × 10⁴ of each cell type was trypsinised and seeded in the same well directly onto PHA film samples and the cultures were maintained for 4 d, with half of the medium being removed and replaced with fresh serum-free DMEM (Sigma-Aldrich, Gillingham, UK) on day 2 to stimulate experimental differentiation.
2.10. Live/dead measurement of NG108-15 neuronal cells
After growing cells for 4 d, the culture medium was removed and replaced with fresh serum-free DMEM (Sigma-Aldrich, Gillingham, UK) containing 0.0015% (w/v) propidium iodide (Invitrogen, 55B Bridge Cl, Dartford DA2 6PT, UK) and 0.001% (w/v) Syto-9 (Invitrogen, Dartford, UK) at 37 °C/5% CO2 for 15 min. After washing with phosphate-buffered saline (PBS) (x3), the cells were imaged by confocal microscopy. A helium-neon laser was used for the detection of propidium iodide (λex = 536 nm/λem = 617 nm) (Invitrogen, 55B Bridge Cl, Dartford DA2 6PT, UK) while an argon-ion laser was used for Syto 9 (λex = 494 nm/λem = 515 nm). Three fields-of-view were imaged containing 20–500 cells per sample, so as to express the data as a percentage of live versus dead cells ± standard error of the mean (SEM). The quantification of live and dead cells was performed using Image J [18, 19].
2.11. Immunolabelling of NG108-15 neuronal cells and RN22 Schwann cells
To assess the differentiation of NG108-15, cells were labelled for β III-tubulin (neurite marker). Samples were washed with PBS (x3) (Sigma-Aldrich, Gillingham, UK) and fixed with 4% (v/v) paraformaldehyde (Sigma-Aldrich, Gillingham, UK) for 20 min at room temperature. The cells were permeabilized with 0.1% (v/v) Triton X-100 (Sigma-Aldrich, Gillingham, UK) for 20 min, before being washed with PBS (Sigma-Aldrich, Gillingham, UK) (x3). Unreactive binding sites were blocked with 3% (w/v) bovine serum albumin (BSA) (Sigma-Aldrich, Gillingham, UK) for 30 min, at room temperature, and the cells were incubated overnight with a mouse anti β III-tubulin antibody (1:1000) (Sigma-Aldrich, Gillingham, UK) diluted in 1% BSA (Sigma-Aldrich, Gillingham, UK) at 4°C. In the case of co-cultures, polyclonal rabbit anti-S100β diluted in 1% BSA at 4°C was also added (Schwann cell marker) (1:250) (Dako, Denmark). The cells were washed three times with PBS (Sigma-Aldrich, Gillingham, UK) before being incubated with a Texas Red-conjugated anti-mouse IgG antibody (1:100 dilution in 1% BSA) (Sigma-Aldrich, Gillingham, UK), and for co-cultures, also an FITC-conjugated secondary anti-rabbit IgG antibody (1:100 in 1% BSA) (Vector Labs, USA) for 90 min at room temperature. After washing the cells once with PBS, 4', 6-diamidino-2-phenylindole dihydrochloride (DAPI) (1:500 dilution in PBS) was added to label the nuclei. The cells were then incubated for 30 min at room temperature before being washed again with PBS (x3). The cells were then imaged by using confocal microscopy. Nuclei were visualized by two-photon excitation using a Ti:sapphire laser (716 nm) for DAPI (λex = 358 nm/λem = 461 nm) (Sigma-Aldrich, Gillingham, UK). For imaging the neuronal cell body and neurites of NG108-15 cells, a helium-neon laser (543 nm) was used to detect the Texas Red-conjugated anti-mouse IgG antibody (1:100 dilution in 1% BSA) (λex = 589 nm/λem = 615 nm) (Sigma-Aldrich, Gillingham, UK). For imaging RN22 Schwann cells, an argon ion laser (488 nm) was used to detect FITC (λex = 495 nm/λem = 521 nm) (Sigma-Aldrich, Gillingham, UK). The differentiated cells were then counted using Image J and identified as neuronal cells expressing neurites.
2.12. Statistical analysis
A Shapiro—Wilk and Bartlett's test was previously performed to verify the normality and homogeneity of the data, respectively. To analyse the difference between data, a one-way ANOVA test (p < 0.05) was conducted followed by Turkey's post test (p < 0.05). Data were reported as mean ± SEM.
3. Results
3.1. Structural and mechanical characterisation of composite scaffolds
The selection of a polymer matrix for the preparation of new composites suitable for nerve regeneration was based on our previous study of binary PHA blends combining the rigid and strong P(3HB) with the soft and elastomeric P(3HO) [13]. In that study, the 25:75 P(3HO)/P(3HB) blend was identified as the most promising material for supporting the growth of neuronal cells. Therefore, a blend of this composition was used as a matrix for the preparation of BG composites and is referred to as PHA blend throughout this paper. Two types of BGs, BG1 and BG2 were incorporated into the polymer matrix via processing of polymer solutions in chloroform. The chemical composition of both BGs is shown in table 1. The BGs used in this study are different in chemical composition and also in particle size. The average particle size of BG1 was 5 µm in diameter and had a clearly narrower particle size distribution than BG2 (supplementary information, figure S1). The mean particle size of BG2 was 6 microns [16].
The PHA blend tended to form porous films with an average pore size of 1.6 ± 0.2 µm, uniformly distributed across the film surface (figure 1(M), (N)). Films of PCL were also prepared using the same conditions, to act as another control material. The PCL control film exhibited significantly larger pores with an average diameter of 36.1 ± 3.5 µm (figure 1(O) and (P)). The incorporation of two different BGs into the PHA blend caused dissimilar changes in surface morphology; films of PHA blend/BG2 (figure 1(G)–(L)) composites were notably less porous in comparison to composites filled with BG1 (figure 1(A)–(F)). This was probably related to differences in the distribution of BG particles of different particle size distribution. It is well known that an increase in polydispersity of particles leads to a decrease in void volume when the particles are packed [20]. This is also valid for porous particle-polymer composites [21]. Wider size distribution of the BG2 particles allows denser packing of the BG2 particles in the polymer matrix, resulting in relatively less porous composite films. Generally, the addition of BGs led to larger pores compared to the pores on the PHA blend control. The most developed porosity was achieved for the PHA blend/BG1 (0.5 wt%) and PHA blend/BG1 (2.5 wt%), which showed intricate porous networks with an average pore size of 5.4 ± 0.7 and 3.5 ± 0.3 µm, respectively (figure 1(A), (B), (E), (F)). No relationship was found between the amount of BG and the pore size. It is worth noting that in the context of materials development for internal structures of NGCs, BG additives should allow the maintainance of or even improve the material porosity.

Figure 1. SEM of PHA blend/BG composites and controls. (A), (B) PHA blend/BG1 (0.5 wt%). (C), (D) PHA blend/BG1 (1.0 wt%). (E), (F) PHA blend/BG1 (2.5 wt%). (G), (H) PHA blend/BG2 (0.5 wt%). (I), (J) PHA blend/BG2 (1.0 wt%), (K), (L) PHA blend/BG2 (2.5 wt%). (M), (N) PHA blend. (O), (P) PCL. Scale bar = 100 µm—first and third column; 10 µm—second and fourth column.
Download figure:
Standard image High-resolution imageCompared to the series of PHA blend/BG1 composites, the surface morphology of PHA blend/BG2 composites was less regular with the occurrence of protrusions (figure 1(G)–(L). The protrusions were most likely formed due to the presence of much larger particles in BG2. As a result, the roughness, determined as the RMS roughness (Rq) by laser profilometry, was systematically higher for the PHA blend/BG2 composites (figure 2).
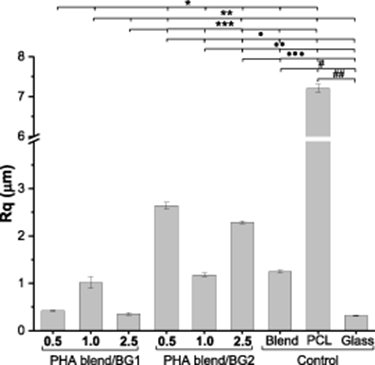
Figure 2. RMS roughness (Rq) of the PHA blend/BG composites and controls. Roughness presented by the PHA blend/BG1composites was lower compared with PHA blend/BG2 composites. Highest roughness value was displayed by the PCL substrate.
Download figure:
Standard image High-resolution imageInterestingly, the roughness of the PHA blend/BG1 (1.0 wt%) and PHA blend/BG2 (0.5 wt%), the least porous samples in each composite series, was higher compared with the more porous samples of the corresponding composite series. The two other control surfaces used in the study provided examples of smooth (0.3 ± 0.0 µm for the glass slide) and highly rough (7.2 ± 0.1 µm for PCL film) surfaces.
As can be seen in figure 2, the roughness of the PHA blend/BG1 (0.5 wt%) was not statistically different to the PHA blend/BG1 (2.5 wt%) and glass (0.4 ± 0.0, 0.4 ± 0.0, and 0.3 ± 0.0 µm, respectively, *p < 0.05). The lowest roughness was displayed by the glass slide control compared to all the substrates. The roughness of the PHA blend/BG1 (1.0 wt%) was not significantly different to that of the PHA blend/BG2 (1.0% w/v) and the PHA blend (1.0 ± 0.1, 1.2 ± 0.1 and 1.3 ± 0.0 µm, respectively, **p > 0.05) and significantly lower than those measured for the PHA blend/BG2 (0.5 wt%) and PHA blend/BG2 (2.5 wt%) (2.6 ± 0.1 and 2.3 ± 0.0 µm, **p < 0.05). The PHA blend/BG composites that displayed the highest roughness were the PHA blend/BG2 (0.5 wt%) (2.6 ± 0.1, p < 0.05) and PHA blend/BG2 (2.5 wt%) (2.3 ± 0.0, p < 0.05). The highest roughness among all the substrates was presented by the PCL control (7.2 ± 0.1 µm, p < 0.05).
Surface hydrophilicity is a simple determinant of cellular response towards biomaterials. Previous studies have shown that cell attachment increases when hydrophilicity increases. These findings have been observed for different cell types such as osteoblasts [22, 23], fibroblasts [24, 25], MadinDarby canine kidney cells [26], mouse osteoblast-like cell line MC3T3-E [25], 7F2 mouse osteoblasts [27] and neurites [28, 29]. PHA/BG composites combine a hydrophobic polymer with hydrophilic fillers; hence, the surface hydrophilic/hydrophobic balance was expected to vary depending on the BG content. The water contact angles were measured for all substrates as a widely used parameter of surface hydrophilicity/wettability (table 2).
Table 2. Water contact angles of PHA blend/BG composites and controls.
| Substrates (wt%) | Water contact angle (°) |
|---|---|
| PHA blend/BG1 (0.5) | 95.7 ± 0.6 |
| PHA blend/BG1 (1.0) | 65.7 ± 1.2 |
| PHA blend/BG1 (2.5) | 65.3 ± 1.4 |
| PHA blend/BG2 (0.5) | 93.5 ± 0.8 |
| PHA blend/BG2 (1.0) | 78.8 ± 0.7 |
| PHA blend/BG2 (2.5) | 67.0 ± 0.7 |
| PHA blend | 77.4 ± 0.8 |
| PCL | 81.9 ± 1.3 |
| Glass | 23.2 ± 0.5 |
In both series of composites there was a significant decrease in surface wettability for composites with the lowest BG content; contact angles of 95.7 ± 0.6° and 93.5 ± 0.8° for PHA blend/BG1 (0.5 wt%) and PHA blend/BG2 (0.5 wt%), respectively, compared with 77.4 ± 0.8° for the control PHA blend.
The materials were further characterised by DSC to evaluate the influence of inorganic fillers in crystallisation and the state of the amorphous phase of semi-crystalline PHAs. DSC thermograms (supplementary information, figure S2) show that composites and the control PHA blend did not exhibit melting of the P(3HO) component. Thus, P(3HO) was not crystallised as a single phase in the P(3HB) matrix. Although the melting temperature of P(3HB) was not affected by the presence of BG, the degree of crystallinity of P(3HB) significantly decreased in the composites with BG1 (table 3) compared with the control PHA blend and the crystallinity gradually decreased with the increase of filler content. On the other hand, it appears that P(3HB) crystallinity was not influenced by BG2: 65.8%, 64.0% and 67.4% for composites containing 0.5 wt%, 1.0 wt% and 2.5 wt% of BG2, respectively, compared to 65.6% for the PHA blend.
Table 3. DSC of PHA blend/BG composites.
| Substrates (wt%) | Tg (°C) | Tm (°C) | Specific enthalpy of melting (kJ/g) | XC, %a | |
|---|---|---|---|---|---|
| Observed | Normalised to P(3HB) | ||||
| PHA blend/BG1 (0.5) | n/d | 177.6 | 59.2 | 79.5 | 54.4 |
| PHA blend/BG1 (1.0) | n/d | 175.1 | 42.0 | 56.8 | 38.9 |
| PHA blend/BG1 (2.5) | n/d | 173.0 | 36.8 | 50.8 | 34.5 |
| PHA blend/BG2 (0.5) | n/d | 174.6 | 71.2 | 95.5 | 65.8 |
| PHA blend/BG2 (1.0) | n/d | 174.3 | 69.2 | 93.5 | 64.0 |
| PHA blend/BG2 (2.5) | n/d | 174.4 | 71.3 | 98.4 | 67.4 |
| PHA blend | n/d | 174.6 | 71.8 | 95.7 | 65.6 |
aThe crystallinity degree of P(3HB) was calculated using the formula  and ΔH0= 146 J g−1 [30].
Interestingly, for all the composites and the PHA blend the glass transition event was not detected (table 3) in the temperature range where the glass transition of P(3HB), the dominant component of the blend (close to 3 °C), would be typically observed. The absence of glass transition indicated that the P(3HB) in the amorphous phase was in a rigid state, which is a vitrified state of the amorphous material [31]. Since the fractions of polymers in an amorphous state (table 3) were significantly higher in the PHA blend/BG1 composites than in the PHA blend/BG2 composites, this is a further confirmation of our assumption of a more confined and regular space formed between less polydisperse BG1 particles and P(3HB) crystallites. The interface area is expected to be larger in these structures. As a result, despite the increased fraction, all amorphous polymers in PHA blend/BG1 composites distributed into the interfaces, which limited their mobility and transformed them into a rigid state.
These differences in the rigidity of the amorphous phase and crystallisation for the two types of composites defined the mechanical properties of the materials. As can be seen from table 4, PHA blend/BG1 composites were significantly softer than composites filled with BG2 and the control PHA blend. The Young's modulus decreased by 2–5 times for the PHA blend/BG1 composites, which was a result of the lower degree of crystallinity of P(3HB) in the polymer matrix. It is worth noting that calculations of Young's modulus and ultimate strength do not take into consideration the porosity of the materials. However, the differences in the porosities of the materials were not so large and could not be the reason for such a decrease in the stiffness of composites filled with BG1. Counter-intuitively, despite the presence of rigid BG1 in the polymer matrix, the flexibility of the PHA blend/BG1 composites significantly increased when compared with the PHA control; more than 15 times increase in elongation at break was observed for the PHA blend/BG1 composite (0.5 wt%) compared to the PHA blend (table 4). However, as expected, a further increase in BG content resulted in a decrease in the elongation at break within each series of composites. All PHA blend/BG1 composites showed higher elongation at break values compared to the PHA blend/BG2 composites with equivalent BG content and also the control PHA blend.
Table 4. Mechanical properties of the PHA blend/BG composites.
| Substrates (wt%) | Young's Modulus (MPa) | Ultimate tensile strength (MPa) | Elongation at break (%) |
|---|---|---|---|
| PHA blend/BG1 (0.5) | 400.0 ± 6.0 | 5.8 ± 0.1 | 36.0 ± 6.4 |
| PHA blend/BG1 (1.0) | 850.0 ± 70.0 | 10.0 ± 0.6 | 2.5 ± 0.3 |
| PHA blend/BG1 (2.5) | 390.0 ± 26.0 | 5.1 ± 0.7 | 2.3 ± 0.5 |
| PHA blend/BG2 (0.5) | 1300.0 ± 100.0 | 16.1 ± 0.7 | 3.6 ± 1.2 |
| PHA blend/BG2 (1.0) | 1060.0 ± 50.0 | 13.0 ± 1.4 | 1.7 ± 0.1 |
| PHA blend/BG2 (2.5) | 1730.0 ± 76.0 | 19.6 ± 0.8 | 1.7 ± 0.2 |
| PHA blend | 1800.0 ± 200.0 | 19.7 ± 0.3 | 1.6 ± 0.1 |
| PCL | 390.0 ± 26.0 | 12.6 ± 0.3 | 120.0 ± 41.0 |
Similar to the stiffness, the ultimate tensile strength was lower for PHA blend/BG1 composites. However, there was no correlation between the BG content and composite stiffness and strength, which are commonly described for composites by the rule of mixtures. The main reasons for this anomalous behaviour are variable porosity of the materials, variation in the crystallinity degree and poor compatibility between the polymer matrix and fillers. As a result of the interplay of these factors, the stiffest and strongest composites were achieved for composites containing 1.0 wt% of BG1 (Young's modulus and ultimate strength 850.0 ± 70.0 and 10.0 ± 0.6 MPa, respectively) and 2.5 wt% of BG2 (Young's modulus and ultimate strength 1730.0 ± 76.4 and 19.6 ± 0.8 MPa, respectively). The tensile strength obtained in the PHA blend/BG1 (1.0% w/v) (10.0 ± 0.6 MPa) was found to be similar to that of rabbit peroneal nerve determined in another study (11.7 ± 0.7 MPa) [32].
3.2. Cellular response to the PHA-based composites
Primary evaluation of the biocompatibility of the PHA blend/BG composites was conducted using live/dead cell viability assay for NG108-15 neuronal cells. As shown in figure 3, NG108-15 neuronal cells attached well and grew on the surface of all PHA-based materials. Cell growth was significantly lower in the glass control. A significant difference was found between the percentage of live cells in the control PHA blend (94.9% ± 0.9%) and PCL film (92.4% ± 1.6%) (#P< 0.05), implying superior neuronal growth for PHA-based materials compared with the widely used biodegradable PCL (figure 3(J)). The percentage of live cells determined for all the composites was similar and found to be in the range of 99.4% ± 0.1% to 92.4% ± 1.6% (figure 3(J)). These values were not significantly different compared to the control PHA blend. Although the comparison of percentage of live cells did not display significant differences, the statistical analysis of the number of neuronal cells grown on the substrates revealed some differences in cell attachment for the composites. In figure 3(K), the number of neuronal cells grown on different substrates was compared. The composite PHA blend/BG1 (1.0 wt%) supported the highest number of cells (760 ± 60 cells) among all the composites, which was significantly different when compared to the rest of the substrates (**P < 0.05). On the other hand, the PHA blend/BG1 (0.5 wt%) supported the lowest number of neuronal cells (215 ± 30 cells), presenting similar values when compared with the number of cells grown in the control PHA blend and PCL. Smaller variations in the number of viable cells were observed in the series of composites with the BG2 filler: 400.0 ± 110.0; 410.0 ± 70.0; 250.0 ± 45.0 cells for PHA blend/BG2 (0.5 wt%), PHA blend/BG2 (1.0 wt%) and PHA blend/BG2 (2.5 wt%), respectively. In both series of composites, a decreased number of viable cells was found for the composites with 2.5 wt% BG content compared with the composites containing 1.0 wt% of BGs.
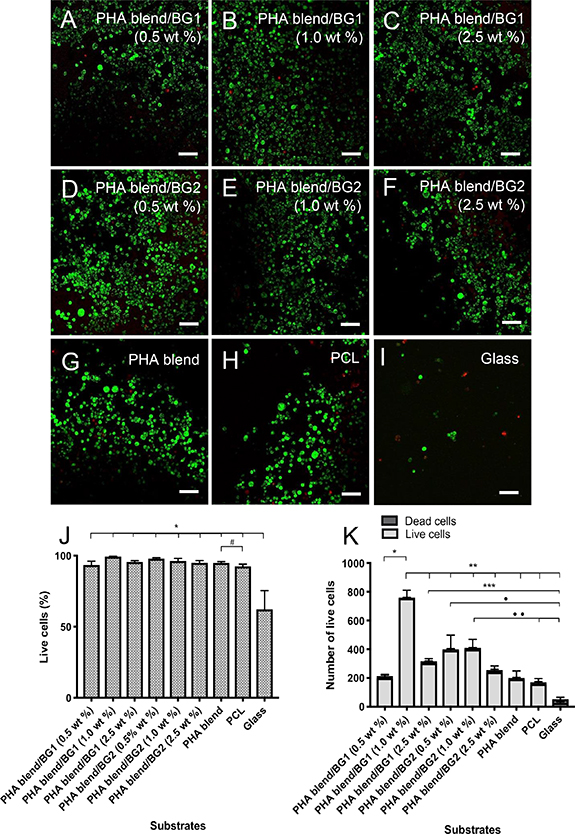
Figure 3. Confocal micrographs of NG108-15 neuronal cells labelled with propidium iodide (red) and Syto-9 (green) after 4 d in culture on PHA/BG composites and the controls PHB blend, PCL and glass. (A) PHA blend/BG1 (0.5 wt%), (B) PHA blend/BG1 (1.0 wt%), (C) PHA blend/BG1 (2.5 wt%), (D) PHA blend/BG2 (0.5 wt%), (E) PHA blend/BG1 (1.0 wt%), (F) PHA blend/BG2 (2.5 wt%), (G) PHB blend, (H) PCL, and (I) glass. (J) Live/dead analysis of neuronal cells on the P(3HO)/P(3HB) blends, PCL and glass (control). (K) Number of live cells on PHA/BG composites, PHA blend, PCL and glass (control). Scale bar = 50 µm.
Download figure:
Standard image High-resolution imageAs can be seen in figure 3, the percentage of live neuronal cells in all the PHA blend/BG composites, PHA blend and PCL was higher in comparison to glass (control) (mean ± SEM, n = 9 independent experiments *P < 0.05). The percentage of live neuronal cells in the PHA blend was significantly different to the PCL control (mean ± SEM, n = 9 independent experiments #P < 0.05. The number of live cells (figure 3(K)) grown on PHA blend/BG1 (1.0 wt%) was significantly different compared to the rest of the substrates (760.0 ± 60.0 cells). The number of neuronal cells displayed by PHA blend/BG1 (2.5 wt%) (317.0 ± 30.0 cells) (***P < 0.05) and PHA blend/BG2 (0.5 wt%) (400.0 ± 110.0 cells) (• P < 0.05) was found to be significantly different to the glass control (53.0 ± 18.0 cells). Also, the number of cells grown on the PHA blend/BG2 (1.0 wt%) (410.0 ± 70.0 cells) (•• P < 0.05) was significantly different to that grown on the controls, PCL (171.0 ± 39.0) and glass (53.0 ± 18.0 cells).
NG108-15 neuronal cells grown on the substrates were immunolabelled for β III-tubulin to study neuronal differentiation and neurite outgrowth. Neurite outgrowth assessment was carried out according to the method of Daud [33]. Differentiation was confirmed in all the neuronal cells by observing neurites sprouting in all the PHA blend/BG composites (figure 4). However, a more uniformly distributed and higher number of differentiated cells was found in the PHA blend/BG composites, compared to the PCL and glass controls. It can be seen in Figure 4 that cells grown on PCL and glass were grouped in clusters with aggregate structure.

Figure 4. Micrographs of NG108-15 neuronal cells immunolabelled for β-III tubulin after 4 d culture on PHA blend composites. (A) PHA blend/BG1 (0.5 wt%) composite, (B) PHA blend/BG1 (1.0 wt%) composite, (C) PHA blend/BG1 (2.5 wt%) composite, (D) PHA blend/BG2 (0.5 wt%) composite, (E) PHA blend/BG2 (1.0 wt%) composite, (F) PHA blend/BG2 (2.5 wt%) composite, (G) PHB blend, (H) PCL, and (I) glass. (J) Number of differentiated neuronal cells grown on substrates. Scale bar = 50 µm.
Download figure:
Standard image High-resolution imageAs can be seen in figure 4, the PHA blend/BG1 (1.0 wt%) composite supported the highest number of differentiated neuronal cells (350.0 ± 40 cells) compared to the rest of substrates. The number of NG108-15 cells grown on the composites, PHA blend/BG1 (0.5 wt%) (230.0 ± 20.0 cells), PHA blend/BG1 (1.0 wt%) (350.0 ± 40.0 cells), PHA blend/BG1 (2.5 wt%) (300.0 ± 25 cells) and PHA blend/BG2 (0.5 wt%) were significantly different to those found in PHA blend/BG2 (1.0% wt) (85.0 ± 10.0 cells), PHA blend/BG2 (2.5 wt%) (60.0 ± 9.0 cells) and the controls PHA blend film (80.0 ± 23.0), PCL film (50.0 ± 7.0 cells) and glass (10.0 ± 3.0 cells) (*P < 0.05, **P < 0.05, ***P < 0.05, • P < 0.05).
In line with the live/dead assay, the PHA blend/BG1 (1.0 wt%) composite supported the highest number of differentiated neuronal cells (350.0 ± 40.0 cells) in comparison to the rest of the substrates (figure 4(J)). The total number of neuronal cells grown on the composites, PHA blend/BG1 (0.5 wt%) (230.0 ± 20.0 cells), PHA blend/BG1 (1.0% wt%) (350.0 ± 40.0 cells), PHA blend/BG1 (2.5 wt%) (300.0 ± 25.0 cells) and PHA blend/BG2 (0.5 wt%) (230.0 ± 20.0 cells) were significantly different to those found on the PHA blend/BG2 (1.0% wt%) (85.0 ± 10.0 cells), PHA blend/BG2 (2.5 wt%) (60.0 ± 9.0 cells) and the controls PHA blend film (80.0 ± 23.0), PCL film (50.0 ± 7.0 cells) and glass slide (10.0 ± 3.0 cells) (*P < 0.05, **P < 0.05, ***P < 0.05, • P < 0.05). Confocal micrographs of NG108-15 neuronal cells immunolabelled for beta-III tubulin grown on PHA blend/BG1 (figure S3) and PHA blend/BG2 composites (figure S4) shown in the supplementary material were taken with higher magnification in order to observe neurite-bearing neurons. The growth and differentiation of NG108-15 cells in all the PHA blend composites confirmed that both BG types displayed high biocompatibility with neuronal cells.
The response of neuronal cells towards the substrates was further studied in co-culture with RN22 Schwann cells, in order to evaluate the effect of RN22 Schwann cells on neuronal differentiation and neurite outgrowth. Micrographs of NG108-15 neuronal cells grown in co-culture with RN22 Schwann cells are shown in figures 5 and also S3 of the supplementary material. Neuronal cells were immunolabelled for β-III tubulin (red) whereas RN22 Schwann cells were stained with S100β (green) for visualisation. Neurite outgrowth assessment of NG108-15 neuronal cell/RN22 Schwann cell co-cultures was performed according to Daud [33].
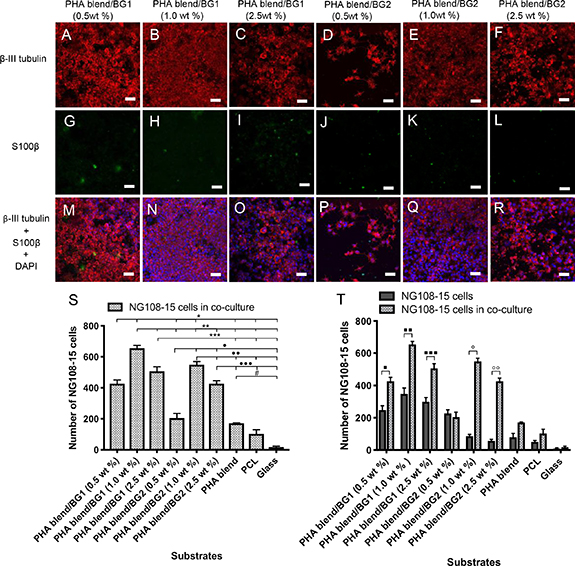
Figure 5. Micrographs of NG108-15 neuronal cells inmunolabelled for β-III tubulin (red) grown in co-culture with RN22 Schwann cells labelled with S100β (green) after 4 d on PHA blend/BG composites. (A), (G), (M) PHA blend/BG1 (0.5 wt%); (B), (H), (N) PHA blend/BG1 (1.0 wt%); (C), (I), (O) PHA blend/BG1 (2.5 wt%); (D), (J), (P) PHA blend/BG2 (0.5 wt%); (E), (K), (Q) PHA blend/BG2 (1.0 wt%); (F), (L), (R) PHA blend/BG2 (2.5 wt%). (S) Number of neuronal cells grown when co-cultured with RN22 Schwann cells. (T) Number of NG108-15 neuronal cells grown on the PHA blend/BG composites in single culture versus co-cultured with RN22 Schwann cells. Scale bar = 50 µm.
Download figure:
Standard image High-resolution image
Although only small numbers of RN22 Schwann cells were detected, analysis of the NG108-15 neuronal cells demonstrated their ability to attach, grow and differentiate on all the substrates in co-existance (figure 5). As in the live/dead cell test and neurite outgrowth assessment of NG108-15 neuronal cells in single cultures, the PHA blend/BG1 (1.0 wt%) composite supported the highest number of differentiated neuronal cells when co-cultured with RN22 Schwann cells (650.0 ± 20.0 cells) compared to the rest of the substrates (figure 5(S)). Statistical analysis of the neuronal cells grown on the PHA blend/BG composites in single culture showed an increase in neuronal cell attachment when cultured with RN22 Schwann cells, except for the PHA blend/BG1 (0.5 wt%). This increase was statistically significant for all composites. A seven-fold increase was shown in the number of neuronal cells detected in the PHA blend/BG2 (1.0 wt%) and PHA blend/BG2 (2.5 wt%) when cultured with RN22 Schwann cells.
The number of neuronal cells presented in PHA blend/BG1 (1.0 wt%) when grown with RN22 Schwann cells was significantly different to that of PHA blend/BG1 (0.5 wt%) (*P < 0.05) and to those of PHA blend/BG1 (2.5 wt%), PHA blend/BG2 (0.5 wt%), PHA blend/BG2 (1.0 wt%), PHA blend/BG2 (2.5 wt%), PHA blend film, PCL film (100.0 ± 30.0 cells) and glass (**P < 0.05) (figure 5). The number of neuronal cells grown on PHA blend/BG2 (1.0 wt%) in the presence of RN22 Schwann cells was significantly different to that determined for the PHA blend/BG2 (2.5 wt%) (••P < 0.05). A statistically significant increase was observed in the number of NG108-15 cells when grown in co-culture with RN22 Schwann cells on the PHA blend/BG1 (0.5 wt%) (▪P < 0.05), PHA blend/BG1 (1.0 wt%) (▪▪ P < 0.05), PHA blend/BG1 (2.5 wt%) (▪▪▪ P < 0.05), PHA blend/BG2 (1.0 wt%) (° P < 0.05) and PHA blend/BG2 (2.5 wt%) (°° P < 0.05).
4. Discussion
Porosity is considered a crucial structural feature of materials, which provides an efficient cell migration, nutrient and catabolite exchange [17] required for nerve regeneration. It is worth noting that the pore size for the composites developed in this study (3–10 μm) are within the 5–30 μm range recommended for NGCs; hence, a lumen coat using these PHA-composites will fulfill the requirement of adequate porosity [34].
The incorporation of BG2 resulted in rougher surfaces for composites containing 0.5 wt% and 2.5 wt% of BG2 (2.6 ± 0.1 and 2.3 ± 0.01 µm, respectively) compared with the PHA blend control (1.2 ± 0.1 µm), while roughness of the PHA blend/BG2 (1.0 wt%) was not significantly different to that of the PHA blend control. At the same time, incorporating BG1 led to decreased Rq values in comparison with the control PHA blend film (figure 2). This finding may be the result of a decreased impact of the so-called 'breath figure' phenomenon [35] that is common in film casting of hydrophobic polymer solutions with highly volatile solvents. For such systems, water droplets condense on the polymer as a result of surface cooling due to evaporation and make imprints on the film surface. However, since the addition of BG1 decreased the hydrophobicity of the material, the 'breath figure' effect could have a smaller impact on the surface topography of composite film.
The significant decrease in surface wettability observed in both series of composites for composites with the lowest BG content (contact angles of 95.70 ± 0.60° and 93.50 ± 0.80° for PHA blend/BG1 (0.5 wt%) and PHA blend/BG2 (0.5 wt%), respectively, compared with 77.40 ± 0.80° for the control PHA blend, could reflect the contribution of surface topography to the change in surface wettability. Although the roughness for the PHA blend/BG1 (0.5 wt%) did not significantly change compared with the PHA blend, the technique used in this study evaluates roughness on a micrometer scale. Topographical features of nano- and submicron sizes in the composite film probably resulted in an increase in the contact angle for these composites. BG particles were completely covered with the polymer matrix in composites with 0.5 wt% BG content, when the particle/polymer ratio was low. In this case, the hydrophilicity of the BG did not contribute to the wettability. However, with the increase in BG content, more BG particles were exposed on the composite surface, increasing the surface hydrophilicity and the contact angle decreased with respect to the PHA blend for composites containing 1.0 wt% and 2.5 wt% BG. Composites with filler content of 1.0 wt% and 2.5 wt% showed lower contact angle values than the PHA blend except for PHA blend/BG2 (1.0 wt%). Slightly lower values of contact angles for the composites filled with BG1 are likely due to their surfaces being smoother compared with composites containing BG2.
In the composites, crystallisation of P(3HB) occurs in a confined space between the BG particles. Less polydisperse particles of BG1 may have formed a more regularly packed environment than BG2. In addition, as mentioned above, composites with BG1 were more porous than the PHA blend/BG2 composites. These two factors could drive the P(3HB) crystallisation to occur in a more confined space for the PHA blend/BG1 composites, resulting in the suppression of P(3HB) crystal growth. The higher the BG content, the more crowded the system would be, leading to a lower degree of P(3HB) crystallisation (table 3). However, in the case of PHA blend/BG2 composites, a higher degree of BG packing might lead to the formation of BG-rich and BG-depleted regions. Hence, in this case, P(3HB) crystallisation was similar to the that in the PHA blend.
It is well-known that BGs have beneficial effects on tissue regeneration upon contact with physiological fluids, including cell attachment and stimulation of growth factor production by their dissolved ions (i.e. vascular endothelial growth factor (VEGF); basic fibroblastic growth factor (bFGF)). [3] Both 45S5 and 1393 BGs release the cations Ca+[2] and P+[5] in physiological solutions, which have been shown to stimulate angiogenesis. Phosphorous results in an increase in VEGF, bFGF and matrix metalloproteinase-2 (MMP-2), whereas calcium has been shown to enhance endothelial cell proliferation [36]. The combined effect of the above-mentioned phenomena can explain the cellular growth increment observed in the composites, PHA blend/BG1 (0.5 wt%, 1.0 wt% and 2.5 wt%) and PHA blend/BG2 (0.5 wt% and 1.0 wt%) compared to PHA-control films. Hence, the bonding between BG-containing surfaces and cells is the result of dissolution and precipitation reactions on the surface of the material. These interactions are highly affected by the BG composition and involve proteins absorbed to the material surface, cell receptors and dissolved ions. [3] Therefore, while some of the phosphate and calcium ions could have reacted to form HA, other free phosphate and calcium ions could have been free in solution and entered the cell via the Na/Pico-transporter and specific membrane channels, respectively, positively affecting the expression of growth factors by neuronal cells. There is a great diversity of voltage- and ligand-gated ion channels that are permeable to inorganic ions such as calcium, sodium, potassium and chloride, which are vital for the electrical activity of excitable cells. Moreover, calcium in particular also serves as an essential signalling entity. [37]
It is widely accepted that the hydrophobicity of surfaces significantly affects cell attachment. However, in this study a lack of linearity was observed in terms of hydrophobicity/cell growth. It is expected that lower water contact angles would support higher cell adhesion and growth. Although the composites with the lowest water contact angles, PHA blend/BG1 0.5 wt (65.7 ± 1.2°) and PHA blend/BG1 1.0 wt% (65.3 ± 1.4°) showed the best performance supporting cell growth of neuronal cells, the composite PHA blend/BG1 0.5 wt% with the highest contact angle, (95.7 ± 0.6 °) presented optimal biocompatibility (figures 4, 5, S3). The formation of a HA layer could potentially counteract the unfavourable effect of the hydrophobic surface in the PHA blend/BG1 0.5 wt% composite by providing a bonding interface. Similarly, the biocompatibility of the composite PHA blend/BG2 0.5 wt% (93.5 ± 0.8°) could also have been improved by the formation of a HA layer (figures 3, 4). Surprisingly, an opposite effect was observed in the co-culture of PHA blend/BG2 0.5 wt% in which the addition of RN22 Schwann cells could have a detrimental effect on cell growth by either hindering the formation of HA or by depleting the nutrients in the media. This composite was the only construct that showed a decrease in NG108-15 growth in co-culture with RN22 Schwann cells.
In all the cell culture experiments, PHA blend/BG1 (1.0 wt%) exhibited superior performance in supporting the growth of differentiated NG108-15 cells compared to the rest of the substrates. The superior performance of PHA blend/BG1 (1.0 wt%) was consistent in all the cell culture experiments (live/dead analysis, neurite outgrowth assessment of NG108-15 neuronal cells and NG108-15/RN22 Schwann cell co-cultures). Furthermore, neurite extension found in the PHA blend/BG1 (1.0 wt%) could be very clearly observed in areas where neurites formed a complex connection network (supplementary material, figure S3). These interconnected neurite structures were also observed in PHA blend/BG1 (0.5 wt%) (supplementary material, figure S3). The growth and differentiation of the NG108-15 cells on the remaining PHA blend/composites was variable in the live/dead cell test, neurite outgrowth assessment on NG108-15 neuronal cell and on NG108-15/RN22 Schwann cell co-cultures. It is important to note that despite the fact that PHA blend/BG1 (1.0 wt%) displayed a superior performance as a neuronal scaffold, this composite did not show the most favourable surface characteristics compared to the rest of the composites. Although the water contact angle (65.7° ± 1.2°) corresponded to a hydrophilic substrate, the roughness was low and its microstructure did not show an interconnected porous system. Therefore, the concentration of BG1 used in PHA blend/BG1 might have played an important role in the favourable properties of this composite, by providing a beneficial balance of cations in the culture media. It is worth mentioning that this is the first study of PHA/BG composites in the context of neural tissue engineering.
In general, both BGs showed significant biocompatibility within the PHA blend. In all the experiments, the presence of BGs at all concentrations (0.5 wt%, 1.0 wt% and 2.5 wt%) increased the number of neuronal cells with respect to both the PHA blend control and PCL control. The BG1 composites exhibited better performance in supporting cell growth and differentiation of NG108-15 cells, compared with the BG2 composites.
To the best of our knowledge, this study is the first to evaluate the effect of BG2 on neuronal regeneration and shows its potential application as a base material in the form of PHA/BG2 composite for the manufacture of inner structures of NGCs used for the regeneration of peripheral nerves. In contrast, BG1 has been previously investigated for peripheral nerve regeneration applications, either on its own or in combination with other polymers, but not PHAs. Bunting et al [6] have reported that fibres of BG1 are biocompatible with rat Schwann cells and fibroblasts in vitro. They showed qualitative and quantitative evidence of axonal regeneration in vivo using a silastic conduit filled with BG1 fibres implanted in the sciatic nerves of adult rats. In addition, Mohammadkhah et al [10] used BG1 as one of the components of a range of poly- -caprolactone (PCL)/BG composites used to support nerve regeneration. For the biocompatibility study, DRG isolated from embryonic chicks was cultured on composite sheets and neurite outgrowth was measured. The BG particles added to the composites did not show any negative effects on neurite extension. An increase in the neurite outgrowth of DRG cultured on the poly--caprolactone (PCL)/BG1 composite was observed and compared with PCL sheets [10]. Although only a few RN22 Schwann cells were detectable at the end of the experiment, they may have supported neuronal growth and axon extension. RN22 Schwann cells grow faster than NG108-15 cells and form a layer of cells that tend to detach easily. Therefore, RN22 Schwann cells could have detached during the fixation and washing process prior to immunolabelling. Schwann cells are the myelin-forming cells of the peripheral nervous system. Schwann cell-neuron communication is carried out through intracellular waves of calcium and via intercellular diffusion of chemical messengers, which are involved in the synaptic transmission [38, 39]. In this respect, the release of Ca2+ from BGs could be controlled to obtain a beneficial effect in SC-neuron communication.
Intercalated regions of myelinated sheets leave the axonal section of the neuronal cells exposed to promote the depolarization of the membrane. Nodes of Ranvier are rich in voltage-gated Na+ channels, where Na+ ions cross and depolarize the membrane between segments of compacted myelin. Herein, the release of Na+ ions from BGs might have an effect on the membrane polarization during impulse conduction. Further research needs to be carried out to investigate the specific effect of the Na+ ions released from BGs on the membrane polarization.
5. Conclusions
The microstructure of the PHA blend/BG composites was affected by the concentration of BGs in the composite. The concentration of BG1 and BG2 showed an effect not only on the pore size of PHA blend/BG composites, but the distribution and structure of the porous systems. The efficient growth and differentiation of NG108-15 cells on all the PHA blend composites confirmed that both BGs (BG1 and BG2) have good biocompatibility when used as a PHA composite. The growth and differentiation of NG108-15 cells on PHA blend/composites was found to be variable in the live/dead cell test and neurite outgrowth assessment. In general, both BGs exhibited a significant impact on the biocompatibility of the PHA blend. Although composites with BG2 have been shown to support neuronal regeneration, composites with BG1 displayed superior performance in supporting cell growth and differentiation of neuronal cells. The presence of RN22 Schwann cells in NG108-15 cultures had a further positive effect on the growth and maintenance of the differentiated neuronal cells in all the PHA blend/composites, except for the PHA blend/BG2 (0.5 wt%). PHA blend/BG1 (1.0 wt%) exhibited the best performance in supporting growth and maintaining neuronal differentiation of NG108-15 amongst all the substrates in all the cell culture experiments. Moreover, neurite extension found in the PHA blend/BG1 (1.0 wt%) was remarkable, as neurites formed a complex connection network. Therefore, the PHA blend/BG1 (1.0 wt%) exhibited the best combination of surface features, chemical and mechanical properties to emerge as the best substrate for the growth and differentiation of neuronal cells and hence for the future development of both the lumen coat of NGCs and for nerve tissue regeneration in general. Due to the known beneficial effect of HA in cell growth and attachment [40], the formation of this compound in PHA blend/BG composites should be investigated in further studies using x-ray powder diffraction or Fourier-transform infrared spectroscopy. In addition, due to the fact that calcium has a fundamental role in the initiation of the nerve regeneration process [41–48], it is expected that the use of BGs as calcium delivery systems with controlled release will have a positive impact on axonal growth. Therefore, the measurement of calcium release from PHA blend/BG composites and characterization of calcium homeostasis are highly recommended for further studies.
Acknowledgments
The authors would like to acknowledge the Department of Materials Science and Engineering (Kroto Research Institute, University of Sheffield, UK), NEURIMP (Grant Agreement No. 604450), a Framework 7 project funded by the EC, and the University of Westminster for providing the facilities, materials and funding for this research work. The authors also acknowledge Rosa Angelica L Valderrama and Raul Lizarraga for providing funding for this investigation.
Conflict of interest
The authors declare no conflict of interest.