
Abstract
A limiting factor in the design of smaller size uncrewed aerial vehicles is their inability to navigate through gust-laden environments. As a result, engineers have turned towards bio-inspired engineering approaches for gust mitigation techniques. In this study, the aerodynamics of a red-tailed hawk's response to variable-magnitude discrete transverse gusts was investigated. The hawk was flown in an indoor flight arena instrumented by multiple high-speed cameras to quantify the 3D motion of the bird as it navigated through the gust. The hawk maintained its flapping motion across the gust in all runs; however, it encountered the gust at different points in the flapping pattern depending on the run and gust magnitude. The hawk responded with a downwards pitching motion of the wing, decreasing the wing pitch angle to between −20∘ and −5∘, and remained in this configuration until gust exit. The wing pitch data was then applied to a lower-order aerodynamic model that estimated lift coefficients across the wing. In gusts slower than the forward flight velocity (low gust ratio), the lift coefficient increases at a low-rate, to a maximum of around 2–2.5. In gusts faster than the forward flight velocity (high gust ratio), the lift coefficient initially increased rapidly, before increasing at a low-rate to a value around 4–5. In both regimes, the hawk's observed height change due to gust interaction was similar (and small), despite larger estimated lift coefficients over the high gust regime. This suggests another mitigation factor apart from the wing response is present. One potential factor is the tail pitching response observed here, which prior work has shown serves to mitigate pitch disturbances from gusts.
Export citation and abstract BibTeX RIS

Original content from this work may be used under the terms of the Creative Commons Attribution 4.0 license. Any further distribution of this work must maintain attribution to the author(s) and the title of the work, journal citation and DOI.
1. Introduction
In recent years, uncrewed aerial vehicles (UAVs), have increased in popularity. UAVs have been developed for a wide variety of applications, ranging from military to civilian, including search and rescue, personal entertainment, and commercial videotaping [1, 2]. Some companies are also proposing automated delivery services using UAVs. A significant drawback to UAV usage is the lack of stability while operating under adverse aerodynamic conditions such as gusts. A gust becomes more significant for a UAV as its velocity magnitude approaches the magnitude of the UAV's flight speed. For smaller drones, such disturbances are common in urban or suburban environments due to airflow around buildings [3]. Larger fixed-wing UAVs struggle with clear air turbulence at altitude, similar to early crewed jetliners [4]. At the same time, natural flyers such as birds often fly in gusty conditions generated due to obstacles such as terrain and buildings [5, 6]. Furthermore, the gusts encountered by these natural flyers are nominally of a magnitude similar to their flight speed [7, 8]. As such, in the recent past, engineers have turned to bio-inspired engineering to develop gust mitigation strategies.
Research has been conducted on morphing-wings to characterize their performance compared to fixed-wing UAVs [9, 10]. Other groups have taken a detailed look at gust mitigation by mimicking feathers seen on gliding birds [11, 12]. Bioinspired designs that mimic the motion of a bird flapping are also in development [13, 14]. Flapping wing designs that mimic birds display increased stability, efficiency, and maneuverability [15]. To better understand this flight regime, research has been conducted to fully characterize the effects of wing modulation on flight stability. Wind tunnel analysis of a flapping wing suggests decreased sensitivity to turbulence in the free stream [16]. Observations from natural flight have also reported that an eagle's flight patterns are correlated with imprints of turbulence in the environment [17]. Observations of soaring steppe eagles suggested gust mitigation through the use of wing-tucks, while gliding gulls changed pitch stability through movements at the wing joints [18, 19]. Experiments using hummingbirds flying through upward gusts reported a spectrum of control strategies including the simultaneous use of wing flapping and tail fanning [20]. Recent analysis of owl gliding showed a gust response characterised by increasing the angle of elevation of the wing and decreasing the pitch angle [21]. These investigations helped reveal a variety of the natural methods used by birds in gust responses and the aerodynamics involved in gust responses.
Here, the aerodynamics of the gust response in birds will be characterized by quantifying the response of a red-tailed hawk flying in an indoor flight arena, with vertical upward gusts introduced using fans. The bird employed flapping flight outside of ground effect through the flights where it experienced two primary flight regimes, defined by the ratio of gust velocity to forward flight velocity (also known as gust ratio): low gust ratio (0.60 ± 0.01) and high gust ratio (1.16 ± 0.04). The flights were recorded using a set of high-speed cameras placed around the tunnel. Following the recording, 3D tracking data of the wing, tail, and body were collected [22]. The tracked points were then used to characterize the hawk's gust response by computing geometric variables such as the wing angle of attack and tail roll angle. A lower-order unsteady aerodynamic model was used together with the geometric variables to produce lift coefficient estimates. These lift coefficients were then used to conduct a relative comparison of the hawk behavior in both regimes in order to analyze the effectiveness of the hawk's response.
This experiment revealed a remarkable gust mitigation ability in the red-tailed hawk. The gust response was characterized by a downward wing pitch, along with an upward tail pitch as each of these surfaces encountered the gust flow. The tail also rolled in many recordings, but with variable direction. Despite substantial changes in wing pitch, the estimated lift coefficient rose rapidly in the case of high gust ratio, before nearly plateauing 0.5–1 chord lengths after the gust encounter. The value ultimately reached a maximum of around 4–5 in high gust ratio runs. The lift coefficient rose slowly but constantly across most low gust ratio runs, before reaching a maximum of around 2–2.5. The lift coefficients dropped rapidly after exiting the gust column. Despite increased lift coefficients in high gust runs, the tracked change in bird height over the fans remained similar across both gust regimes. This suggests the presence of other mitigation factors, separate from the wing pitch response, that assist in gust mitigation. From the kinematic analysis of the gust response, the tail response was identified as one such potential factor; it may have enhanced pitch stability as was seen in hummingbirds [20].
2. Methodology
2.1. Flight arena
Experiments were conducted in an indoor flight arena (figure 1) in the Department of Aerospace Engineering at Auburn University. While preliminary work by our group used an outdoor flight arena consisting of an inflatable tunnel with fans placed near the exit [23], the external gusts made it infeasible for well-controlled experiments. The indoor arena design had to account for the ease of access by birds and cameras, as well as the effects of turbulent air flow [24]. To facilitate bird and personnel access, both ends of the arena were left open, with a series of poles and plastic separators constructed between them to form the enclosed space. The arena had a length of 15.20 m, a width of 3.05 m, and a height of 2.60 m, and gust generating fans were placed 6.10 m from the bird's starting perch. To prevent the hawk from flying in ground effect, two foam-covered barricades with a height of 0.92 m were placed in the tunnel, one 2.57 m before and one 1.50 m after the gust generator fans. A gap was introduced in the ceiling of the arena above the gust generators to allow the gust to escape, preventing any secondary gust effects from recirculating air. The hole was covered with a coarse mesh net to dissuade the bird from flying upwards. Two twin-head 9000-lumen LED work lights (Craftsman) were placed at the far left and right of the tunnel, 1.14 m before the fans, oriented to illuminate the bird as it passed over the fans.
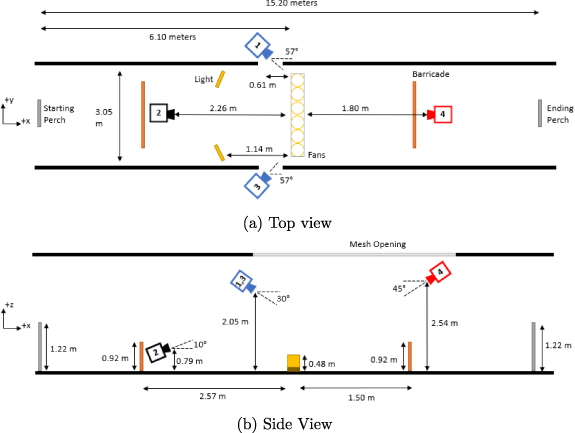
Figure 1. Illustration of flight arena showing the instrumentation and equipment.
Download figure:
Standard image High-resolution imageThe next design consideration for the flight arena was camera orientation, ease of calibration, and camera recording parameters. The volume of interest spanned from 0.9 m before the fans to 1.8 m after the fans, and from the top of the fans to 0.9 m above the fans. This region contained the majority of the bird's flight during the gust interaction. The camera arrangement consisted of four cameras: one was placed 2.26 m in front of the fans at a height of 0.79 m, angled 10∘ upward. Two were placed approximately 0.61 m before the fans just outside the tunnel, at a height of 2.05 m, angled 30∘ downward and 57∘ from the horizontal tunnel wall. The last camera was placed 1.80 m after the fans at a height of 2.54 m, angled 45∘ downward. The last camera was securely attached by attaching to a metal frame, which also centered the camera in the middle of the six fans. An illustration of the flight arena with camera placement is illustrated in figure 1. This orientation covers the desired volume, while also providing enough unique sight lines to facilitate a simple calibration. Two Phantom VEO 640L cameras and two Phantom VEO 4K 990L cameras with a Nikon 18‐105mm f/3.5‐5.6G lens were used to record the flights. Flights were recorded at a 500 frames per second frame rate, a 4096×2304 pixel resolution for VEO 4k 990L cameras, and a 2560×1600 pixel resolution for VEO 640L cameras. This corresponds to a spatial resolution of 0.083 cm/pixel centered on the gust generators resulting in each pixel covering around 2.82% of the birds wing chord. Two GoPro Hero 6 Black cameras were also placed in the tunnel, one after the fans looking toward the perch and one next to the fans looking towards the flight path to record overall flight behavior not in the field of view of the high-speed cameras.
The gusts were produced using six 30.5 cm Global Industrial utility blowers, model # T9F246343, placed 17.5 cm above the ground as illustrated in figure 1. The fans were capable of producing different gust strengths. The low and high setting produced an average gust velocity of ∼4.3 ms−1 and ∼7.7 ms−1, respectively, at a typical flight elevation of the hawk. The ratio of the gust velocity to the forward flight velocity of the bird was then defined as the gust ratio. Based on the recorded flight speeds of the hawk, the gust ratio for low speed and high speed was 0.60 ± 0.01 and 1.16 ± 0.04, respectively. These two regimes will be referred to as 'low gust ratio (LGR)' and 'high gust ratio (HGR)', respectively. The fans were placed on an open-bottomed wooden platform, such that the six fans formed a line normal to the flight path. The detailed characterization and profile of the gust velocity is presented in a previous publication [23].
2.2. Hawk characteristics
A male red-tailed hawk (Buteo jamaicensis) named 'Petey' from the Southeastern Raptor Center in Auburn, Alabama, was used for all runs. The hawk had a tip-to-tip wingspan of 1.19 m and an average wing chord length (c) of 0.23 m. The length of the tail from the base to the tip was 0.14 m in the longest section. The mass, which was quantified just before the flight on each recording day, averaged 945 g, with a range of 932 g to 954 g among the three recording days. The hawk was flown through the flight arena under the guidance of an Institutional Animal Care and Use Committee (IACUC - 2018-3302 and 2021-3911) and the United States Fish protocol and Wildlife Service (USFWS) scientific collecting permit (MB77511C-0, MB677361-1, and MBPER0009547). The hawk was handled by Southeastern Raptor Center (SRC) staff or SRC volunteers under the supervision of SRC staff. At the beginning of each flight, the hawk was placed upon the starting perch by SRC staff or volunteers. A second staff member or volunteer stood at the location of the ending perch. This staff member or volunteer would then execute a visual command that influenced the hawk to fly through the tunnel. Recording sessions lasted a total of one to two hours, with breaks at the discretion of the handlers if the hawk displayed signs of needing rest. In between flights, the hawk would rest upon a glove or a perch near the flight arena.
2.3. Flight motion tracking and post processing
Before bird flight experiments were initiated, the volume was calibrated using a checkerboard pattern. A checkerboard was moved around within the desired volume in the vision of cameras 1, 2, and 3 in one video; and in the same volume in the vision of cameras 2, 3, and 4 in a second video. A very short third video was made with a calibration axes constructed from a Zometool Basic Kit erector set placed on the fans. The easyWand program was used together with the tracked corners of the checkerboard to obtain an accurate volume calibration, similar to methods that involve a wand moving around the volume [25].
With the calibration data collected, bird flight experiments were initiated. Image data recording began at the push of a button, which would simultaneously trigger all cameras based on a signal the camera operator received from the SRC bird handler staff as the bird was taking off the perch. A total of ten runs were conducted, six at the high gust ratio, and four at the lower gust ratio. Together with the calibration gathered from easyWand, the MATLAB-based DLTdv8 motion tracking application was used to gather accurate 3D point data [22]. Fourteen points were tracked in each frame over the course of ten flights. Four on the tail, eight on the wings (four per wing), one on the beak, and one on the torso. Figure 2 shows the position of each point on the bird.
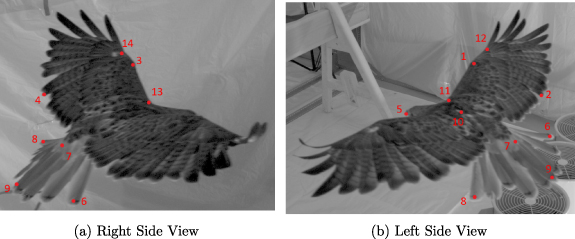
Figure 2. Summary of bird flight points tracked with DLTdv8.
Download figure:
Standard image High-resolution imageThe 3D point trajectories were then used to estimate geometric data on the response of the bird to the gust. Before any analysis was conducted, the raw point data was passed through a low-pass filter with sampling frequency 500 Hz and bandpass frequency of 50 Hz to remove small oscillations due to any errors. The beak point was used to determine the overall flight velocity, which was almost entirely in the x direction. Points 1, 2, 3, and 4 were used to compute the geometric angle of attack of the wing ( ) by comparing the x-coordinates and z-coordinates. Points 11, 12, 13, and 14 were used to compute the wing elevation angle (β) by comparing the y-coordinates and z-coordinates. The roll angle of the tail (τ) and the angle of the tail pitch (ι) were determined using points 6 and 8, and points 7 and 9, respectively. The velocity of the wings was found using the wing points and a linear interpolation method. At any point s, the instantaneous velocity in one direction was assumed to be a linear interpolation between point s + 1 and s − 1, as shown in the below equation:
In equation (1), s is defined as  , where U is the forward velocity of the pitching 'plate', i.e. the wing. This value was calculated for each run using the slope of a linear fit of point 5 position data. By extension, point s − 1 is the location along the flight path one frame before point s, and point s + 1 is the location one frame after. These values would then be used to calculate the lift coefficients using the unsteady models discussed in the next sub-section.
2.4. Unsteady aerodynamic loads estimation
To better understand the unsteady aerodynamic loading on the birds wing during the gust interaction, a lower-order unsteady aerodynamic model was used to estimate the lift coefficient of the wing over the fan. The unsteady aerodynamics of a gust acting on a wing was first examined by Kussner [26], who proposed a model to estimate lift. Later research would investigate the optimal ways to mitigate gusts using this model, a model we will also use [27]. Over the fans, the wings can be estimated as a flat plate in a gust flow field, as the wings are extended and the pitch angle changes. The lift coefficient equation is shown below.
where s is non-dimensional distance; wing begins pitching at 0, W(x) is the Wagner function, α is the geometric angle of attack of the wing, U is the forward flight velocity, τ is some location between 0 and s, K(x) is the Kussner equation for the wing at zero angle of attack, vg is the vertical gust speed, Dc is the new location where the gust is encountered due to wing pitching.
Several assumptions in unsteady aerodynamic theory that are applicable to this model [27] are: (i) the flow is considered to be inviscid and incompressible; (ii) the vorticity elements shed from the wing trailing edge are confined to the horizontal plane aligned with the wing; (iii) vorticity is not shed from the leading edge; (iv) the gust shear layer is rigid and does not deflect during the wing-gust encounter; (v) the disturbances affecting the wing are small and thus small angle approximations are valid.
For a plate that does not rotate, experiments have supported the usefulness of Kussner's model even in high gust ratios [28]. Therefore, this model should serve as a reliable estimation of the lift coefficient on the bird's wings. Additional assumptions that were made in this study include: (i) the wing surface area exposed to the gust remains constant; (ii) the gust velocity is constant across the wing; (iii) integrations can be approximated using a step trapezoidal approximation; (iv) the bird's wrist chord can be used to approximate overall wing changes; (v) the gust can be modelled as a vertical column.
Using the extracted flight motion data, the lift coefficient was estimated at the wrist, on the left and right wings. The lift coefficient was estimated from the time the wing first encountered the gust to when the wing exited the gust column.
To assist in characterizing the effectiveness of the gust response, the change in hawk height due to the gust (Δz) was calculated from tracked body points. As z was assumed to start at an equilibrium point designated as '0', the final height change was taken to be the final z value calculated.
3. Results
3.1. Overall flight pattern
First, we consider the bird's overall flight pattern and trajectory over the gust generators. The bird's specific flight path was not controlled by the experiment, and small variations occurred across runs. Using the 3D coordinate data from the different wing and body locations, flight tracks were created to check these variations and ensure that both wings were within the width of the gust generators during flight, as shown in figure 3. We found that the bird remained above the center of the fans for a majority of the runs, allowing both wings to experience gust effects across the entire surface.

Figure 3. Summary of low gust ratio bird flight paths tracked by wing wrist and tail edge points.
Download figure:
Standard image High-resolution imageThe bird's overall flight trajectory from landing to takeoff was not tracked by the high speed cameras, which were focused on the region immediately surrounding the gust. However, the GoPro camera recordings allow for the following descriptive account. The bird's overall flight pattern through the gust generator began with takeoff from the starting perch, followed by several vigorous wingbeats transitioning to lower amplitude flapping as the bird approached the gust region. The bird typically entered the gust region at an upstroke-to-downstroke transition point in the flapping cycle during low gust ratio runs and at the midpoint of the downstroke during high gust ratio runs, despite efforts to change this phase relationship by repositioning the takeoff perch. The only observed changes in phase occurred during high gust ratio runs, where the bird changed its flapping motion after the second run to hit the gust at a different point (mid-downstroke) in the flapping pattern. However, for the final run the bird returned to the flapping pattern established in the first and second runs. In those runs, the bird would enter the gust at an earlier point in the downstroke, the earliest being at the start of the downstroke. The bird continued flapping through the gust, albeit with lower amplitude in the high gust condition, before slowing and landing on the end perch. The hawk remained above ground effect throughout, and gliding flight was typically not observed. The average flight speed through the gust region was 7.16 ± 0.13 ms−1 for low gust ratio runs and 6.61 ± 0.23 ms−1 for high gust ratio runs.
3.2. Geometric response
To comprehensively characterize the gust response, the variation in bird's wing geometric angle of attack (chordwise) and wing elevation angle (spanwise) was quantified for both high and low gust ratio conditions and is summarized below. Note that the geometric angle is plotted against  , which is equivalent to
  , where x is the x-location of the wing wrist.
3.2.1. Geometric angle of attack
The geometric angle of attack results are provided in figure 4. In both high gust and low gust ratio runs, the hawk entered the gust region with a geometric angle of attack between 0∘ and 20∘. The left wing entered with a slightly higher pitch angle during some low gust ratio runs, with a value usually between 20∘ and 30∘.
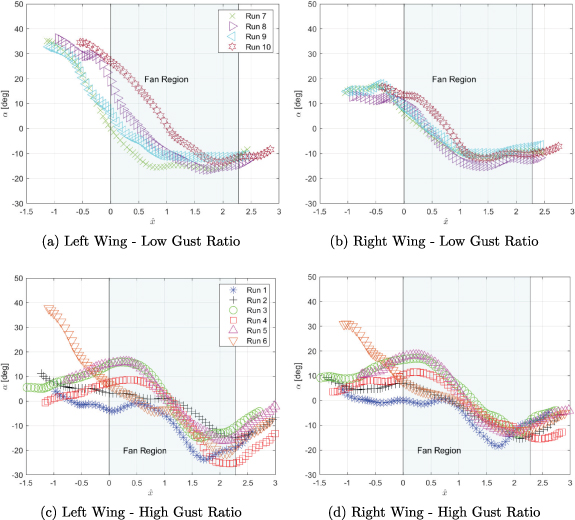
Figure 4. Summary of variation of geometric angle of attack with non-dimensional wing wrist distance.
Download figure:
Standard image High-resolution imageAs the hawk's wing crossed the gust, it pitched downwards at a roughly constant rate, ceasing the pitching motion shortly before exiting the gust. Both high gust and low gust ratio regimes see the bird exit the gust with a geometric angle between −20∘ and −5∘. While high fan gust ratio runs possess a larger spread of exit angles, the exit angles are remarkably similar across both regimes. The only substantial distinction between regimes was the rate at which the wing ceases pitching. Low gust ratio runs reached constant pitch anywhere between 0.5–2.0 chord lengths after initial gust encounter. High gust ratio runs reached constant pitch no sooner than 2.0 chord lengths after initial gust encounter. As noted earlier, the left wing exhibited an elevated initial pitch in the low gust ratio regime. The wing appears to be pitched upwards much more significantly than the right wing. However, the wings are nearly symmetrical in response. The discrepancy comes from the differences in flapping regime, characterised by figure 5. Just before the gust encounter in the low gust ratio runs, the hawk had an unextended wing in a late upstroke configuration, with the wrist flexed rather than extended. It is difficult to characterize the wing with a single geometric angle of attack in this configuration, and small differences in bird alignment in the arena lead to large differences in α. This initially leads to slightly elevated values and a convergence of values once the wings are extended.
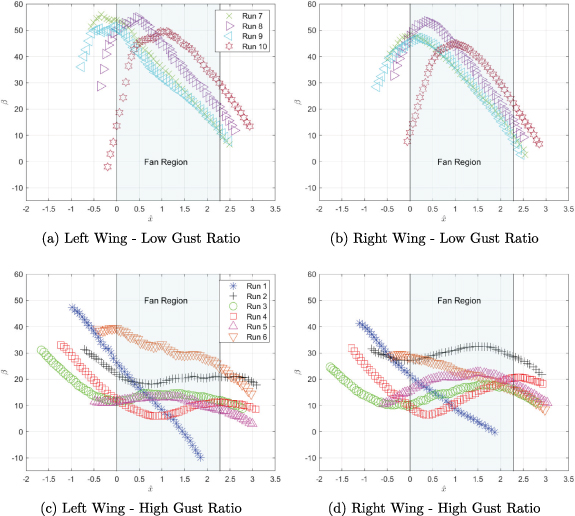
Figure 5. Summary of variation of wing elevation angle with non-dimensional wing wrist distance.
Download figure:
Standard image High-resolution image3.2.2. Wing elevation angle
The spanwise angle, or the elevation angle of the wings, varied between gust ratio regimes, as shown in figure 5. At the low gust ratio conditions the hawk was observed to enter the gust with elevated wings and reach maximum elevation just before or just into the gust region. This resembles a normal flapping pattern, with the end of the upwards flap occurring at maximum elevation angle. No substantial changes to the flapping cycle are observed due to gust effects in the low gust ratio runs. The high gust ratio runs were characterized by the hawk entering with slightly elevated wings, usually between 10∘ and 30∘ upwards. As the hawk crossed the gust, the wings usually increased the elevation angle on the scale of 5∘–15∘, but a decrease in elevation angle across the gust was observed for two of the runs. The four runs where the elevation angle increased correlates with a momentary delay in the flapping cycle, setting the high gust ratio runs apart from low gust ratio runs. The two regimes also differ significantly in elevation angle. Elevation angle in the low gust ratio runs increased at the start of each run before slowly decreasing through the fan region. In high gust ratio runs, the elevation angle generally decreased, only increasing slightly over the fans in some runs.
3.2.3. Tail response
The tail geometric response, shown in figure 6, consists of the modulations of the pitch angle and the roll angle. The tail entered the gust region pitched downward, between −30∘ and −45∘ for high gust ratio runs, and between −20∘ and −30∘ for low gust ratio runs. After encountering the gust, the tail pitched upwards (i.e. towards a positive pitch angle) at a constant rate. This rate was much faster for high gust ratio conditions than for low gust ratio conditions.
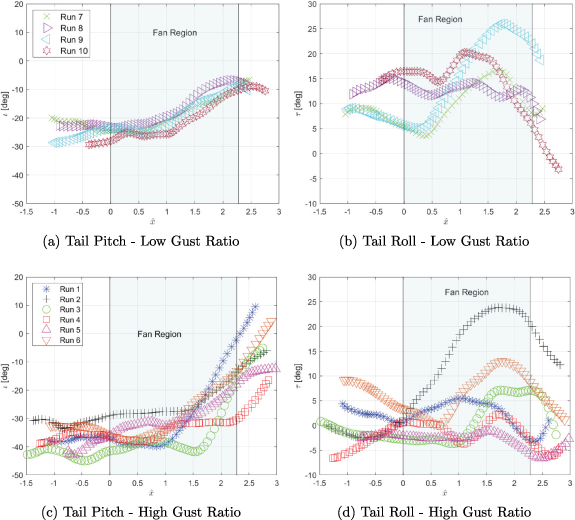
Figure 6. Summary of variation of tail pitch and tail roll angles with non-dimensional wing wrist distance.
Download figure:
Standard image High-resolution imageThe tail roll angle entered the gusts between −5∘ and 5∘ for high gust ratio conditions and between 5∘ and 20∘ for low gust ratio conditions (counterclockwise as viewed from rear is positive). Over the gust, the roll angle was observed to vary without any obvious pattern. However, apparent tail roll angle responses were observed during the gust interactions; both high and low gust ratio condition experiments show sudden shifts in tail roll angle at different points along the trajectory through the gust region.
3.3. Unsteady aerodynamic loads on the wing
The lift coefficients, shown in figure 7, were calculated at the wing wrist for the left and right wings for all runs. The fan region in each graph details when the wing wrist was located directly over the fans.

Figure 7. Summary of wing chord lift coefficient with non-dimensional wing wrist distance.
Download figure:
Standard image High-resolution imageThe low gust ratio regime showed initial instability in lift coefficient, before stabilizing into a near linear increase. Lift coefficient is maximized as the wing wrist leaves the gust, with a maximum value of 2–2.5. After the wrist leaves the gust column, the lift coefficient drops rapidly.
The high gust ratio regime was observed to have a similar rapid increase upon gust column entry, but with a greater magnitude. The rapid increase ceases around a lift coefficient of 3–4, before beginning a slow increase or plateau. The lift coefficient is maximized just as the wrist leaves the gust, with typical maximum values around 4–5 and a global maximum up to 6 in one run.
Without the downwards pitching motion described above in the wing geometric angle of attack section, the wing would have experienced a larger lift coefficient. This can be seen from equation (2) and from figure 8. The figure shows expected lift coefficients, assuming that the geometric angle of the wing remained constant after the gust encounter. The average geometric angle at gust entry was used as the constant angle in both low gust ratio and high gust ratio runs. The 'pitching' lift coefficient is the average lift coefficient across both wings. The maximum red percent decrease in lift coefficient between pitching and no pitching conditions is around 43% and 33% in low and high gust ratio conditions, respectively.

Figure 8. Summary of wing chord lift coefficient with non-dimensional wrist distance assuming no wing pitching motion.
Download figure:
Standard image High-resolution image3.4. Flight dynamics
The results of the height change are shown in table 1. Both regimes displayed a similar resultant height after gust interaction. In the low gust regime, the height change remained between 2.20 and 4.15 cm, with an average of 2.92 cm. In the high gust regime, the height change remained between 0.90 and 4.11 cm, with an average of 2.67 cm.
Table 1. Tracked height changes in low and high gust ratio runs.
| Low gust ratio runs | |
|---|---|
| Run number | Δ h (cm) |
| 7 | 2.48 |
| 8 | 2.20 |
| 9 | 2.86 |
| 10 | 4.15 |
| Mean | 2.92 |
| High gust ratio runs | |
| 1 | 4.11 |
| 2 | 1.16 |
| 3 | 4.02 |
| 4 | 0.92 |
| 5 | 3.32 |
| 6 | 2.46 |
| Mean | 2.67 |
In figure 9 below, a graphical summary of the results is shown, starting before the fans in the right image. As the bird encountered the gust, the wings would pitch downward and the tail would pitch upwards (i.e. more positive pitch angle). The variable Δh represents the observed (actual) change in height tracked using flight videos. After gust encounter, the hawk would see a range of track changes, but all involved an increase in flight altitude. Therefore, Δh is shown to be above the zero line after gust encounter.

Figure 9. Summary of hawk gust response.
Download figure:
Standard image High-resolution image
4. Discussion
4.1. Wing response
The hawk displayed a consistent and predictable wing response pattern across gust magnitudes. The hawk entered the gust during or just before the downward portion of the flapping cycle, crossing the gust with wings fully or almost fully extended. A clear difference in the flapping cycle was observed between gust regimes. In low gust ratio runs, the hawk enters the gust at the upstroke-to-downstroke transition point, near maximum elevation angle, as the wings finish extending outwards. In high gust ratio runs, the hawk enters the gust halfway through the downstroke, when the wings are fully extended.
The wings pitched downwards during a gust encounter in both regimes, rapidly decreasing the geometric pitch angle. This pitching motion saturated at around −10∘ from the horizontal for the low gust ratio and around −20∘ for the high gust ratio. Similar responses have been observed in gliding owls, with wing pitch reaching a consistent −20∘ over comparable gust ratio regimes [21]. This downwards pitching motion curtailed lift coefficient increases in both regimes. A downwards pitch motion induces negative lift on the wing assuming no vertical gust, calculated using parts of equation (2) that do not account for vertical gusts. For low gust ratio runs, the lift coefficient slowly increased throughout the gust, preventing a large increase due to the impinging vertical gust. The high gust ratio runs have an initial rapid increase, before reaching a region of only slight increase or near plateau. Although the hawk does a remarkable job in minimizing gust effects, the increased lift coefficient and saturated pitch suggest a potential maximum gust mitigation potential from the wings. Even with a negative lift coefficient induced by wing pitching motion, the gust still overpowers the wing response, reflected in the increased lift coefficient. To completely mitigate the gust, analysis using flat plates suggests a minimum pitch angle around −43∘ for high gust runs, and around −30∘ for low gust runs [27]. The saturated pitch could be indicative of a physical limit to the response, or that the hawk recognizes no further improvement to the gust response from continued wing pitching.
The most similar previous study to the work presented here was performed in owls [21], and while there are clear similarities in the responses of the different species of birds, there are also marked differences that may be the result of biological differences between the animals or the specific experimental context in the two studies. Both birds decreased wing pitch angle during the gust response, with a change in wing pitch angle around −20∘ in owls, much less than observed in the hawk. The owls also reacted with substantial wing tucking, which was not observed from the hawk [21]. One possibility for the divergence is that the hawk's gust interaction was so brief that wing tucking was not required. The gust experienced by the owl was nearly double the length of the gust (in the flight direction) experienced by the hawk. A second possibility is that a smaller pitch angle change from the owl was prompted by the presence of increased wing elevation and tucking. The gust mitigation provided by absorbing some gust impulse into the wing (leading to the elevation change) and decreasing the area of force application would lead to a smaller pitch change. The hawk's wing pitch angle saturated at similar angles, across runs with and without significant elevation angle changes, suggesting that the hawk's pitch angle is not affected by elevation angle. Another difference was observed with change (Δ) in wing elevation angle. The owl displayed total changes between 20∘ and 30∘, while the hawk displayed changes in elevation angle between −40∘ and 30∘, depending on the gust regime. This could be explained by the flight regimes identified in each study. The owl glided before the gust encounter and did not have to flap much after the gust encounter [21]. The hawk still had to fly 9 meters to the ending perch, requiring at least one more flap, discouraging the hawk from either significantly changing the flapping pattern or ceasing the flapping pattern entirely. A flap naturally covers a larger range of elevation angles, leading to a larger variety of changes in elevation angles. The hawk also entered the gust at varied points during the flapping cycle across gust regimes, leading to yet more variation in the magnitude of change. There are a few potential causes of this discrepancy, one being a change in gust mitigation requirements. Some HGR elevation angles display an interruption of the flapping motion, where the wing pauses the downstroke over the gust, correlating to the increase in elevation angle and subsequent decrease. The absence of a similar pattern in LGR runs suggests the possibility of regime-specific gust mitigation or even learned responses, but the difference may be due to other factors as well, including day to day variation.
The observed height change initially does not appear to support the hypothesis of maximum gust mitigation potential. In both flight regimes, the hawk displayed a similar gust mitigation effectiveness, as evidenced by the similar tracked changes in height. This would suggest that the hawk can use the wing alone to mitigate gusts; however, the estimated lift coefficient, and by extension the lift forces, were much greater in the high gust regime. The hawk is expected to experience a greater height increase in the high gust regime relative to the low gust regime. A potential explanation for this is the presence of an additional factor that helps with gust mitigation, acting alongside the wing pitch reduction-based gust mitigation. Due to the complex nature of a gust response, several factors must be considered, covered in section 4.3. We hypothesize that the most important additional factor is the tail response. The tail can change overall dynamics through lift, drag, and moments throughout the bird's center of mass, leading to the similar mitigation ability observed.
4.2. Tail response
The tail possessed a similarly predictable response in pitch. At high gust ratio conditions a greater initial downwards pitch was observed, with initial pitch around −30∘ to −45∘, while low gust ratio conditions started with a pitch around −20∘ to −30∘. The tail pitch remained largely stable until gust encounter, after which it increased (i.e. becomes more positive) approximately linearly. This could be indicative of a passive response in which the tail can be modeled as a spring. This movement upwards would likely prevent an extreme downwards pitching moment on the body, but the extent of this effectiveness is challenging to categorize from the current measurements. The hawks tail could act similarly to bat tails or bird tails, which have been observed to act as pitch controls and pitch oscillation dampeners [29, 30]. Similar gust control schemes have also been observed in Anna's hummingbirds, with a significant increase in dorsoventral deflection (body-relative tail pitch) during gust interactions [20]. Glider modeling of the hummingbird's physical response showed that a deflectable tail moderates the pitch response after gust interaction; however, it should be noted that the hawk experiences a different gust regime than the hummingbird. In that study, the hummingbirds experienced gusts of magnitude 6–12 ms−1; coupled with a forward speed around 1.5 ms−1 it corresponds to gust ratios between 4–8. The hawk experienced gust ratios of 0.6 and 1.16, much smaller than the hummingbird. The hummingbird displayed significant body pitching, while the hawk did not. This could be explained by the gust ratio differences, where tail deflection is enough to prevent significant changes in body angle at lower gust ratios; however, the vast mass difference between hawks and hummingbirds (∼1000 g vs. ∼5 g) must be taken into account.
A rolling response of the tail was also observed, but with a less consistent pattern. A variety of counter-clockwise and clockwise rotations were observed, although counter-clockwise rotations dominated. A rolled tail provides a unique profile that contributes towards pitch and yaw moments [31]. The rolled tail could be used to mitigate pitch perturbations from the gust, as well as any yaw perturbations from instabilities in the flow.
4.3. Additional considerations
One explanation for the observed characteristics is the limitations of lift coefficient estimation scheme. Lift coefficients were estimated using an unsteady, 2D model that attempts to describe 3D aerodynamic behavior. Interactions between the flow, protruding feathers at the wingtips, and the bird torso leads to complex flow patterns that are hard to characterize without computational fluid dynamics. Other assumptions such as a rigid wing and zero spanwise flow also introduce error when compared to real phenomena. Nevertheless, because the lift coefficients were calculated in each gust regime using an identical scheme, the inaccuracies should have limited effect on the resultive comparisons that underpin our conclusions.
Another possible explanation for the disparate high- and low-gust results is the possibility of stall during gust interactions; a lack of comprehensive flow field data limited the consideration of stall in the gust response analysis. However, the interaction of a wing with a discrete transverse gust could cause rapid changes in angle of attack and can result in dynamic flow separation [28] and associated aerodynamic loading, akin to a dynamic stall event [32]. This could result in a transient increase in lift before a significant decrease and associated increases in drag and pitching moment which could play a significant role in the flight dynamics of the bird after the gust interaction. Any dynamic stall like events are expected to be most significant in the high-gust ratio condition, possibly explaining why the bird did not experience a change in trajectory despite higher estimated lift coefficient for that condition.
5. Conclusion
The response of a hawk flying through a discrete transverse gust was defined by characteristic wing and tail dynamics. Upon encountering the gust, the hawk pitched both wings sharply downwards, before reaching a plateau of maximum pitch. The flapping motion was not disturbed in low gust cases, but a minor increase in wing elevation (i.e. abbreviated flapping motion) was observed during high gust cases. Wing pitching contributed to significant gust mitigation, as reflected in observed height changes and estimated lift coefficients. However, the gust effect still overcame the wing's mitigation motions alone, leading to increasing estimated lift coefficient during the gust encounter and in the high gust compared to low gust condition. Examination of the change in height over the gust revealed unexpectedly similar results in both regimes. Due to increased estimated lift coefficient over the wing from the gust, the high gust run was expected to display greater height changes; however, that was not observed. This suggests that additional unaccounted factors affected the response. One possible source is the tail response. At gust encounter, the tail rapidly pitched upwards which could act to mitigate body pitch changes, possibly reducing significant gust effects during exit. The tail also rolls left or right during the gust, likely contributing to both pitch and yaw stability, again reducing gust effects on the flight dynamics. Future research is needed to investigate the tail response and its aerodynamics to fully characterize the gust response.
Acknowledgments
The authors would like to acknowledge the assistance of Andrew Hopkins and all volunteers at the Auburn University Raptor Center for helping conduct the bird flight experiments. Furthermore, the authors acknowledge the members of the Applied Fluid Research Group and Dr Eldon Triggs and Mr Andy Weldon in the Department of Aerospace Engineering at Auburn University.
Data availability statement
The data that support the findings of this study are available at the following URL: https://figshare.com/s/60f3e1e42ea55d7bf6da.
Research compliance
The experimental protocol was approved by the Institutional Animal Care and Use Committee (IACUC - 2018-3302 and 2021-3911) and the US Fish and Wildlife Service (USFWS) scientific collecting permit (MB77511C-0, MB677361-1, and MBPER0009547).
Funding
This project was primarily supported by the Intramural Grants Program (IGP - 180297) at Auburn University. P S acknowledges the support of a NASA Space Grant Fellowship (NNH19ZHA001C) for data collection. TLH acknowledges the support of the National Science Foundation (IOS-1930886). V R acknowledges the support of the National Science Foundation (CBET-2145189) on Fluid-Structure Interactions, monitored by Dr Ronald Joslin.