
Abstract
Ram suspension-feeding fish, such as herring, use gill rakers to separate small food particles from large water volumes while swimming forward with an open mouth. The fish gill raker function was tested using 3D-printed conical models and computational fluid dynamics simulations over a range of slot aspect ratios. Our hypothesis predicting the exit of particles based on mass flow rates, dividing streamlines (i.e. stagnation streamlines) at the slots between gill rakers, and particle size was supported by the results of experiments with physical models in a recirculating flume. Particle movement in suspension-feeding fish gill raker models was consistent with the physical principles of lateral displacement arrays ('bump arrays') for microfluidic and mesofluidic separation of particles by size. Although the particles were smaller than the slots between the rakers, the particles skipped over the vortical region that was generated downstream from each raker. The particles 'bumped' on anterior raker surfaces during posterior transport. Experiments in a recirculating flume demonstrate that the shortest distance between the dividing streamline and the raker surface preceding the slot predicts the maximum radius of a particle that will exit the model by passing through the slot. This theoretical maximum radius is analogous to the critical separation radius identified with reference to the stagnation streamlines in microfluidic and mesofluidic devices that use deterministic lateral displacement and sieve-based lateral displacement. These conclusions provide new perspectives and metrics for analyzing cross-flow and cross-step filtration in fish with applications to filtration engineering.
Export citation and abstract BibTeX RIS

Original content from this work may be used under the terms of the Creative Commons Attribution 4.0 license. Any further distribution of this work must maintain attribution to the author(s) and the title of the work, journal citation and DOI.
1. Introduction
Ram suspension-feeding fish, including many herring, anchovy, mackerel, paddlefish, basking sharks and whale sharks, extract small food particles (e.g. phytoplankton or zooplankton, ∼10 µm–4 mm) as they swim with an open mouth [1]. Water must pass between the filter elements in the pharynx (e.g. denticles, gill rakers and branchial arches) to exit laterally as filtrate from the operculum on the side of the head. Particles that are not retained by the filter elements also exit laterally with the filtrate. Particles that are retained inside the conical pharynx become more concentrated as they travel posteriorly. To identify factors that significantly affect particle concentration and transport in ram suspension-feeding fish, here we studied the function of generalized gill rakers in ram suspension-feeding fish by applying computational fluid dynamics (CFD) and experiments using physical models with varying aspect ratios. Our focus was on the location and movement of particles as they exited laterally from the model. Our hypothesis predicting the exit of particles based on mass flow rates, dividing streamlines at the slots between gill rakers, and particle size was supported by the results of experiments in a recirculating flume. These results indicate that models of suspension-feeding fish gill rakers with a generalized shape operate using the physical principles of lateral displacement arrays in microfluidics and mesofluidics [2–4].
Historically, all suspension-feeding fish were assumed to use dead-end mechanical sieving [5]. The discovery that many vertebrate suspension feeders use a crossflow filtration mode shifted attention from the conventional view of perpendicular fluid flow through the filter during dead-end sieving, to the benefit of moving fluid parallel or tangentially across the filter during cross-flow (supplementary figure S1(a)) [6–8]. However, inertial migration and shear-induced diffusion during cross-flow filtration [9–11] in suspension-feeding fish mouths are at least an order of magnitude too low to be the main causes for the retention of particles during fish suspension feeding [6].
Vortical cross-step filtration in suspension-feeding fish is a modification of cross-flow filtration that takes advantage of the vortices generated downstream from the filter elements to suspend, concentrate and transport particles with reduced clogging (supplementary figure S1(b)) [12–15]. This application of vortices inside the gaps between filtration structures is distinct from cross-flow filtration modes used for industrial processing of beverages and foods, wastewater and pharmaceuticals [16]. Like cross-flow filtration, cross-step filtration incorporates the hydrodynamics of tangential flow across the filter surface. However, cross-step filtration differs by recognizing that persistent trapped (i.e. captive) vortices are generated as cross-flow passes over the 3D structure of the branchial arches and gill rakers [12, 17]. These oral structures serve as a series of 'steps' [18, 19] that generate vortices along the filter surface. These steps generate trapped vortices at Reynolds numbers (Re) across at least seven orders of magnitude [19]. Specialized filtration mechanisms involving vortices have also been reported to operate in models of the unique gill raker configurations of manta rays [20] and silver carp [21].
The branchial arches and the gill rakers of suspension-feeding fish form a d-type 'rib-and-groove' arrangement of steps, with a slot aspect ratio (slot width divided by raker height, figures 1(d)–(f)) less than 3–4 [12, 22]. Unlike fluids engineering systems of rough channels or corrugated pipes [23, 24], the slots between fish gill rakers do not have a completely solid floor. Instead, fish filtration surfaces are porous, and the gaps between the gill rakers are referred to here as slots rather than grooves. Because the boundary layer of the fluid above each step separates at the edge of the step, a vortical recirculation region is trapped downstream from each raker [13].
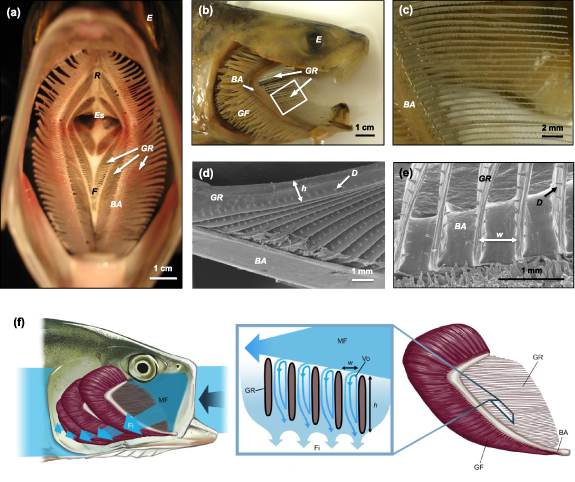
Figure 1. Morphology of American shad (Alosa sapidissima) used for mouth and pharynx proportions and gill raker dimensions in the physical and computational models. (a) Gape view inside the mouth and pharynx showing branchial arches, with gill rakers extending laterally. (b) Lateral view with operculum removed from the side of the head to show branchial arches and gill rakers. Gill filaments are involved in respiration rather than filtration. White box illustrates the approximate location depicted in c. (c) Enlarged view of the gill rakers. Protrusions on the rakers are tooth-like denticles. (d) Scanning electron microscopy (SEM) of gill rakers where h is the height of an individual raker. Height of the gill rakers is greatest at the attachment point with the branchial arch and decreases towards the distal end of the raker. (e) SEM of gill rakers where w is the slot width between two adjacent rakers. (f) Lateral view with operculum removed to show the mainstream flow entering the mouth, while filtrate exits through the slots between the gill rakers. © Virginia Greene/virginiagreeneillustration.com, all rights reserved, not covered by the CC BY license, used with permission. BA, first branchial arch; E, eye; Es, esophagus; F, solid midline on floor of pharynx; Fi, filtrate; D, denticle; GF, gill filaments; GR, gill rakers; h, raker height; MF, mainstream flow; R, solid midline on roof of pharynx; Vo, vortex; w, slot width.
Download figure:
Standard image High-resolution imageHere, our experiments in a recirculating flume introduced the use of physical models with a series of gill rakers that have varied slot aspect ratios in a conical pharynx, to analyze the movement of particles smaller than the gaps between the gill rakers. Rather than measuring particle retention inside the models, our experiments quantified the location and movement of particles as they traveled posteriorly and exited eventually through the slots between the gill rakers. The unexpected particle movements and exit patterns in these physical models are consistent with deterministic lateral displacement (DLD) and sieve-based lateral displacement (SLD) operating as bump arrays in an inertial flow regime [4, 25–28]. The geometry and hydrodynamic principles of lateral displacement devices provide a new direction for exploration in future experiments and CFD simulations on suspension-feeding animals. In turn, bioinspired models of the diverse gill raker morphologies in suspension-feeding fish could expand the fluids engineering applications of lateral displacement devices for particle separation and filtration.
Specific objectives of our study were to:
- 1.Test the hypothesis that the fraction of particles that exit from each slot of the conical physical models is proportional to the fraction of the model's total mass flow rate of water that exits through that slot;
- 2.Test the hypothesis that the dividing streamlines identified from the CFD simulations provide a predictive tool for particle exit;
- 3.Categorize particle exit trajectories within the slots;
- 4.Assess the effects of variation in slot aspect ratio.
2. Methods
2.1. Physical model construction
The oral morphology of American shad (Alosa sapidissima, Clupeidae) was used to quantify gill raker proportions for the four generalized conical models. The designs were based on dissections of the mouth and pharynx and measurements of gill rakers from SEM (figure 1) [29].
Ribs in the physical and computational models represented regularly spaced bony gill rakers, and slots between adjacent ribs were analogous to the gap between two rakers through which filtrate must pass when exiting the pharynx. The models altered two key gill raker dimensions that vary between and within suspension-feeding fish species: the width of the gap between gill rakers (slot width, w, 1.35 or 1.8 mm) and the height of the gill rakers in the downstream direction as water exits the slots (rib height, h, shallow models ∼1.5 mm, deep models ∼3.5 mm) (figures 1 and 2). As a result, the four model designs differed in slot aspect ratio [12] (wh−1, slot width w divided by raker height h; supplementary table S1). For ease of reference, the four models are referred to by the gap distance between rakers followed by a hyphen and the raker height, i.e. 1.35-shallow, 1.35-deep, 1.8-shallow and 1.8-deep. The models did not include the microscopic denticles present on the gill rakers of many ram suspension-feeding fish species including American shad [29, 30].

Figure 2. Four designs were used for the physical and computational models (lateral views, left; gape views, right). The gap distance between consecutive gill rakers in the models (slot width, w), representing the inter-raker distance (figure 1(e)), was either 1.35 mm (a), (b) or 1.8 mm (c), (d). In addition, two values for the raker height (h) were used, representing the height of rakers in the direction of water exiting the slots (figure 1(d)): ∼1.5 mm (termed 'shallow'; a, c) versus ∼3.5 mm (termed 'deep'; b, d). To maintain a similar surface area for water to exit the models [13], the 1.8 mm models were constructed with 21 slots, whereas the 1.35 mm models had 28 slots. Line Z1 to Z2 denotes anterior to posterior direction along the mid-frontal plane. GR, gill rakers; Es, solid wall simulating esophagus; F, solid midline on floor of model; Fi, filtrate; MF, mainstream flow; R, solid midline on roof of model; S, slots.
Download figure:
Standard image High-resolution imageValues reported for the slot aspect ratio of the branchial arches in suspension-feeding fish species range from 0.4–2.0 [12]. Slot aspect ratios in the 1.35-deep models and 1.8-deep models were most consistent with the approximate slot aspect ratio of 0.5 calculated from measurements of American shad gill rakers. The higher slot aspect ratios for the 1.35-shallow and 1.8-shallow models best represented dimensions towards the distal ends of the rakers, where the distance between the gill rakers increases and the raker height decreases [29].
The models were designed using SketchUp (Trimble Inc., Sunnyvale, CA) and 3D printed in acrylic polymer (frosted ultradetail, Shapeways Inc., New York, NY) for experiments in the recirculating flume. The gill raker and slot dimensions measured from the SEM specimens were scaled up by a factor of three and the flow speed for the experiments was adjusted correspondingly to preserve dynamic similarity.
The length of each conical model, from the mouth center to the posterior internal wall of the model, was 60 mm. The solid wall at the posterior of the model (figure 2) simulated the dead-end created by a fish's closed esophagus and by the American shad's reduced epibranchial organs [31]. The hydraulic diameter and entrance area of the gape were identical for all models. The ratio of exit area to entrance area [13] for the four models was 2.27 ± 0.05 (mean ± SD). We used a conical pharynx rather than a cylinder or a flat sheet because (1) the gape of the mouth and the anterior buccal cavity during ram suspension feeding are larger in diameter than the pharynx where the gill rakers and esophagus are located, and (2) the branchial arches are typically angled slightly, causing each consecutive raker to be offset slightly in a vertical direction from the preceding raker (e.g. figures 1(a) and (b)).
2.2. Computational fluid dynamics
2.2.1. Geometry, boundary conditions and meshing
The CAD geometries of the physical models (figure 2) were imported into ANSYS DesignModeler 2019 R1 (ANSYS Inc., Canonsburg, PA, USA) to create a flow domain for CFD. A half-cylinder-shaped virtual flow tunnel 5 m in length and with a radius of 0.4 m was created around the conical pharynx model. The longitudinal plane of this half cylinder sectioned the fish head model midsagittally at 0.6 m from the inlet and is defined as a symmetry plane. The curved side face of the tunnel is modeled as a non-permeable surface that moves at the same speed as the water. The downstream base plane is defined as a pressure outlet set to zero gauge pressure. The no-slip (i.e. 'wall') condition was enforced at the surfaces of the gill raker models. The posterior wall of the cone was solid enough to simulate the closed esophagus of fish. The upstream base plane was defined as a velocity inlet with a flow speed of 0.193 m s−1 to match the (physical) flume speed, with default values for turbulence (intermittency = 1; turbulent intensity = 5%; turbulent viscosity ratio = 10). These boundary conditions were assigned to the respective surfaces in the CFD solver software ANSYS Fluent.
The flow domain geometry was imported into ANSYS Meshing to create a finite-volume mesh consisting of a mixture of tetrahedra, hexahedra and quadrilateral cells as optimized by the meshing algorithm to fit the fluid spaces. The fineness of the mesh is controlled by imposing an edge length maximum for surface mesh elements at the surfaces of the pharynx model (0.05 mm) and at the outer boundary (50 mm). The mesh element size was allowed to increase away from the pharynx model at a growth rate of 1.1. The final meshes consisted of about 115 million cells. A mesh convergence test was conducted by comparing the solutions for mass flow rates entering the 1st, 14th and 28th slot of the 28-slot model. While a change of about 10% was observed between refining the mesh element edge length at the cone from 0.2 to 0.075 mm, less than 1% difference was found when refining from 0.075 to 0.05 mm. We can therefore safely conclude that the 0.05 mm mesh was sufficiently fine.
2.2.2. CFD solving
In ANSYS Fluent, the physical properties assigned to the main fluid zones were those of normal water at 20 °C (density 998.2 kg m−3, viscosity 1.003 mPa s). The CFD solver was used to calculate the time-independent (i.e. steady-state) Re-averaged flow solutions. To account for the effects of turbulence associated with internal flows at Re above 4000 or in the transitional flow regime between 2000–4000 [32] (here Re at the mouth aperture = 4420 for a 40 mm hydraulic diameter, and 0.111 m s−1 posterior water flow), the four-equation shear stress transport (SST) model was used in the CFD solver ANSYS Fluent. This model combines two commonly applied models: the κ −  model in the free stream and the κ − ω model near the walls. These are two models of the fluid's turbulent kinetic energy (κ) and its dissipation rate (ω or ), which have been shown to provide stable and close estimates of turbulence intensity when used together as the SST formulation in pipe flows [33].
The default solver settings of ANSYS Fluent 2019 R1 were used (SIMPLE scheme; least squares cell-based gradient treatment; second-order pressure discretization; second-order upwind for momentum; first-order upwind for turbulent kinetic energy, specific dissipation rate, intermittency and momentum thickness Re). Calculations were run for 1500 iterations on a computer with 36 processor cores. Iterative convergence is ensured by monitoring mass flow rate at the entrance of the middle slot and drag force on the entire filter model, together with the scaled residuals of the governing equations.
Mass flow rates were computed for water flows entering each slot. Due to mass conservation, this is equal to the mass flow rate at the exit of the slot. These values apply to a single side of the physical model due to the imposed symmetry plane. In the interior of the conical model, the dividing streamline was determined for each slot at the level of the center of the model. The dividing streamline was identified as the most lateral streamline not exiting through that slot (i.e. the stagnation streamline).
2.3. Recirculating flume experiments
Data were collected in a recirculating flume (18 cm × 18 cm × 90 cm working section, 100 l total volume) fitted with a Hexcel collimator (Plascore Inc., Zeeland, MI). The models were suspended using an L-shaped sting attached to the closed downstream end of the model.
For each trial, five portions (0.2000 ± 0.0001 g) of Golden Pearls pellets (800–1000 μm dehydrated size, Aquatic Foods & Blackworm Co., Fresno, CA) were hydrated with 35 ml of tap water for 5 min. Particles were released at 5 s intervals at a consistent location in the flume downstream from the model. From this location, the particles dispersed randomly as they were circulated through the flume before reaching the entrance of the model. Hydrated particles are non-rigid and roughly spherical (density 1.02–1.09 g cm−3). The median minimum Feret's diameter was 91% of the slot widths in the 1.35 mm models and 68% of the 1.8 mm slots (supplementary figure S2). The mean minimum Feret's diameter measured in Image J (version 2.0.0-rc-43/1.51d) was 1.25 ± 0.13 mm (median 1.23 mm, range 0.94–1.64 mm, n = 270). The mean maximum Feret's diameter was 1.53 ± 0.18 mm (median 1.51 mm, range 1.20–2.26 mm).
American shad adults of the size modeled here consume zooplankton ranging in size from approximately 400 µm–30 mm (e.g. Cirripedia larvae, calanoid and cyclopoid copepods, and mysid juveniles) [34–36]. Thus, the particles used in the experiments were at the smaller end of the size range reported for adult American shad feeding, relative to the scale of the gill rakers in the physical models. The first 30 particles that interacted with the lateral side of the model were analyzed frame-by-frame (240 frames per second) in each of the four trials for each of the four models (480 particles in total). Use of the first 30 particles in each trial minimized the effects of particle–particle interactions within the models and any potential effects of filter clogging. In all models, slot number 1 is designated as the most posterior slot, with slot number increasing towards the gape of the model.
Most ram suspension-feeding teleosts for which data are available swim at 0.75–2.5 body lengths s−1 [37]. The American shad specimens on which the models for the current study were based were approximately 48 cm total length [29]. Because the shad raker dimensions were scaled up by a factor of three in the models, the flume speed was scaled down by a factor of three. This scaling of model dimensions and flume speed was done to maintain dynamic similarity between the flow past the simulated gill rakers and the flow past the gill rakers in a 48 cm suspension-feeding American shad swimming forward at approximately 60 cm s−1. The flow speed (19.3 ± 0.1 cm s−1, mean ± SD) was measured before each trial using a Geopacks MFP51 flowmeter (Devon, UK) in the center of the flume, when the model was absent from the flume.
2.4. Particle movement in the physical models
Like realistic prey, the hydrated particles were deformable and had slightly asymmetrical shapes. The particles were too small to be trapped inside the slots of the 1.8 mm models. However, approximately 15% of the particles that were carried by water into the 1.35 mm slots could become trapped between the walls of the slot instead of exiting the slot. Rather than focusing on particle retention, we focused primarily on particle movement inside the model, including the slot locations of particle exiting and trapping.
Particles that contacted the gill rakers were categorized as either (1) exiting or becoming trapped in the slot nearest to the location where the contact occurred or (2) contacting on a gill raker and subsequently continuing with the mainstream flow towards the posterior of the model. Particles that contacted the solid dorsal or ventral midline of the model were not included in the analysis of particle contacts because these contacts involved non-porous surfaces.
Each slot was divided into three zones of equal width for analysis: anterior, posterior and middle (supplementary figure S3). Exiting particles were categorized based on specific types of particle movement and raker contact within the slots (supplementary table S2). There were two main exit trajectory categories for particles, each with subtypes. Particles that became trapped within a slot instead of exiting were not included in the analysis of the exit trajectory.
2.5. Hypothesis 1 for particle exit and trapping based on mass flow rate
Because all particles eventually exited or were trapped, RStudio (Mac v 2022.02.3 Build 492) with R (v 4.2.0) was used to test Hypothesis 1 that the fraction of exiting/trapped particles at each slot was proportional to the fraction of the model's total mass flow rate of water (kg s−1) exiting that slot (figure 3(a)).

Figure 3. Bootstrap statistical analyses in R to (a) test Hypothesis 1 based on mass flow rate and (b) test Hypothesis 2 based on mass flow rate, dividing streamlines and particle sizes. Tests were performed independently for each of the four physical models. (a) Bootstrap analysis for Hypothesis 1 generated 10 000 random distributions of predicted slots for particle exiting/trapping according to a probability distribution based on the fraction of the model's total mass flow rate that exits through each slot. (b) In the 10 000 trials of the bootstrap analysis for Hypothesis 2, particles were assigned a radius at random from the size distribution of the minimum Feret's diameter measured for hydrated particles (n = 270) used in the flume experiments (supplementary figure S2). When the radius of a particle assigned randomly to that slot was less than or equal to the shortest distance between the dividing streamline (identified from the CFD simulations) and the medial surface of the raker preceding that slot, the program in R specified that the particle would be transported into the slot to exit or be trapped. When the radius of a particle assigned to that slot was greater than the shortest distance, Hypothesis 2 predicted that the particle would not exit or be trapped at the assigned slot because the center of the particle would lie medial to the dividing streamline (i.e. closer to the center of the model). In this case, the R program randomly reassigned that particle to one of the downstream slots in the model. Reassignment probability was based on the proportion of the remaining mass flow rate that exited through each of the downstream slots. Reassignment continued until the radius of the particle was less than or equal to the shortest distance calculated from the CFD for the dividing streamline exiting the randomly assigned slot.
Download figure:
Standard image High-resolution imageHypothesis 1 was rejected if the actual number of exiting/trapped particles at a slot in the flume experiments was greater than or less than that obtained from 97.5% of the 10 000 random distributions. Thus, the cutoff value for significance at each slot was P < 0.05. Because there were multiple tests for each model (one for each of the 28 slots in the 1.35 mm models and 21 slots in the 1.8 mm models), the false discovery rate control (FDRC) [38–40] was applied to adjust for multiple comparisons. Using the FDRC, the experiment-wise likelihood of acceptance of a falsely significant result was set at α < 0.05.
2.6. Hypothesis 2 based on mass flow rate, dividing streamlines and particle size
RStudio was also used to test Hypothesis 2 (figure 3(b)) that the number of particles exiting/trapped at each slot was proportional to the fraction of the model's total mass flow rate of water that exits through that slot, with an additional constraint on the particle size that could exit or be trapped based on the shortest distance between the medial surface of the raker preceding the slot (i.e. the medial surface of the anterior wall of the slot) and the dividing streamline that had been identified from the CFD.
The quantification of particle movement in the physical model, the measurement of particle sizes, the identification of dividing streamlines in the CFD, and the coding in R were each conducted by a different researcher without reference to the other data sets that might influence the data collection and analysis.
2.7. Two-way ANOVAs on slot width and raker height
Using RStudio (version 4.2.1), Bartlett's tests for homogeneity of variances and Shapiro–Wilk tests for normality were conducted on the particle movement parameters quantified from the four physical models. When variances were homogenous and the data had a normal distribution, two-way ANOVAs were performed to determine whether slot width and raker height (fixed factors) significantly affected the parameters quantified from the models. The sequential Bonferroni method of Holm [41, 42] was applied with the probability of a Type I error less than an α value of 0.05 for the family of all two-way ANOVAs performed in the study. While the sequential Bonferroni method indicated significant differences between slot widths and raker heights, Tukey's honest significant difference (HSD) post-hoc tests were performed using RStudio.
3. Results
3.1. CFD simulations: pressure and velocity, flow patterns, dividing streamlines
In the four models, flow separation occurred immediately downstream of each gill raker, resulting in a recirculation region of lower flow velocity and lower pressure inside the anterior of each slot (figure 4) [43]. Subsequently, as the exiting fluid traveled tangentially across the recirculation region at the slot entrance and approached the posterior wall of the slot, the exiting fluid curved sharply around the vortical region and into the slot (figure 4(b)).
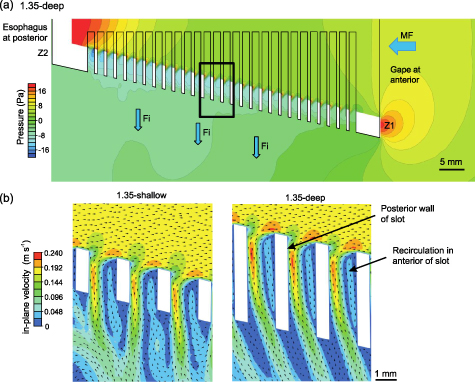
Figure 4. (a) Pressure contours and (b) velocity plots with vectors along the mid-frontal plane, with anterior (Z1) to posterior (Z2) corresponding to line Z1–Z2 in figure 2(b). Since the models are bilaterally symmetrical, only one-half of the mid-frontal plane is shown in (a). Black box in (a) indicates the location of velocity plots in (b). Flow separation occurred immediately downstream of each gill raker, resulting in a region of vortical flow inside the anterior of each slot. To exit the model, water traveled along the perimeter of the recirculation region. Fi, filtrate; MF, mainstream flow.
Download figure:
Standard image High-resolution imageFor each slot, the dividing streamline (i.e. the stagnation streamline) was identified as the streamline that separated (1) the fluid parcels exiting through that slot from (2) the fluid parcels that traveled farther posteriorly inside the model. Thus, the dividing streamline traveled towards the stagnation point on the posterior wall of the slot, where the flow diverged to either exit the slot or passed medially across the slot (figures 5 and 6). In practice, a dividing streamline was determined as the most lateral streamline not exiting through that slot after iterative adjustment of the streamline's point source position with a precision of 10 µm.
Figure 5. CFD simulation video of the flow through a 3D physical model depicting the location of the dividing streamlines.
Download figure:
Video Standard image High-resolution image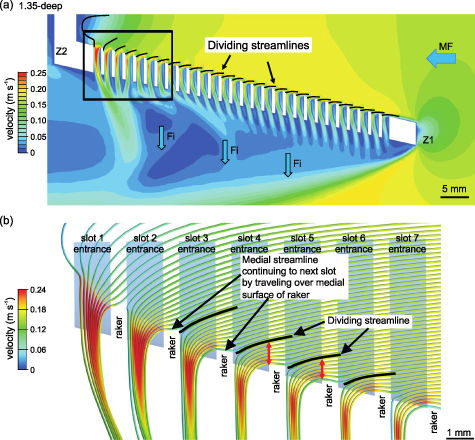
Figure 6. Dividing streamline (i.e. the stagnation streamline) travels towards the stagnation point on the posterior wall of the slot, where the flow diverged to either exit the slot or pass medially across the slot. For each slot in (a), the location of the dividing streamline is indicated by a solid black line. Black box in (a) indicates the location of the magnified view in (b). As the exiting fluid travels along the recirculation region at each slot and approaches the posterior wall of that slot, the exiting streamlines curve sharply into the slot. Shortest distance (red arrows) at which the dividing streamline for each slot passes the medial surface of the raker preceding the slot increases from the anterior to the posterior of the model.
Download figure:
Standard image High-resolution imageStreamlines that were located more lateral than the dividing streamline (i.e. closer to the slot) curved to exit that slot. Flows along streamlines that were located slightly more medial than the dividing streamline (i.e. closer to the center of the model) approached the posterior wall of the slot but then curved medially away from the slot to continue posteriorly towards the next slot in the model rather than exiting immediately (figures 5 and 6). As the mainstream flow traveled towards the posterior of the model, the dividing streamline approached the posterior wall of each slot at an increasingly steeper angle (figure 6). Therefore, the distance increased between the dividing streamline and the medial surface of the raker preceding the slot.
The Re calculated for slot width (1.35 or 1.8 mm gap between the gill rakers) was 260–350, and for the particle diameter (1.25 mm) was approximately 240. When the dimensions of the CFD model were scaled down by a factor of three with the input flow speed scaled up by a factor of three (i.e. constant Re) as a test of dynamic similarity to match the fish gill rakers in vivo, the overall flow patterns did not change but the pressure in the center of the model increased to approximately 50 Pa.
3.2. Particles that made contact with physical model surfaces and continued posteriorly
Of the 480 particles quantified across all four physical models in the recirculating flume, 82.7% ± 4% (mean ± SD) made contact with rakers at least once and continued posteriorly with the mainstream flow. The raker surface contacted by these particles was always the anterior wall of the raker, i.e. the wall on the posterior of the slot, which is exposed directly to the oncoming flow (figure 4(b)). Particles in contact with the anterior wall of the raker were observed to roll over the edge as they continued to travel posteriorly (figures 7(a) and (b), supplementary video S1).
Figure 7. (a) Video of two particles (∼1.2 mm diameter) that contact/roll on the anterior wall of multiple rakers (i.e. the posterior walls of the slots) in the 1.8-shallow model before one particle exits slot 3 (240 frames s−1, flume speed 19.3 ± 0.1 cm s−1, mean ± SD). (b) Series of images from the video (frames 2, 4, 6, 8, 10 not shown) illustrating one particle 'bumping' over the raker between slot 6 and slot 5 while traveling posteriorly in the 1.8-shallow model. Frames in the figure are numbered from right-to-left as water travels from right-to-left inside the model. Top: orientation of the model with respect to flow in the flume. Frame 3: particle makes contact with the posterior wall of slot 6 (i.e. anterior wall of raker). Frames 5 and 7: particle rolls over the edge of the raker. Frame 11: particle is in contact with the raker between slot 5 and slot 4 and is beginning to roll over the raker. Horizontal red lines illustrate that the particle is displaced towards the centerline of the model as the particle travels posteriorly. Particle eventually exited through slot 3; complete sequence provided in (a). Fi, filtrate; MF, mainstream flow; S, slot.
Download figure:
Video Standard image High-resolution imageOn average, each particle that made contact did so on four or five independent occasions (range 1–12) on the anterior walls of subsequent rakers as it traveled towards the posterior of the models (figure 7). The mean number of slots across which a particle traveled between two successive contacts was approximately two slots (supplementary table S3). Neither the slot width (1.35 versus 1.8 mm) nor the raker height (1.5 versus 3.5 mm) had a statistically significant effect on the number of particles that made contact with a raker, the number of contacts with a raker per particle (supplementary table S4) or the number of slots across which particles traveled between successive contacts (two-way ANOVAs, P > 0.05).
Although the particles were smaller than the gaps between the gill rakers, only 3.6% of the 480 particles tracked in the four models exited or were trapped within the anterior one-third of the models' porous region (i.e. ∼35% of the distance from the most anterior slot to the most posterior slot). This limited loss of particles anteriorly occurred even though that region accounted for approximately half of the total model exit area (i.e. half of the total cross-sectional area of the slots) and more than a third of the total mass flow rate of water that exited the models. In contrast, the majority of the particles (77% ± 3%, mean ± SD) exited or became trapped inside slots in the posterior 22% of the models' porous region, although this posterior region accounted for only 19%–23% of the total mass flow rate through the models.
Particles traveled an average of 1.6 ± 0.7 cm (mean ± SD) from the initial contact with the interior surface of the model to the subsequent exiting/trapping of the particle in a downstream slot. The average distance traveled between the initial contact and eventual exiting/trapping was approximately 30% of the distance between the first and last slots in the models. The total number of slots moved between the initial contact of a particle with the interior surface and eventual exiting or trapping was significantly greater for the 1.35 mm models compared to the 1.8 mm models (two-way ANOVA, P < 0.01). However, further analysis indicated that there were no significant differences between models when the number of slots was converted to distance traveled between initial contact of a particle with the interior surface and subsequent exiting or trapping (two-way ANOVA, P > 0.05).
3.3. Patterns in exiting particle trajectories
Of the particles that were tracked in the physical models as they exited through a slot (n = 364), 94% began the exit trajectory by making contact with the posterior wall of that slot (i.e. the anterior wall of the raker, supplementary video S1). None of the exiting particles began the exit trajectory by making contact with the anterior wall of a slot, and only 6% exited through a slot without making contact with a slot wall at least once.
Of the exiting particles that made contact with the posterior wall of the slot, 65% then reversed direction within the slot and either approached or made contact with the anterior wall of the same slot prior to exiting (e.g. supplementary video S1). Many of these particles even made contact with the anterior wall of the slot before exiting the model, and 24% of the exiting particles that made contact with the posterior wall of the slot reversed direction twice within a single slot before exiting (i.e. made contact with the posterior wall, reversed to make contact with the anterior wall, reversed again to exit the middle or posterior zones of the slot).
Although this pattern of particle contact on a wall followed by a reversal of direction during exiting occurred across all four model designs, the percentage of particles that reversed direction inside a slot differed significantly between raker height (1.5 versus 3.5 mm) but not between slot width (1.35 versus 1.8 mm) (two-way ANOVA with interaction, P < 0.0002 for raker height, P > 0.05 for slot width). For the 1.35 mm as well as the 1.8 mm slot widths, there was a significant difference in particle exit trajectory between raker heights, with the deep models having significantly more particles exiting with reversal between zones (category 1, supplementary table S2) and fewer particles exiting without reversal between zones (category 2, supplementary table S2), compared to the shallow models. Specifically, the deep models had significantly higher percentages of particles that reversed direction after making contact with the posterior wall of the slot and subsequently approached or made contact with the anterior wall of the slot before exiting (supplementary figure S4, Tukey's HSD, 1.35-shallow:1.35-deep, P < 0.05; 1.35-shallow:1.8-deep, P < 0.05; 1.8-shallow:1.8-deep, P < 0.003; 1.8-shallow:1.35-deep, P < 0.003).
3.4. Hypothesis 1 for particle exiting and trapping based on mass flow rate
A bootstrap statistical analysis tested Hypothesis 1 that the sum of exiting and trapped particles at each slot during the flume experiments was proportional to the fraction of the model's total mass flow rate of water exiting that slot (figure 3(a)). Hypothesis 1 is based on conventional dead-end sieving, in which the water acts simply as a carrier of the particles. At approximately 80% of the slots in the four physical models, probability distribution analysis followed by the FDRC showed significant differences between the number of particles exiting/trapped in the flume experiments and the mass flow rate at each of those slots (figure 8, two-tailed tests, FDRC α < 0.05). Significantly fewer particles exited or were trapped in slots in the anterior half of the models than expected based on the mass flow rate exiting those slots. Conversely, significantly more particles exited or were trapped in slots in the posterior 20%–25% of the models than expected (figure 8). Thus, Hypothesis 1 was rejected because the actual numbers of exiting/trapped particles were within the 95% confidence intervals in only a few transitional slots between the anterior region and the posterior region.

Figure 8. For most slots in the four physical models, the percentage of exiting and trapped particles in each slot (histogram, y-axis on left) was not proportional to the percentage of the model's total mass flow rate of water that exits through that slot (circles, y-axis on right) in (a) 1.35 mm models and (b) 1.8 mm models, rejecting Hypothesis 1. Posterior wall of the posterior slot is located at 0 cm, and the distance on the x-axis increases towards the gape of the model. Inverted solid triangles at the top right indicate slots where significantly fewer particles exited or were trapped than predicted based on the mass flow rate (two-tailed tests, FDRC α < 0.05). Triangles at the top left denote slots where significantly more particles exited or were trapped than predicted.  Orange triangle, deep slot only;
  blue triangle, shallow slot only;
  purple triangle, deep and shallow slots. Inverted triangles at the top right denote slots where significantly fewer particles exited or were trapped than predicted.
  Orange triangle, deep slot only;
  blue triangle, shallow slot only;
  purple triangle, deep and shallow slots. Hypothesis 1 was not rejected for slots not designated with a triangle.
Download figure:
Standard image High-resolution image3.5. Hypothesis 2 based on mass flow rate, dividing streamlines, and particle sizes
Hypothesis 2 (figure 3(b)) proposed that the number of particles exiting/trapped at each slot during the flume experiments was constrained by the percentage of the model's total mass flow rate of water that exits through that slot, but with an additional constraint on the maximum particle size that could exit or be trapped in that slot based on the shortest distance between the medial surface of the raker preceding the slot (i.e. the medial surface of the anterior wall of the slot) and the dividing streamline that had been identified from the CFD (figure 6). The calculations based on Hypothesis 2 (figure 3(b)) were consistent with the data from the flume experiments at nearly all slots in the anterior region of the four physical models (figure 9, two-tailed tests, FDRC α < 0.05). The predictions and the data from the flume were significantly different at some slots across the transition between the anterior region and posterior region of the physical models (slots 6 and 9 in figure 9(a), slots 7 and 9 in figure 9(b) and slots 8 and 9 in figure 9(d)). In the posterior five slots of the models, Hypothesis 2 predicted too many exits/traps in slots 1 and 2 of the 1.35 mm models and slot 1 of the 1.8 mm models, and tended to predict too few particles in slots 4 and 5 of the 1.35 mm models and slot 3 of the 1.8 mm models (figure 9).

Figure 9. Actual particles exiting (solid circles) compared to the predictions of Hypothesis 2 (open circles), which are based on the mass flow rate and dividing streamlines for each slot, with particle sizes assigned to slots randomly in the model from a size distribution of 270 measured particles (supplementary figure S2). Regions in gray are within the upper and lower bounds of 95% confidence intervals calculated based on Hypothesis 2.
Download figure:
Standard image High-resolution image4. Discussion
Multiple lines of research in fluids engineering have converged on the use of lateral displacement systems to achieve particle separation across an extensive range of Re numbers from 10−3 to 103 and particle sizes from submicrons to millimeters, encompassing both the Stokesian and non-Stokesian regimes [2, 26–28, 44, 45]. Here, through our study of generalized gill raker function in ram suspension-feeding fish, we introduced a biomimetic model that explores the operation of lateral displacement principles in suspension-feeding fish.
While the morphometrics of American shad were used to represent ram suspension-feeding fish dimensions, our biomimetic model is applicable to multiple species with a comparable rib-and-slot arrangement of steps. For example, suspension-feeding species that, like American shad, have gill rakers forming d-type ribs with a slot aspect ratio of less than 3–4 include Atlantic herring (Clupea harengus, Clupeidae) [46], European anchovy (Engraulis encrasicolus, Engraulidae) [46] and basking sharks (Cetorhinus maximus, Cetorhinidae) [47]. Therefore, the generalized gill rakers and oral cavity configurations used in our physical and computational models are broadly applicable and can be readily modified to reflect the specific dimensions of many species that have gill rakers with a d-type rib-and-slot arrangement of steps.
4.1. Biomimetic model of a lateral displacement array
Lateral displacement arrays consist of staggered obstacles for the separation of particles by size [2]. Each obstacle row is offset slightly from the preceding upstream row. This staggering of the obstacles causes all larger particles to make contact with the upstream edges of the obstacles by direct interception, resulting in consistent lateral displacement of the larger particles towards one side of the obstacle array [26, 45] (figure 10(c)). In contrast, smaller particles are not displaced laterally because they follow streamlines that weave between the obstacles in a 'zigzag' pattern (figure 10(d)). The deterministic physical principle in lateral displacement devices is that particles with a radius larger than the critical separation radius are displaced laterally upon direct interception with the obstacles and are therefore separated from smaller particles [2, 4, 45] (figure 10(a)). The critical separation radius is approximated by the shortest distance between the protruding edge of an obstacle and the streamline passing over that obstacle to terminate at the stagnation point on the next downstream obstacle. Numerical models for calculating the size of the critical separation radius in lateral displacement devices are still under development since the critical separation radius is affected by interactions between obstacle geometry and material, particle properties and flow properties [2].

Figure 10. (a), (b) Schematics of particle separation observed in our physical models of fish gill rakers compared to (c), (d) DLD arrays of microposts [48, 49] that are used for microfluidic and mesofluidic separation of particles at gap Re ranging from 10−3 to 103 and particle sizes from submicrons to millimeters, encompassing both the Stokesian and non-Stokesian regimes. Principles of SLD are similar [3]. Gill rakers in (a) and (b) are shown in cross-section, as in figures 4 and 6; DLD microposts in (c) and (d) are shown in top view. Fish pharynxes and lateral displacement arrays have extensive numbers of gaps; only the minimum number of obstacles needed to illustrate particle separation is depicted. Largest particle that can exit through the slot between rakers (red arrows in (a), (b)) is approximated by the location of the dividing streamlines in the CFD analysis, analogous to the critical separation radius for particles in lateral displacement devices. In our physical models (a) and in DLD (c), particles with a diameter larger than approximately twice the critical separation radius have a different trajectory compared to smaller particles. Larger particles 'bump' on the obstacle and therefore travel across streamlines in a 'displacement' mode (solid green arrow in (c)). In contrast, smaller particles follow a different trajectory by exiting with the filtrate through the slots between the gill rakers (b) or by traveling with streamlines in a 'zigzag' mode with no net lateral displacement (solid green arrow in (d)). Fi, filtrate; MF, mainstream flow.
Download figure:
Standard image High-resolution image
In our flume experiments, most particles that entered the model gape (83% ± 4%, mean ± SD, n = 480) eventually bumped into the wall on the posterior of a slot (i.e. the anterior wall of a gill raker) and then made contact an average of 3–4 additional times on the posterior walls of subsequent slots as the particles were displaced towards the posterior of the models before exiting (figure 7, supplementary video S1). This 'sliding' or 'bouncing' of particles in cross-flow along the porous branchial arches and gill rakers has been quantified previously using endoscopic videos inside the pharynx of multiple species of live fish during suspension feeding [6, 50–52].
CFD simulations provided insight into the flow patterns at the walls of the slots where particles made contact with the models and subsequently continued to travel posteriorly. As is characteristic for backward-facing steps in engineering applications involving tangential flow [12, 17, 20, 53], the generalized gill rakers in our models caused flow separation and a recirculation region (i.e. vortical flow) along the anterior wall of the slot downstream from each raker (figure 4(b)). The separated shear layer generated at each slot then proceeded to exit through that slot by traveling tangentially across the anterior of the slot entrance (figures 5 and 6). Subsequently, as the exiting fluid passed the vortical recirculation region and approached the posterior wall of the slot, the streamlines curved sharply into the slot (figures 5 and 6).
For each slot, our CFD analysis identified the dividing streamline as the most lateral streamline not exiting through that slot (i.e. the stagnation streamline). Thus, for each slot, the dividing streamline was the demarcation between the streamlines that turned to exit through that slot versus the streamlines that continued traveling toward the posterior of the model (figures 5 and 6(b)). The flume experiments support our hypothesis that the shortest distance at which the dividing streamline passes across the surface of the raker preceding the slot is the maximum radius of a particle that can exit the model by traveling through that slot (figures 5, 6(b) and 10(a), (b)). When a particle with a radius equal to or smaller than the maximum approaches the anterior wall of the subsequent raker, the exiting water carries the particle through the slot (figure 10(b)). Larger particles are excluded from that slot because the center of these particles will be located in the flow that continues past the slot entrance (figure 10(a)).
The maximum radius of a particle that could exit our physical models by traveling through the slot is analogous to the critical separation radius identified with reference to the stagnation streamlines in DLD and SLD devices that operate using principles of lateral displacement [2, 4, 26, 28, 48]. The bumping/rolling motion of particles in contact with the anterior edges of the rakers in the flume experiments (figure 7, supplementary video S1) is analogous to the 'bumping' motion of larger particles along the obstacle surfaces in a lateral displacement array [2] (figure 10).
The physical principle for the separation of particles by size in lateral displacement arrays is that particles with a radius larger than the critical separation radius are displaced laterally upon direct interception with the obstacles in the array [2, 45], causing the particles to cross streamlines (figure 10(a)). The 'bumping' of particles on obstacles in a lateral displacement array is a physical mechanism of particle sorting that occurs across laminar and turbulent regimes over at least six orders of magnitude of Re, operating in the Stokesian as well as non-Stokesian regimes. Although the exact size of the critical separation radius is dependent on the specific fluid dynamics and obstacle geometry of each lateral displacement device, the physical principle resulting in particle displacement is identical for all lateral displacement arrays. Our physical and computational modeling have demonstrated that the location of the dividing streamline for each slot, specifically the shortest distance between the dividing streamline and the raker surface preceding the slot, predicts the maximum radius of a particle that exited the model by passing through that slot.
Our 3D models provide a new platform for research on lateral displacement arrays inspired by biological systems. Relative to DLD devices operating in the Stokes regime at Re < 1, lateral displacement devices operating in an inertial flow regime [25–27] and SLD devices [3, 28] present unique design challenges and opportunities due to the increased complexity of the fluid dynamics involved. Given the hydrodynamic complexity and evolutionary success of particle separation in suspension-feeding fish, microfluidic and mesofluidic lateral displacement systems could benefit from consideration of the diverse gill raker structures, oral cavity configurations and operating parameters found in suspension-feeding fish. For example, the recently developed single-column DLD devices [54] and lattice-shaped microchannel networks [55, 56] share certain design features with oral cavity configurations that are common in suspension-feeding fish but are unconventional in microfluidics; further exploration of these intriguing design features could expand their applications.
4.2. Future improvements in biomimetic model design
4.2.1. Terminus for conical model
Rather than designing an unrealistic zero-pressure boundary condition at the posterior of the model, we used a solid wall that simulated the fish's closed esophagus (figures 1 and 2), but this caused disruptions of particle movement at the model posterior. As the mainstream flow traveled posteriorly in our models, the streamlines of the exiting fluid approached the slot entrances at increasingly steeper angles (figure 6(a)). Therefore, similar to the hydrodynamics reported as the flow approaches the terminus of SLD devices [28] and the lateral boundaries of DLD devices [44], the dividing streamline for each slot was increasingly distant from the surface of the raker preceding the slot.
Based on the extremely large distances between the dividing streamlines and the medial surfaces of the rakers preceding each slot at the posterior of the models, Hypothesis 2 predicted that slots 1 and 2 of the physical models would have the greatest percentage of exiting/trapped particles. However, in all physical models, slots 3–5 (the posterior ∼0.5–1.0 cm of the slotted region) had the greatest percentage of exits/traps (figures 8 and 9). In the flume experiments using physical models, the trajectories of particles within 1–2 mm of the solid wall were observed to be altered, occasionally even resulting in a reversal of the particle direction from posterior to anterior away from the esophageal wall. The actual slot number of exiting/trapping was recorded in the flume experiments, even if the particles had reversed direction while approaching the posterior of the model.
This discrepancy between the actual versus predicted distributions of particle exiting/trapping at the posterior of the models (figure 9) illustrates the complexities of designing realistic models for the entire pharynx in ram suspension-feeding fish and suggests that a more appropriate model could be achieved by extending the slotted region of the cone to minimize the cross-sectional area of the solid esophagus and reduce the higher pressures there (figure 4(a)). All lateral and posterior wall boundaries in a lateral displacement device cause a flow resistance that adversely affects particle separation [28, 44]. In addition, data on variation in slot width and raker height in specific regions of the fish pharynx [29] could be used to modify the slot dimensions and thereby fine-tune the pressure and flow velocity contours in slots near the terminus of the model, as suggested by Dijkshoorn et al for SLD devices [57].
4.2.2. Simplifying assumptions in physical and computational models
All current filtration models at the level of the gill rakers in suspension-feeding fish rely on steady flow with intra-oral velocities, pressures and streamlines that are not time dependent [15, 17, 20, 21]. This contrasts with the swimming kinematics of ram suspension feeding, during which yaw can generate cyclical intra-oral flow speed and pressure variations that could affect vortex formation and shedding downstream from the rakers [58, 59]. Additional simplifying assumptions of current filtration models for suspension-feeding fish, as well as lateral displacement devices [2], are that particle–particle interactions and the effects of particles on the surrounding flow field are neglected. These assumptions do not invalidate the current physical and computational models but should be recognized as potential areas for refinement in future models.
4.2.3. Denticles, microstructures and surface properties
In previous models of cross-step filtration by paddlefish and basking shark branchial arches, the closely spaced comb-like gill rakers that retain small particles were simulated using a porous mesh that covered the exterior of the slots between branchial arches (supplementary figure S1(b)). These earlier studies proposed that cross-step filtration could also operate in other suspension-feeding fish species, with the gill rakers rather than the branchial arches functioning as d-type ribs that form the walls of the slots and with the denticles or other protuberances serving the function of the porous mesh [12, 29]. Our study demonstrates that in the absence of such a porous mesh connected to the gill rakers, particles exited eventually from the conical models after being transported posteriorly towards the esophageal wall. Therefore, in order to retain particles smaller than the slot width between gill rakers [60] at the terminus of the conical posterior pharynx or in unsteady flow, modifications or additional components present in live fish should be incorporated in future models.
3D-printed gill rakers lack two important features that are present on the gill rakers of many suspension-feeding fish species: (1) goblet cells that produce mucus [21, 29, 61, 62] and (2) denticles or other protuberances (e.g. knobs, broom-like tufts, ridges) that extend from the gill rakers (e.g. figure 1(e)) [29, 62]. Both mucus and protuberances have been hypothesized or demonstrated in experiments with a diverse variety of live suspension-feeding fish to play key roles in particle retention and fluid dynamics [46, 63]. Microridges detected on the leading edge of basking shark gill rakers have recently been demonstrated in CFD simulations to have the potential for profound effects on flow patterns during filtration [47]. Given the extensive interactions reported here between particles and the gill raker walls, modifications of the wall surface properties and microstructures by mucus, tissue layers and/or protuberances will alter particle trajectories within the slots. Preliminary flume experiments with physical models of gill rakers indicate that these particle movements can be affected by the presence of a sticky mucus analog and by protuberances on the gill rakers. Surface properties, including surface roughness and protuberances, are an active area of research in DLD [2, 45, 64, 65]. Biomimetic models of the diverse protuberance geometry (e.g. denticles and other microstructures) found on suspension-feeding fish gill rakers could further inform the design of lateral displacement devices in microfluidics and mesofluidics.
5. Conclusion
Our biomimetic model of suspension-feeding fish gill rakers applies the principles of lateral displacement arrays that are used for the size separation of particles in microfluidics and mesofluidics. Flume experiments with physical models combined with flow profiles from CFD simulations demonstrate that, at each slot, the shortest distance between the dividing streamline and the surface of the raker preceding the slot predicts the maximum radius of a particle that exited the model by passing through the slot. This theoretical maximum radius is analogous to the critical separation radius identified with reference to the stagnation streamlines in DLD devices ('bump arrays') and SLD. Particle exit trajectories in our physical models indicate that improvements in model design inspired by suspension-feeding fish biology should include modifications of raker surface properties (e.g. sticky mucus analogs) and microstructures (e.g. denticles, ridges). The specialized morphological features of the denticles, gill rakers and branchial arches that have evolved in suspension-feeding fish are a rich source of material for future quantification of the relationships between filter element structure, fluid dynamics, feeding behavior and ecology in suspension-feeding fish. The geometry and hydrodynamics of suspension-feeding fish oral structures provide a biomimetic model that can be explored with the goal of designing more efficient particle separation and filtration devices for a range of applications. Since our models use a basic gill raker structure that is common across many orders and families of suspension-feeding fish, these results open a new direction for experiments to quantify connections between gill raker structure, dividing streamline position, critical separation radius of particles, and food particle sizes consumed.
Acknowledgments
We thank Eric Hilton and William Buchser (comments on an earlier draft), Tom Meier (flume construction) and Virginia Greene (figure 1(f), supplementary figure S1).
Data availability statement
The data that support the findings of this study are openly available at the following URL/DOI: https://doi.org/10.5061/dryad.pnvx0k6rv.
Funding
The study was supported by grants from the University of Antwerp (SEP BOF FFB190380), the Agence National de la Recherche (ANR-16-ACHN-0006-01), the European Union (HORIZON-MSCA-2021-DN Project 101073100 Nature4Nature) to S.V.W., and by research leave from William & Mary to S.L.S.
Conflict of interest
The authors declare no competing interests.
Author contributions
Conceived, designed and conducted the experiments: S L S, E M W. CFD simulations and analysis: S V W. Data analysis and interpretation, and figure preparation: E M W, P D H, S L S, S V W. Wrote manuscript: S L S, E M W. Reviewed manuscript: E M W, P D H, S V W, S L S.
Supplementary data (0.3 MB PDF)
Supplementary Video S1 Particle contacts /rolls on rakers, then contacts posterior wall of slot (arrow 1) during exit and reverses direction to contact anterior wall of slot (arrow 2) (7.4 MB MP4)