


Abstract
The recent deuterium–tritium campaign in JET-ILW (DTE2) has provided a unique opportunity to study the isotope dependence of the L-H power threshold in an ITER-like wall environment (Be wall and W divertor). Here we present results from dedicated L-H transition experiments at JET-ILW, documenting the power threshold in tritium and deuterium–tritium plasmas, comparing them with the matching deuterium and hydrogen datasets. From earlier experiments in JET-ILW it is known that as plasma isotopic composition changes from deuterium, through varying deuterium/hydrogen concentrations, to pure hydrogen, the value of the line averaged density at which the threshold is minimum,  , increases, leading us to expect that
  (T) <
(T) <  (DT) <
  (D) <
(D) <  (H). The new power threshold data confirms these expectations in most cases, with the corresponding ordering of the minimum power thresholds. We present a comparison of this data to power threshold scalings, used for extrapolation to future devices such as ITER and DEMO.
Export citation and abstract BibTeX RIS

Original content from this work may be used under the terms of the Creative Commons Attribution 4.0 license. Any further distribution of this work must maintain attribution to the author(s) and the title of the work, journal citation and DOI.
1. Introduction
The H-mode was 1st reported in 1982 [1]: when plasma heating exceeds a certain threshold a transition to an improved confinement state takes place in the plasma, turbulence is reduced and a transport barrier forms at the plasma edge. H-mode is now the conventional operating regime in most tokamaks that can achieve it, and the associated improvement in confinement in the form of a pedestal for density and temperature makes it, so far, the chosen operating regime in future tokamak fusion experiments. Ensuring access to the good confinement associated to the H-mode is considered essential for ITER success, and so it is important to document and understand the isotopic dependence of the L-H power threshold (PLH), especially for the fusion-relevant mixtures of 50% deuterium, 50% tritium. Additionally, the data presented here can contribute to the design of early, non-active, operating phases in future fusion devices.
A 1989 review of the ASDEX H-mode already indicated that hydrogen (H, protium) plasmas have higher L-H threshold power than hydrogen–deuterium mixtures [2]. The power threshold of hydrogenic isotopes including tritium was studied in the 1997 D–T campaign at JET [3], leading to the conclusion that PLH in hydrogenic plasmas is proportional to 1/Aeff, where Aeff is the effective isotopic mass.
More recent JET-ILW results have shown that not only do H plasmas in general have a higher PLH than deuterium (D) plasmas, but there is a clear shift in the density at which the power threshold exhibits a minimum ( ) to higher densities for H relative to D [4–8]. Additionally, for fixed toroidal field, Btor, the L-H transition power threshold and
  at JET-ILW have been shown to sensitively depend on plasma and divertor configuration, plasma current (Ip) and wall material [4, 6]. For the isotope study presented here all plasmas have the same shape, with lower X-point and ion grad-B drift towards the X-point (as illustrated in figure 1, to be discussed in detail later), usually named horizontal target (HT) or V/H (because the high field side strike line is on a vertical tile and the low field side strike line on a tilted, almost horizontal, tile).
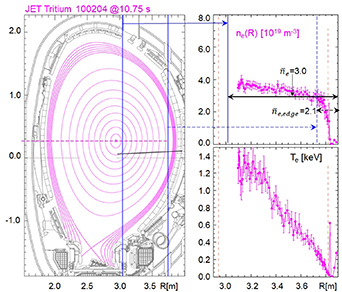
Figure 1. On the left, plasma cross-section of a typical Horizontal Target plasma, with outer strike in the tilted, almost horizontal, divertor tile. The tilted black line below the plasma equator is the line of sight of the HRTS diagnostic. The vertical blue lines show the path of the vertical interferometer lines that measure core and edge line averaged densities. On the top right is a density profile of this T plasma just before the L-H transition, mapped to the plasma equator, with vertical blue lines indicating the position of the corresponding interferometer lines. The height of the black double arrow lines indicates the value of core and edge line averages, the double arrows display the averaging region. Bottom right shows the electron temperature profile just before he L-H transition.
Download figure:
Standard image High-resolution imageInitial studies [9–11] revealed that in tritium L-H transitions can take place without auxiliary heating. Ohmic H-modes were first documented in D in DIII-D [12, 13], and subsequently reported in various other tokamaks (ASDEX Upgrade (AUG) [14], TUMAN-3 [15], Alcator C-Mod [16], HT-6M [17], and COMPASS-D [18]). They were expected and observed in T plasmas at JET in the recent campaigns.
In this manuscript, as is conventional [19, 20], the power threshold PLH is characterised either by  or by
or by  . PAux is the auxiliary heating power absorbed by the plasma, POhm the ohmic power, Pα
(which we took the liberty of adding to the conventional equation) is the α power produced by fusion reactions and absorbed by the plasma, Wdia is the plasma diamagnetic energy, dWdia/dt its time variation due to power ramps or steps, and Prad,bulk is the radiation from the plasma core, inside the 0.95 normalised poloidal flux surface.
. PAux is the auxiliary heating power absorbed by the plasma, POhm the ohmic power, Pα
(which we took the liberty of adding to the conventional equation) is the α power produced by fusion reactions and absorbed by the plasma, Wdia is the plasma diamagnetic energy, dWdia/dt its time variation due to power ramps or steps, and Prad,bulk is the radiation from the plasma core, inside the 0.95 normalised poloidal flux surface.
After many years, the 2008 multi-device ITPA L-H transition power threshold scaling [21] remains the standard against which L-H transition power threshold measurements are compared. It can be written as

with  the line averaged density in units of 1020 m−3, Btor the toroidal magnetic field in Tesla and S the plasma surface area in m2. Since that scaling was obtained with D plasmas, it is typical to multiply the formula above by (2/Aeff): that is the isotope-adjusted 2008 ITPA power threshold scaling, or PITPA-iso. The 2008 ITPA multi-machine power threshold scaling was derived from L-H Ploss data from points with density above
  , in the so-called 'high density branch', dominantly from experiments in C-wall machines, at low values of Prad/Ploss.
A reduction of ∼30% in the measured power threshold of metal wall devices compared with carbon wall tokamaks has been reported in AUG [22] and JET [4]. This observation led to an effort to select data only from metal wall devices to quantify PLH. For JET-ILW new scalings were derived [23] and published [9]. Since they are a sub-set of results from the ITPA task TC-26, they are named TC26 in this article. There are three versions for JET: one for horizontal target plasmas, one for both corner and vertical target plasmas, and one that represents both datasets with the same Btor and ne20 dependency, but a scale factor of order 2 to fit the higher threshold of corner and vertical target plasmas.
As our experiments in T and DT were all in horizontal target configuration, here we quote only the corresponding JET-ILW TC26 horizontal target scaling:

which displays a much stronger density exponent than the 2008 ITPA scaling. In this manuscript we compare our data to both these scalings (1) and (2). We shall see that high Prad,bulk is unavoidable in many plasmas in JET, and in consequence we will compare both Ploss and Psep with the ITPA scaling, following the lead of the ITER team [24], assuming low Prad is to be expected in ITER.
We do not include in this manuscript an extensive review of earlier L-H transition studies from JET-C or other devices, in the understanding that it is more useful for the community that we publish the JET-ILW power threshold results as soon as possible and release the data into the ITPA threshold database, rather than wait for the outcome of detailed physics studies.
This article is organised as follows: in section 2 we discuss experimental constraints imposed by tritium operation and by the diagnostics available at JET, and experiment design. In section 3 we present the power threshold as a function of density and isotope for three different choices of Btor and Ip, discussing some interesting data points in some detail. In section 4 we compare the high density branch data to the scalings. In section 5 we summarise our observations and discuss implications for future work.
2. Tritium constraints, diagnostics, experiment design
Operation in tritium has many technical implications [25], quite a few of which impact experiment design. Most importantly, the JET safety case limits the amount of tritium that can be injected (both via gas injection and with neutral beam injection, (NBI)) on any given experimental day to 11 g. Stringent tritium and neutron budgets, estimation and accounting procedures had to be followed. The number of pulses and amount of tritium available for each experiment had to be minimised.
The main chamber tritium gas injection modules (TIMs) [26] are located next to the horizontal bolometer array and therefore interfere with tomographic reconstruction. Since the measurement of bulk radiation is important to characterise PLH, we only used divertor TIMs in L-H experiments. Deuterium gas injection modules (GIMs) that do not interfere with bolometry were available both in divertor and main chamber, facilitating both D and DT experiments. Since we had already established in D plasmas that the choice of GIMs (whether located in main chamber or divertor) does not affect the power threshold [27], we were able to carry out experiments despite occasional issues with specific GIMs or TIMs: we simply switched to another suitable one.
Concentrations of H, D, T were measured in the sub-divertor region with a Penning gauge [28], and with the Balmer alpha line ratios measured with a high resolution spectrometer with viewing chords looking into the inner and outer divertor regions. Both measurements of concentration typically agree to within 5%.
In this paper we define as H plasmas those with H concentration cH = nH/(nH + nD + nT) greater than 0.97, deuterium as those with cD > 0.95, tritium those with cT > 0.95, but we included also some ohmic T transitions with cT between 0.9 and 0.95. The different criteria are practical. RF heated plasma cannot be purely D, DT or T, because 2%–5% of H needs to be present for the H minority scheme to work [29], and often in T plasmas the breakdown and termination were done with H to save T, so early and late ohmic transitions sometimes have lower cT. In plasmas labelled as DT the T concentration ranged from 0.47 to 0.71.
Electron density and temperature profiles can be measured with the high resolution Thomson scattering system, which provides profiles near the plasma magnetic midplane every 50 ms. For Btor > 2 T density profiles can be measured with high time resolution with a profile reflectometer, and Doppler reflectometry analysis can measure the perpendicular rotation of the fluctuations, related to the radial electric field, Er.
Line averaged densities can also be measured with the interferometer array every 1 ms or faster. Relevant lines of sight of both diagnostics are shown in figure 1, together with typical L-mode profiles just before the transition. For the profile in figure 1, the value of the line averaged density,  , is marked by the height of the black horizontal line extending from the core (vertical blue line at 3.034 m) out to 3.9 m. That is the region of the plasma that contributes to the line average,
  . Correspondingly the value of
  is marked by the height of a short black horizontal line, from the dashed vertical blue line at R = 3.73 m out to the edge. Although the figure is somewhat complex, the message is that for the flat density profiles typical of L-mode, the line averaged density,
  , is in fact very similar to the density at the top of the pedestal, while the edge line averaged density,
  , actually represents about 2/3 of the pedestal density. If the L-H transition is linked to local density or density gradient values, a critical value of
  may order the data better. On the other hand, as illustrated in figures 2 and 3,
  provides a better variable to identify that a transition has taken place. We will display our threshold data as a function of both variables.
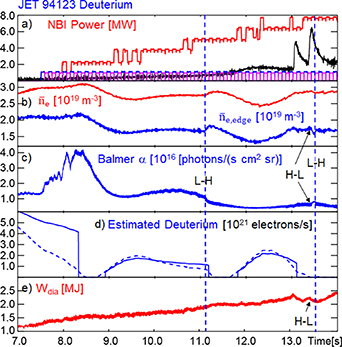
Figure 2. Time traces of L-H transition deuterium plasma with D-NBI heating, JET #94123. Blue vertical dashed lines mark the L-H transitions at tLH = 11.10 s and 13.5 s. (a) Total NBI injected power in red, power from core CX PINI in blue and from compensating PINI in magenta, radiated power inside 0.95 in black (both in D). (b) Line averaged electron density; (c) Balmer alpha light from the inner divertor; (d) estimates of D gas injected; (e) plasma energy.
Download figure:
Standard image High-resolution image
Figure 3. Time traces of L-H transition DT plasma with D and T-NBI heating, JET #99474 at tLH = 11.36 (after some dithers) and tLH = 17.41 s. Black vertical dashed lines mark the L-H transitions. (a) Total NBI injected power in red, power from D PINIs in blue, T PINIs in magenta, radiated power inside 0.95 in black. (b) Densities; (c) Balmer alpha light from the inner divertor; (d) estimates of D (blue) and T (magenta) gas injected (left axis) and tritium concentration in black (rhs axis); (e) plasma energy.
Download figure:
Standard image High-resolution imageWe show in figure 2 a typical example of L-H transition experiment in deuterium with slow NBI power ramp in D and in figure 3 an L-H transition experiment in DT, with NBI steps. They share some characteristics and differ in others. In both cases L-H transitions can be identified by a drop in Balmer α light in the inner divertor region taking place at the same time as an increase on edge density and plasma energy. Sometimes the transitions are very subtle and an analysis of the profiles and the pedestal magnetohydrodynamic fluctuations (M-mode [30]) are required.
When NBI is used for plasma heating, main ion temperature measurements (Ti) can be made with the core charge-exchange (CX) diagnostic [31]. The measurements require on/off modulation of the particular positive ion neutral injectors (PINIs) within the line of sight of the diagnostic (NBI system located in Octant 8), compensated by on/off modulation of a PINI toroidally displaced by 180° (NBI system located in Octant 4 and therefore not visible to the core CX diagnostic). In the NBI heated L-H experiments shown in figures 2 and 3 the bottom 1 MW of auxiliary heating is constructed with the core CX PINI (in blue) turned on/off for 100 ms periods, with the compensating PINI shown in magenta. The active PINIs are operated at low voltage to reduce the power per PINI to ∼1 MW. This does not affect the quality of the CX measurement and helps smooth the power ramps, at the cost of increased tritium consumption.
To hold the density constant while the power is ramped up we can use active feedback on the gas injected, aiming for a given  : initially gas injection is increased to compensate the loss of particle confinement due to increasing power in an L-mode. In figure 2 we show an example of a deuterium L-H experiment with active density feedback: oscillations of density (figure 2(b)) and gas (figure 2(d)) are common with this set-up because in JET the GIMs are relatively slow and no time was devoted to optimisation of the feedback system in this case. Once the L-H transition takes place and
  increases, the feedback system shuts off fuelling, until the density drops below the requested value, when the valve is opened again. Quantitative measurement of the gas injection rate is difficult for technical reasons, but the trends shown are correct, specifically the valve shut off shown in figure 2(d) after the first L-H, transition, reacting to the increase in
  . The dashed line in figure 2(d) is a different estimate of the gas injection rate that attempts to account for valve hysteresis.
Use of gas feedback imposes greater demands on fuel consumption, undesirable in T and DT experiments, and it is too difficult to control both density and tritium concentration in DT plasmas. Instead, recent L-H transition experiments were executed with gas input in feed-forward: after an initial transient at power turn-on the density settles or evolves rather slowly, so the power threshold for the transition can be measured at nearly constant gas and density, and slowly varying T concentration. An example of a deuterium–tritium L-H transition experiment executed with constant gas levels in each power ramp is shown in figure 3. In this case the edge density rises more sharply at the transition, since the particle source remains constant. As there is no feedback control of the gas injection rate (no hysteresis) we only show one estimate for D and T fuelling rates in figure 3(d) with calibration uncertainty of order 10%). Note that even though more D is injected than T during both power ramps, the T concentration slowly increases, already hinting at improved particle confinement of T relative to D.
For L-H transition experiments with NBI it is important to avoid sudden jumps or large steps on power delivered to the plasma, so the pre-transition state and the power threshold can be identified experimentally. Power ramps can be created with the neutral beam local manager [32]: different PINIs are turned on and off to smooth the power ramp. NBI power modulation works best when multiple PINIs are available on back-up, so a different one can be chosen when a particular PINI fails to deliver the expected power. The alternate option is to use small power steps. Careful design of the power ramps is needed to avoid undesired sudden power changes, as observed at 12.3 s in figure 2 (luckily after the first L-H transition), when there is a transient 2 MW change in NBI power.
Figure 3 illustrates various choices required by operation with tritium. On NBI heating we opted for 1 MW power steps rather than ramps with modulated power, alternating D and T-NBI, as shown in figure 3(a). This choice reduces T consumption in the NBI system. When possible we programmed two power ramps per shot, in the hope of obtaining two measurements of PLH at two different densities in one shot, as in figure 3, without the additional tritium consumption associated with beginning and end phases of the plasma. This set of choices reduce expected tritium consumption by about half. But they are not without consequences: for instance, the plasma state after the first power ramp ends is not always adequate to measure PLH with the second ramp. We will discuss one example of this later on.
Other constraints on experiment planning included the cancellation of a hydrogen campaign with H-NBI heating, originally planned before the first T campaign. This might have allowed us a better characterisation of L-H transitions, L and H-modes in H plasmas, with better diagnostics.
In the 2021 tritium campaign it soon became evident that there was a tritium containment issue related to the NBI system in Octant 4: only Octant 8 T-NBI was available. There were fewer PINIs available for the NBI power ramps (half at best), and Ti measurements had to be made via infrequent uncompensated notches in the core CX PINI.
Whenever possible we carried out L-H experiments with ion cyclotron radio frequency heating (ICRH or RF), in part to alleviate time constraints for experiments that required NBI and also to save tritium, and in part to investigate differences between RF and NBI induced transitions. In each case we chose the best/most reliable RF-heating scheme to optimise plasma heating. In D, D–T and T plasmas, fundamental N = 1 minority heating of hydrogen was used (the H concentration was kept at or below 5%), while in H plasmas, second harmonic N = 2 majority heating was used [29]. It is assumed that all the power launched by the antennas, measured experimentally, is absorbed in the plasma. The H minority scheme is known to have higher heating efficiency than the second harmonic N = 2 majority heating, which is characterised by stronger plasma–wall interaction and a larger fraction of radiated power (Prad/PICRH) [33]. Typical heating efficiencies of these two RF schemes in the experimental conditions described here are estimated in the range 80%–90% for fundamental and 60%–70% for 2nd harmonic heating, depending on the plasma properties. The exact heating efficiency values depend, in particular, on the plasma density. The ICRH power values used for the L-H power threshold estimates shown here do not attempt to account for differences in heating efficiency, and as such provide an overestimate of the power threshold in RF-heated plasmas.
Hardware problems of the RF system affected some of our experiments (see discussion about antenna phasing in [10]). Here we present only results obtained with correct RF antenna phasing control.
A review of the JET PLH carbon wall results [3, 34] found that for Btor = 1.8 T, Ip = 1.8 MA, the 1997 JET isotope dataset encompassed a rather narrow (low) density range, likely to be below  . With this in mind we designed our isotope experiments in the JET-ILW to measure PLH in a broad range of densities. JET-ILW isotope datasets are collected for three different choices of (Btor, Ip), all with the same shape, matching existing datasets in D and H.
3. L-H power threshold measurements
In what follows we show the results of our L-H transition studies for the three datasets we have available with well documented transition data. Comparison to scalings will be described in section 4, selecting high density branch points of the three datasets. It is important to obtain datasets with different toroidal fields, since eventually we need to extrapolate to devices with higher field.
All T and DT L-H experiments were carried out with the same plasma configuration, horizontal target. That configuration has lower PLH and lower gas consumption, since the outer strike line is far from the divertor cryogenic pump. Within each dataset, Btor and Ip can have variations of order 5%.
We should remind the reader that in JET-ILW, and for a given shape, it was found that the value of  for each species appears to be correlated with the ratio of
  to the Greenwald limit density [35] given by nGW = Ip[MA]/π/a2, with a the plasma equatorial minor radius. We call this ratio fGW =
  /nGW, the Greenwald fraction, and display it in the subsequent power threshold plots, with
  along the bottom horizontal axis and fGW along the top horizontal axis.
We report the densities at the time of the transition, and Ploss and Psep are averaged over 70 ms before the transition. Typical error bars on Ploss, Psep, Prad are of order 10%, not shown in the plots but recognisable in the scatter when enough datapoints are available. Error bars on density are less than 5%. A further word on data selection: we chose to display datapoints with good RF heating. Early in H and T campaigns there was a problem with the phase control in the RF system and those transitions were found to be unusual, with many dithers and increase in Prad after most transitions, we find it safest to discard them for this study. Those transitions are described in detail in [10]. Also, transitions in mixed H + T plasmas, with correct RF-phasing control, are described in a separate publication [11].
3.1. The 3 T 2.5 MA NBI heated PLH dataset
This is the dataset that allows us to identify  for D, T and DT plasmas.
In figures 4(a) and (b) we show the power threshold data in the conventional way, as a function of the plasma line averaged density,  , expressed in units of 1019 m−3. We display fGW, the Greenwald fraction, in the upper axis. In figures 4(c) and (d) we show Prad,bulk as a function of
  , and Psep as a function of edge line averaged density,
  , also shown in units of 1019 m−3. All L-H transitions shown are marked with solid symbols, while short-lived or marginal H-modes are displayed with '+' signs, the connection lines between the '+' signs imply there are various consecutive transient H-phases in the same shot. This typically happens in the low density branch, when each sawtooth arrival (or some of them) can drive a short-lived transition into M-mode [30]. The M-mode exhibits easily recognisable magnetic characteristics, an n = 0 m = 1 low frequency oscillation, and it is often used to identify L-H transitions.
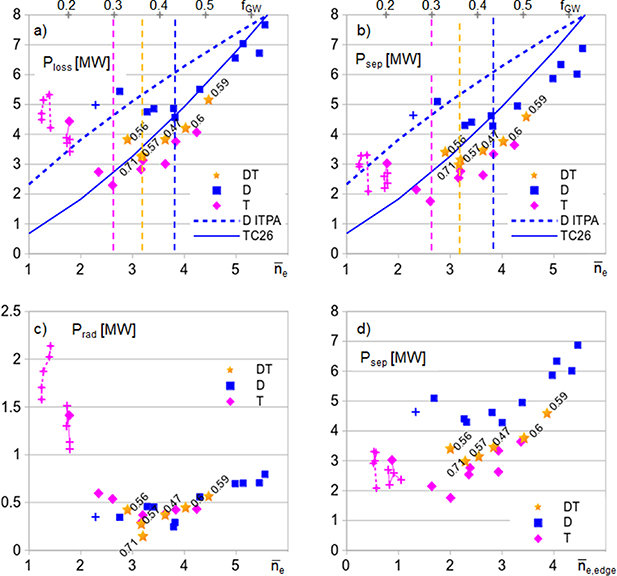
Figure 4. 3 T 2.5 MA L-H transition power threshold dataset, (a) Ploss, (b) Psep both displayed as a function of  (lower horizontal axis) and fGW (upper horizontal axis). These are all NBI heated plasmas: DT points are gold stars, deuterium blue squares, tritium magenta diamonds. Legends are the same in all plots, not always shown. Next to each DT datapoint is the tritium concentration before the transition. Also displayed are the D scalings: ITPA (dashed blue line) and JET TC26 HT (solid blue line), and vertical lines indicate the approximate location of
  for each species with the matching colours. (c) Corresponding Prad as a function of
  and (d) Psep displayed as a function of
  . Densities shown in units of 1019 m−3. Short-lived H-modes are marked with '+' signs.
Download figure:
Standard image High-resolution imageThe deuterium L-H threshold data, blue squares in figure 4, is a mixture of earlier L-H experiments, often with feedback controlled density and modulated NBI, and more recent data, with gas feedforward and NBI power steps. The two types of experiments give comparable results in D. The TC26 scaling, marked with a solid blue line in figures 4(a) and (b), is quite close to the deuterium Ploss datapoints. This is not surprising since that scaling was based on the JET-ILW high density branch D data available at the time for that plasma shape. The ITPA scaling is displayed with a dashed blue line. We have attempted to obtain D L-H transitions at higher fGW, since datapoints near fGW = 0.7–0.8 are of most relevance for JET scenarios and for ITER, but we ran out of experimental time in D: high density transitions are more complex to perform, they require large amounts of gas throughput and there is a small margin between the L-H threshold and a density limit instability. An additional complication is that the increased neutral pressure, produced by the increased gas injection that aims to raise the density, results in more efficient pumping, thereby requiring greater injection. For high density L-mode plasmas, the gas required to achieve a given target density value increases quadratically with target density.
The T and DT data was obtained with gas feed-forward and NBI steps. T is displayed with magenta diamonds, DT with gold stars. It is clear that as we move from D to DT to T plasmas the value of density at which PLH is minimum,  , drops, as well as the corresponding PLH,min. Next to each DT datapoint we display the tritium concentration, nT/(nH + nD + nT), at the time of the L-H transition. Near
  both Ploss and Psep are very similar for 57% and 71% levels of tritium concentration.
Both Ploss and Psep data display an ordering of the PLH data, with tritium obtaining the L-H transition at the lowest powers, a little higher in DT, and higher in D. The differences are not very large, especially between DT and T at higher densities.
The change in  , displayed in table 1, has interesting consequences: in T at
  a transition is observed with only 1 MW of NBI, while in DT, at
  , 2 MW of NBI are required, and in D at
  4 MW of NBI are required. This suggests it might be useful to consider a tritium rich plasma at the start of the H-mode transition for DT pulses in ITER or DEMO to facilitate H-mode access, if it is found that the power required to access H-mode is larger than expected. Further, a T-rich plasma would have better absorption of RF heating, as discussed in [36].
Table 1. Values of  for the 3 T 2.5 MA horizontal target dataset.
| fGW |

|

| Ploss | Psep | Paux | |
|---|---|---|---|---|---|---|
| D | 0.44 | 3.8 | 3.0 | 4.6 | 4.3 | 4.0 |
| DT | 0.37 | 3.2 | 2.3 | 3.3 | 3.0 | 2.0 |
| T | 0.30 | 2.6 | 2.0 | 2.3 | 1.75 | 1.0 |
At the moment the strategy to enter H-mode in ITER in DT is to start the pulse in D, to save T, then increase tritium level to that similar of D and apply higher D-NBI and RF heating. In the present plan this could be in the current flat top or during the current and density ramp, to take advantage of the reduced threshold and  at lower plasma current and the more gradual increase of alpha heating in those conditions. In the alternate scenario we propose, entry into H-mode at low density and low PLH in a T-rich plasma would lead to a rise in density due to the H-mode, without additional T injection. This lower PLH with higher T concentration, and increased RF absorption, needs to be balanced with possible increased radiation in a T-rich plasma, the lack of alpha heating after H-mode transition until the D density is raised and the possibility of increased T-throughput per pulse when such approach is followed. Detailed simulations will be necessary to ascertain which route is most promising, and to which scenarios it may apply best. Indeed such an approach was considered in the ITER research plan (see section 2.6.5.3 of [24]) as an option for better control of H-mode access in the long pulse and steady-state scenarios should 50–50 DT plasmas present complex control issues in this phase.
The accessible window for H-mode in the planned tokamak SPARC has been shown to be sensitive to the L-H threshold power (see figure 2 in [37]) and a lower threshold associated to a T-rich plasma would open a wider DT operational window at full field and current. This may well be true for other fusion devices as well.
For DT plasmas we have fitted the experimental profiles along the power ramp, using them as input to TRANSP interpretive simulations [38]. We found good agreement between database evaluations of absorbed power and TRANSP results. We established that for DT plasmas Pα is at most 50 kW just before the L-H transition, smaller than the expected errors in the measurements, making no significant contribution to PLH evaluation.
In tritium at the lowest densities large bulk radiation contributes to large Ploss, but Psep also clearly shows that these plasmas are in the low ne branch. Large bulk radiation is likely due to enhanced W sputtering in tritium bringing impurities (often Be, sometimes W) into the plasma and cooling it. Below  = 2 × 10¹⁹ m−3 the L-H transitions took the plasma into M-mode, and often into brief H-mode states, denoted with '+' signs. ELM-free phases followed by clear Edge Localised Modes (ELMs) only took place above
  = 3.3 × 10¹⁹ m−3. At that density the tritium plasmas are already in the high density branch.
In these NBI heated plasmas, as long as density is not too low, radiation is small, typically of order 0.5 MW, as shown in figure 4(c).
For this dataset, in D, we tested injection of CD4 as a possible means of increasing signal and acquiring edge charge-exchange Ti and Vtor measurements (the natural level of C impurities in the plasma dropped below detection after C was replaced by Be walls and W divertor). We found that an amount of CD4 that was still insufficient to provide good quality edge CX measurements in the L-mode increased Psep at the same density by at least 1 MW. We decided to do L-H experiments without CD4 injection and therefore without edge CX measurements, rather than struggle to deconvolve carbon effects from other dependencies of PLH.
At this toroidal field it is possible to measure the radial electric field, Er, with Doppler reflectometry. The analysis of Er profiles before the transition, and hopefully of Er evolution along the power ramp for these plasmas will be the subject of a future publication. We have begun the study of the possible relationship between  and the ion heat flux for this dataset, continuing earlier work in D in JET-ILW [39].
3.2. The 2.4 T 2 MA PLH dataset
This is our most studied dataset in D, since experiments can be executed at relatively low power, allowing the study of L-H transitions with either RF or NBI heating, while at the same time the magnetic field is high enough to enable reflectometry measurements of density profiles and Doppler reflectometry.
At this field and current PLH can be low enough that ohmic L-H transitions were observed in tritium, and it is also possible to obtain L-H transitions with RF heating alone. The plots shown in figure 5 display NBI and RF transitions in D and T, as well as an ohmic transition in T near  .
.

Figure 5. 2.4 T 2 MA dataset, (a) Ploss, (b) Psep, (c) Prad, all shown as a function of  , and (d) displays Psep as a function of
  . Deuterium data is shown as blue squares, tritium as magenta diamonds, with NBI heated plasmas shown as hollow symbols, RF heated plasmas shown as filled symbols, as described in legend. Tritium ohmic L-H transitions are magenta asterisks, transitions to short-lived H-modes marked by '+' signs. Densities shown in units of 1019 m−3.
Download figure:
Standard image High-resolution imageFor RF heated plasmas the RF frequency was 42 MHz, which locates the n = 1 fundamental H resonance at R = 2.6 m, near the normalised poloidal flux surface ΨN = 0.16, inboard of the sawtooth inversion radius in the high field side. This avoids large sawteeth, which could bring a dominant term to PLH at low density. Typically the H content in these RF heated D and T plasmas is of order 5%. In medium and high density plasmas the energies of the RF-heated fast H nuclei are moderate, lower than 500 keV. The RF tails produced with similar RF power levels are stronger in T than in D plasmas.
The Ploss plot in figure 5(a) shows similar power thresholds for NBI and RF in D. As shown in figure 5(c), radiation is much higher for RF heated plasmas both in D and T. This is likely due to higher sputtering produced by RF sheath effects (isotope independent), and/or by RF heated fast H ions (faster ions likely present in T than in D). Once radiation is discounted, Psep for D is lower for RF heated plasmas than for NBI heated plasmas, but the difference is negligible in T plasmas. In T plasmas in the high density branch some H-modes are not steady (displayed with '+' signs): as the density rises with the H-mode, the radiation increases and the plasma drops out of H-mode. When Prad is removed (Psep in figure 5(b)), the data points largely fall in line with the conventional transitions.
Table 2 shows  values, but there is vertical scatter in the data. We will later on choose a higher density as the bottom of the high density branch, to ensure we only label as high density branch datapoints that show an increasing trend of Psep vs.
  .
.
Table 2. Values of  for the 2.4 T 2 MA horizontal target dataset.
| fGW |

|

| Ploss | Psep | Paux | |
|---|---|---|---|---|---|---|
| D | 0.45 | 2.9 | 2.2 | 2.7 | 2.0 | 1.8 |
| T | 0.33 | 2.3 | 1.5 | 1.3 | 1.3 | 0 |
Again the TC26 scaling matches the D data better than ITPA 2008. So far we failed to obtain higher  points, which might have improved the identification of the
  scaling coefficient.
In deuterium plasmas at this field and current perpendicular flow measurements of the fluctuations with Doppler reflectometry (proportional to Er/B) have shown comparable profiles at the transition at similar  , regardless of heating method, NBI or RF [40]. More strikingly, in D the measured perpendicular flow profile does not appear to evolve along the power ramp, despite the fact that the electron pressure gradient does increase (in magnitude) with power. For this field and current we have also analysed the effect of plasma configuration on the L-H transition [41]. It was found that the edge perpendicular flow was significantly affected by changes in the divertor configuration in the region inside the separatrix, without providing an explanation for the very different power thresholds.
We recall that for this dataset it has been shown [6] that  and PLH decrease with plasma current, Ip: with Ip = 2 MA,
  = 2.9 × 10¹⁹ m−3 and PRF = 1.8 MW, while with Ip = 1.5 MA,
  = 2.2 × 10¹⁹ m−3 (or less) with PRF = 1.1 MW. In both cases fGW = 0.42. That D data supports the likely ITER strategy of entering H-mode at low current and density. We have no data on the possible Ip dependency of PLH in T or DT.
3.3. The 1.8 T 1.7 MA PLH dataset
This dataset allows us to compare PLH for H, D and T plasmas, the largest isotope range. It has already been presented in part in [9–11]. We have obtained a few additional datapoints in D and DT, which help us complete the description of our results. We do not address here the scans in tritium concentration in plasmas with varying concentrations of H and T, described in detail in [10, 11].
Results are displayed in figure 6 and table 3, as for the previously presented datasets. We see that in H Ploss is minimum at 2.92 1019 m−3, while Psep has a minimum at 3.14 1019 m−3.
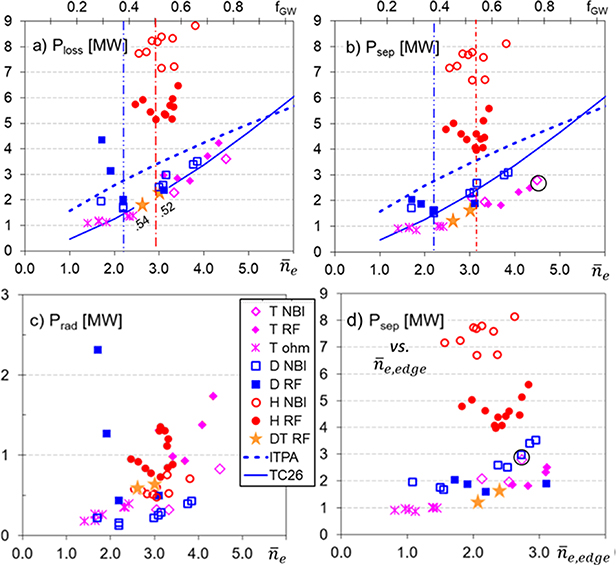
Figure 6. 1.8 T 1.7 MA dataset, as in figures 4 and 5: (a) Ploss , (b) Psep, (c) Prad, all displayed as a function of  , and (d) Psep displayed as a function of
  . Additionally NBI heated H points are hollow red circles, RF heated filled red circles. Scalings and
  marked as in figures 4 and 5. Densities shown in units of 1019 m−3. Next to the DT datapoints is the tritium concentration before the transition. The tritium point marked with a large black circle in plots (b) (highest density amongst all data points) and (d) (high but not highest edge density) is discussed later in conjunction with figure 7.
Download figure:
Standard image High-resolution imageTable 3. Values of  for Psep in the 1.8 T 1.7 MA horizontal target dataset.
| fGW |

|

| Ploss | Psep | Paux | |
|---|---|---|---|---|---|---|
| H | 0.54 | 3.1 | 2.3 | 5.3 | 4.0 | 7.7 |
| D | 0.38 | 2.2 | 1.6 | 1.7 | 1.5 | 1.0 |
| T | 0.40 | 1.4 | 0.8 | 1.1 | 0.9 | 0 |
As before, we see that TC26 reflects accurately the Ploss threshold of the high density D branch. Since for D plasmas in the high density branch Prad is small, Psep is also close to the TC-26 scaling, below the ITPA one. In terms of Ploss we see little difference between threshold values for D, DT and T plasmas in figure 6(a), and both are much lower than the H values. When radiation is subtracted in figure 6(b), we observe that Psep(T) < Psep(D) in general, and both are smaller than Psep(H), with the possible exception of the highest  NBI heated T datapoint marked with a black circle in figures 6(b) and (d) (discussed later). It does appear that RF heated plasmas in T have lower Psep than the NBI heated ones.
The most striking feature of this dataset is that NBI heated hydrogen plasmas exhibit much higher PLH than RF-heated ones [5, 7]. Until recently we have considered two possible explanations for it, based on the impact of the heating method on the Er profile. On the one hand, if NBI induces co-rotation in the plasma, and if the radial electric field is dominantly given by the v × B term, then co-Ip NBI might reduce the Er well depth, as reported in [42]. On the other hand, if Er is dominated by the ion pressure gradient, RF H majority heating may deepen the Er gradient more effectively than NBI heating [10]. Alas, we lack edge CX rotation measurements, and for this dataset we also lack Er measurements (the field is too low). But maybe impurities provide another explanation: we have recently learned that the H-NBI heated H plasmas had significant Cu content, which may have affected L-mode edge temperatures and therefore the power threshold [43].
The RF heating scheme used for H plasmas was second harmonic H-majority heating [33] at 51 MHz, placing the resonance at R = 3.19 m, outboard of the magnetic axis. As usual, in D, DT and T plasmas we used fundamental hydrogen minority heating (typically nH/ne < 5%), N = 1 fundamental resonance at 33 MHz, resonant at 2.46 m. As mentioned in section 2, H-majority heating features ∼20% less heating efficiency and somewhat higher radiation fraction (as seen in figure 6(c)). Because the heating efficiency effects were not taken into account in the Ploss and Psep estimates shown in figure 6, it is possible that the H-RF points (full red circles) are slightly overestimated and are actually closer to the D, T and DT data RF-heated points by as much as ∼1 MW.
Typically in these pulses the inversion radius was at 2.63 m inboard and 3.25 m outboard. Off-axis RF deposition was chosen to ensure small, frequent sawteeth, which is a beneficial situation for L-H transition studies, since often sawtooth arrival at the edge can trigger transitions.
In RF-heated H plasmas radiation is dominated by medium Z impurities (Ni, Cu), brought in by the interaction between plasma and antennae. In general RF sheath rectification effects are known to accelerate all ions in the SOL, even more so in D and T plasmas, possibly increasing Be and W sputtering, especially at the lowest densities and for the heavier isotopes. Additionally, slowing down of fast H RF-heated minority ions takes longer in T than in D plasmas, which can also lead to larger W content. A combination of both effects might explain why radiation is high for RF heated T plasmas at medium densities, and for D at low densities.
In tritium we observe ohmic transitions for densities below 2.5 × 10¹⁹ m−3, fGW = 0.4. Ohmic heating cannot be controlled externally without changing the plasma current, and Ploss is quite flat as a function of density from 0.25 to 0.4 nGW. We have no information on a low density branch in this case. At higher densities we observe large radiation in RF-heated T plasmas, at least half of it attributable to W [43].
The highest density NBI heated T transition (marked as a large magenta diamond surrounded by a circle in figures 6(b) and (d)) took place on the second power ramp of the plasma pulse, and W had already penetrated in the plasma core after the earlier H-mode phase. That transition is illustrated in figure 7 (blue vertical dashed line at 18.08 s), showing that its preceding L-mode had profiles typical of W-poisoned plasmas, with peaked ne profiles and somewhat hollow Te, quite different from the pre-transition profiles from the transition in the first power ramp, at 10.075 s (same as in figures 1 and 3). The study of this particular outlier lead us to investigate the relationship between the core and edge line averaged densities,  and
and  respectively with the pedestal density,
  . A comparison of line averaged densities with the corresponding density profile in figure 7(e) shows that for the L-H transition in the first power ramp, marked in magenta,
  is a good proxy for the pedestal density, while
  is too low to represent the pedestal height, as discussed earlier. When the profiles are atypical, as in the black and blue times and profiles that have strongly peaked density profiles due to W contamination, we observe that the relationship between
  and pedestal density changes:
  is now considerably higher than the pedestal density, due to the excessive contribution from the plasma core. Note that in all cases
  remains too low to characterise the pedestal density, but it provides a more local measurement, unaffected by the W poisoning. Neither
  nor
nor  provide a good measurement of the pedestal density in contaminated plasmas like this. The L-H power threshold scaling should be reconsidered using measurements of pedestal density, or pedestal density gradient. We plan to study this in the future.
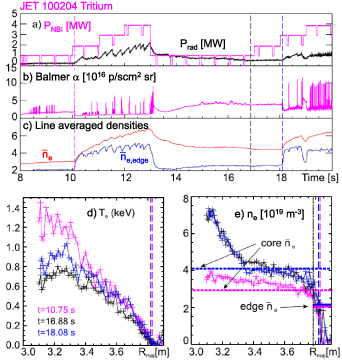
Figure 7. Tritium L-H experiment with double power ramps. Figure (a) at the top shows T-NBI power and Prad, (b) Balmer α light, (c)  and
and  . Vertical lines mark in magenta the time of the first L-H transition (tLH = 10.09 s), in black a time at the start of the 2nd power ramp (t = 16.88 s), and in blue the time of the 2nd L-H transition (tLH = 18.09 s). Figure (d) Te profiles and (e) ne profiles for those times, with the same colour coding, across the plasma mid-plane. The values of
  and
and  are shown as in figure 3, as coloured horizontal lines. They are the same for black and blue profiles.
Download figure:
Standard image High-resolution image4. Comparison to scalings
For each dataset we have identified the density beyond which Psep clearly increases as density increases: the bottom of the high density branch, called  . It can be higher than
  for three reasons: sometimes the PLH minimum is quite flat, or there is vertical scatter in the measurements, and in some cases the minimum has not been identified (for instance, the ohmic transitions in tritium). The values for each dataset and species are displayed in table 4. A linear fit of the bottom density values of D datasets to Btor results in the function
  (Btor) = 1.35 Btor − 0.277 with R2 = 0.99, and Psep at the minimum Psep,min(Btor) = 2.307 Btor − 2.936 with R2 = 0.88. If instead we base the fits on plasma current, Ip, we obtain
  (Ip) = 2.012 Ip − 1.195 with R2 = 0.998, and Psep,min(Ip) = 3.571 Ip − 4.779, with R2 = 0.956. This is consistent with the evidence of lower PLH at lower Ip at low densities.
Table 4. Values of density at the bottom of the high density branch, in horizontal target plasmas with corresponding fGW, Ploss and Psep in H, D, T and DT L-H transitions in JET-ILW.
| Btor | Ip | fGW |

|

| Ploss | Psep | |
|---|---|---|---|---|---|---|---|
| D | 3.0 | 2.5 | 0.44 | 3.8 | 3.0 | 4.6 | 4.3 |
| DT | 3.0 | 2.5 | 0.37 | 3.2 | 2.3 | 3.3 | 3.0 |
| T | 3.0 | 2.5 | 0.30 | 2.6 | 2.0 | 2.3 | 1.75 |
| D | 2.4 | 2.0 | 0.45 | 3.1 | 2.6 | 3.5 | 2.7 |
| T | 2.4 | 2.0 | 0.33 | 2.3 | 1.5 | 1.3 | 1.1 |
| H | 1.8 | 1.7 | 0.54 | 3.1 | 2.3 | 5.3 | 4.0 |
| D | 1.8 | 1.7 | 0.38 | 2.2 | 1.6 | 1.7 | 1.5 |
| T | 1.8 | 1.7 | 0.40 | 2.3 | 1.4 | 1.4 | 1.0 |
Having established which datapoints belong to the high density branch we display them together as a function of density in figure 8. To simplify the figure we do not distinguish RF and NBI heating as we did in figures 4–6.

Figure 8. (a) Ploss and (b) Psep as a function of  for all datasets. Darker shades and/or larger symbols correspond to higher Btor, Ip. Red circles are H, blue squares are D, magenta-pink are T, and orange stars are DT.
Download figure:
Standard image High-resolution imageIn figures 9(a) and (b) we compare Ploss and Psep with the isotope adjusted ITPA scaling:


Figure 9. (a) Ploss and (b) Psep compared to PITPA-iso expectation (1:1 black line), and also displaying 60% of PITPA-iso as black dashed line labelled 0.6.
Download figure:
Standard image High-resolution imageas described in [10]. We see in figures 9(a) and (b) that both Ploss and Psep are considerably lower than the ITPA scaling, for all species. But as discussed earlier, due to the large radiation of T plasmas, we find it more productive to consider Psep, which is near 60% of the ITPA expectation. As discussed in [10], this is in part due to the reduced PLH in metal wall devices [4, 22], and in part due to the fact that we are subtracting radiation, while the ITPA scaling was originally derived for Ploss, with plasmas that had low radiation. Aside from a possible correction factor to take into account these known dependencies, we find that the datapoints with the highest leverage on the density scaling are the ones with highest threshold: D in 3 T 2.5 MA at the highest densities and NBI-heated H at 1.8 T 1.7 MA. This suggests that future experiments in H and D might complement our data very usefully.
The comparison of our data and the isotope-adjusted TC26 scaling (formula (2) multiplied by (2/Aeff), hereafter called TC26-iso) is displayed in figures 10(a) and (b). As is to be expected, the TC26-iso scaling fits the deuterium Ploss data quite well (it was based on the Ploss(D) data available at the time), but both T and NBI-heated H data escape above its predictions. If we compare Psep to PTC26-iso (figure 10(b)) we see that only NBI-heated H and a couple of T points are above the dashed line that is 20% higher than the scaling, and only the 2.4 T RF-heated D data escapes below 80%.
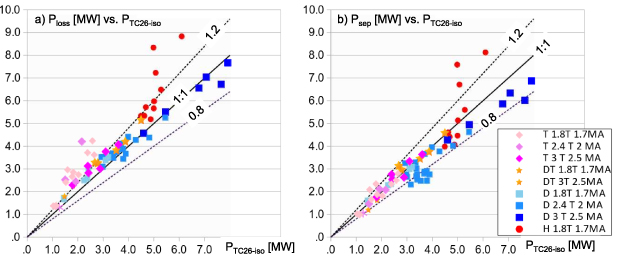
Figure 10. (a) Ploss and (b) Psep compared to PTC26-iso (the isotope adjusted PTC26) the dashed lines show 0.8 and 1.2 times the PTC26-iso expectation.
Download figure:
Standard image High-resolution imageTo better display our data range, we show Psep vs PTC26-iso in a log–log plot in figure 11 from 1 to 10 MW. Here we better appreciate that the lowest threshold DT point, at the lowest density at 1.8 T 1.7 MA, is 20% below the TC26 expectation, and there is quite some scatter in the RF-heated T data. On the other hand, the 3 T 2.5 MA DT points line up quite well with it, except the one at  which is nearly 20% above.

Figure 11. Same as figure 10(b), but in log–log plot.
Download figure:
Standard image High-resolution image
In general, although it is clear that T has lower threshold than D, lower than H, it remains unclear if the assumption that the isotope dependence of PLH is proportional to (2/Aeff) is quantitatively correct. We would have to analyse the data presented in this article in conjunction with the study of the power threshold in hydrogen + tritium mixtures before arriving at more quantitative conclusions on PLH isotope scaling.
5. Discussion, conclusions and future work
The plots shown in sections 3 and 4 clearly illustrate that the isotope adjusted ITPA scaling overpredicts both the Ploss and Psep required for the L-H transition in the JET-ILW. But here we must recall that in JET both Ploss and Psep can be at least a factor of 2 higher in corner or vertical target configuration, so we cannot use the predictions from horizontal target plasmas on their own to modify the ITER guidelines for L-H power threshold evaluations until that effect is understood. The same can be said of the lower than predicted Psep thresholds in RF-heated D plasmas, still not understood.
Deriving a new scaling from all the JET-ILW isotope data is far from trivial, and is beyond the scope of this manuscript, as we need to investigate configuration and profile effects further before extrapolating from horizontal to vertical target plasmas.
It is very clear from our data that  and the corresponding Psep,min observed in the horizontal target configuration depend strongly on Aeff, being highest for H, medium for D and lowest for T, for any given dataset, with the possible exception of the ohmic transitions in T at 1.8 T. This complements earlier AUG studies, in mixed currents and fields, which show a shift in
  between H and D [44, 45]. The AUG results, together with the critical ion heat flux that appears to explains them, have driven ITER modelling and led to the conclusion that in ITER
  is expected to be species independent, and near fGW = 0.4. That value is in fact not so far off from our observations in D, reported in table 3, but we do observe that T has lower
  and PLH,min than D in plasmas with auxiliary heating.
The strong scaling of PAux,min with Aeff does suggest it may be easier to enter H-mode in T-rich plasmas in any future DT fusion devices and experiments. This may be aided by the observed increased absorption of RF power in T-rich plasmas [36], if RF is applied during the L-H transition phase.
Studies of PLH in H-T, DT mixtures compared to H and D plasmas are published elsewhere [10, 11] and have not been reviewed here, but will need to be taken into consideration to make scalings and predictions. They were carried out only at 1.8 T 1.7 MA in horizontal target plasmas. They show that PLH does not simply scale with Aeff, not even in the high density branch of a single dataset: at the same  PLH(D) is not the same as PLH for a 50/50 mixture of H and T. The conclusion of [11] is that the L-mode transport of a 50/50 H + T mixture is not equivalent to the L-mode transport in a D plasma. Food for thought.
The results presented here are the starting point for a variety of more detailed studies, especially in terms of investigating critical profiles (kinetic and perpendicular rotation or Er) before the transition, and models for  variation. Similarly to the work done for D-only plasmas [39], work is underway to carry out a power balance analysis, characterise the role of ion and electron channels at the transition, and investigate if the ion heat flux can explain the changing values of
  in D, DT and T plasmas.
Work is planned to use profile evolution information from these experiments to validate L-mode transport models and L-H transition models, and hopefully contribute to make physics-based predictions of L-H threshold conditions. In particular the analysis of kinetic and Er profiles before the transition, and hopefully of Er evolution along the power ramp, for DT and T plasmas, will be the subject of a future publication.
In time, we aim to analyse the threshold data as a function of true pedestal density, probably more closely aligned to the physical mechanisms of the L-H transition. We propose to undertake a systematic study of the possible dependence of PLH on  vs.
vs.  or
or  , or even their gradients. It may help us understand the relative importance of local and global conditions on the transition itself. This will take time.
In forthcoming JET campaigns we hope to obtain a few additional data points to better characterise low and high density transitions. In D we will request data at 1.8 T near the minimum, and both in D and T we would benefit from obtaining data above fGW = 0.7, which is the lower bound of the typical H-mode operational space, and would provide information that most clarifies the density scaling of PLH. We also hope to obtain additional L-H experiments in D in the corner configuration, typical of the record DT shots. Ideally an H campaign with H-NBI heating would allow us to understand the very high PLH of NBI-heated H plasmas, or correct our earlier observations, if the high threshold was due to excessive Cu content and its consequences.
The effort of carrying out systematic L-H transition experiments in H, D, DT and T in the JET-ILW provided a wealth of data and we are just at the start of its analysis. We expect to increase our understanding of the fundamental physics of the beautiful phase transition between L and H mode, and finally challenge the various models of the L-H transition, as well as improve predictions for future devices.
Acknowledgments
The T, DT and subsequent D cleaning campaigns took place from December 2020 up to August 2022. This was a fraught and difficult time, given the combined challenges of the COVID pandemic and the Brexit uncertainties, aside from technical tritium operation challenges and evolving management procedures. The authors of this manuscript wish to acknowledge the enormous effort of the whole JET team, without which these unique experiments would have been impossible. In particular we would like to mention L. Horton, G. Sips, I. Carvalho, J. Bernardo and D. King. The work of the technical team is not reflected in the author list, but it was extraordinary, given the circumstances.
Regarding affiliations, we must clarify that some co-authors have moved away from the EUROfusion environment since the experiments took place, but still contributed to this work: J. C. Hillesheim is now at Commonwealth Fusion Systems, Devens, MA 01434, USA, L. Horvarth is now at Princeton Plasma Physics Laboratory, James Forrestal Campus, Princeton, NJ 08543, NJ, USA, George Sips at General Atomics, PO Box 85608, San Diego, CA 92186-5608, USA, and M. Fontana and M. Sertoli now work at Tokamak Energy Ltd, 173 Brook Drive, Milton Park, Abingdon, Oxon, OX14 4SD, UK.
This work has been carried out within the framework of the EUROfusion Consortium, funded by the European Union via the Euratom Research and Training Programme Grant Agreement No. 101052200—EUROfusion and from the EPSRC (Grant Number EP/W006839/1). Views and opinions expressed are however those of the author(s) only and do not necessarily reflect those of the European Union, the European Commission or the ITER organization. Neither the European Union nor the European Commission nor the ITER organization can be held responsible for them.
This work was supported in part by Spanish Grants FIS2017-85252-R and PID2021-127727OB-I00 funded by MCIN/AEI/10.13039/501100011033 and ERDF 'A way of making Europe'. The BSC part of this work has contributed through the Spanish National R&D Project PID2019-110854RB-I00 funded through MCIN/AEI/10.13039/501100011033 and from the the Departament de Recerca i Universitats de la Generalitat de Catalunya with code 2021 SGR 00908. This scientific paper has been published as part of the international project co-financed by the Polish Ministry of Science and Higher Education within the programme called 'PMW' for 2023.