


Abstract
A detailed cross-device investigation on the role of filamentary dynamics in high-density regimes has been performed within the EUROfusion framework, comparing the ASDEX Upgrade (AUG) and TCV tokamaks. Both devices run density ramp experiments at different levels of plasma current, keeping the toroidal field or q95 constant in order to disentangle the role of the parallel connection length and the current. During the scan at a constant toroidal field, in both devices the scrape-off layer (SOL) profiles tend to develop a clear SOL density shoulder at a lower edge density whenever the current is reduced. Different current behaviour is substantially reconciled in terms of the edge density normalized to the Greenwald fraction. During the scan at constant q95 AUG exhibits similar behaviour, whereas in TCV no upstream profile modification signature has been observed at lower current levels. The latter behaviour has been ascribed to the lack of target density rollover. The relation between the upstream density profile modification and detachment condition has been investigated. For both devices the relation between blob size and the SOL density e-folding length is found independent of the plasma current, with the observation of a clear increase in blob size and the edge density normalized to a Greenwald fraction. ASDEX Upgrade has also explored filamentary behaviour in the H-mode. The experiments in AUG have focused on the role of neutrals, performing discharges with and without cryogenic pumps, highlighting how high neutral pressure, not only in the divertor but also at the midplane, is needed in order to develop an H-mode SOL profile shoulder in AUG.
Export citation and abstract BibTeX RIS
1. Introduction
Plasma–wall interaction has been the subject of intense study in the context of fusion energy research for understanding the heat load, tritium retention and the lifetime of different plasma facing components. In recent years great effort has been devoted to the interpretation of scrape off layer (SOL) transport, with clear impact on the design of future machines as well [1]. Transport in the SOL region, resulting from competition between sources as well as parallel and perpendicular losses, is dominated by the presence of intermittent structures or filaments, which strongly contribute to particle and eventually energy losses both in the L- and H-mode regimes. The role of convective radial losses has become even more important due to its contribution to the process of profile broadening, also known as shoulder formation, in the L-mode, describing the progressive flattening of the density SOL profile at high density [2–9] where future devices are expected to routinely operate. This increased radial transport could pose serious problems for plasma facing components, enhanced by the recent observation that whenever flatter density profiles are established an increase of heat transport associated with the filaments is observed in the far SOL, with filaments carrying up to 1/5 of the power ejected at the separatrix [10]. Preliminary investigations suggested that similar mechanisms occur in the H-mode as well [11–15] and that filaments also strongly contribute to the power balance and SOL transport in the so-called H-mode density limit [16, 17]. The present contribution will report on the results of a coordinated effort within the EUROfusion medium-sized tokamak (MST1) framework between the ASDEX upgrade (AUG) and TCV tokamaks, to address the role of filamentary transport in high-density regimes both in the L- and H-mode. Similar methodology and techniques applied to largely different tokamaks, from a machine with a closed divertor, metallic first wall and cryogenic pumping system, to a carbon machine with a completely open divertor, allow consistent comparison of the results from the two devices. The experimental investigation presented hereafter will try to shed light on the different scientific uncertainties concerning the SOL density shoulder formation: is shoulder formation really associated with a filamentary transport regime transition? What is the relation between gas fuelling, divertor collisionality and divertor detachment with the upstream profile modifications? What is the role played by neutrals? To answer these questions the mechanism of shoulder formation and the role of filamentary transport have been tested against variations of plasma current and parallel connection length, and divertor neutral densities in the H-mode, through the modification of cryogenic pump efficiency.
The paper is organized as follows. In section 2 a brief description of the devices and diagnostics used will be presented. Afterwards the results obtained in two different current scans, respectively at constant toroidal field and at constant q95, will be described in section 3, providing information on both the target and upstream profile evolution and linking them to the properties of the turbulent filaments in the SOL. In section 4 we will report on the experimental investigation carried out on AUG concerning the role of neutrals in establishing the density shoulder in the H-mode extending the preliminary results reported in [15] at higher heating power and neutral pressure. Finally, in section 5 we will draw conclusions and make an attempt towards providing a possible unified picture.
2. Machine and diagnostic description
2.1. ASDEX Upgrade
AUG is a medium-sized divertor tokamak with major and minor radii of R = 1.65 m and a = 0.5 m, respectively, and equipped with a fully tungsten-coated wall [18]. The experimental investigation was carried out in the lower single null configuration, with the ion  drift pointing towards the X-point. The plasma shape was tailored to follow the shape of the outer limiter (in a configuration dubbed the edge optimized configuration), and at the midplane up to 45 mm from the separatrix the field lines are connected to the divertor target. In figure 1(a) the layout of the principal diagnostics used for the present analysis is shown in the poloidal cross-section. The SOL density profiles are obtained from the lithium beam (LiB) diagnostic, observing the plasma at a vertical position approximately 30 cm above the midplane. Density profiles are obtained from the light emission profile, which is sampled with 200 kHz [19], and evaluated within the probabilistic Bayesian framework [20] with 1 kHz in the radial region spanning approximately
  ,
,  being the normalized poloidal flux. In the core and at the edge, line densities are obtained with the standard interferometer system shown in figure 1 as well. The principal diagnostic used for investigating the fluctuations is the midplane manipulator (MEM) equipped with a tungsten-coated carbon probe head designed to characterize turbulence and simultaneously withstand the high heat flux observed in H-mode. The probe features 16 pins distributed between three terraces at different radial positions (radial separation is 4 mm), whereas the different arrays are aligned in the bi-normal direction as described in [21] with typical distances of 6 mm. The pins are arranged to measure both the floating potential and ion saturation current. In particular the ion saturation current pins are distributed in order to have the measurements spaced both in the radial and in the poloidal direction, allowing a proper estimate of the radial and bi-normal velocities using the 2D cross-correlation algorithm described in the appendix of [21]. Several plunges can be done within a single pulse. For the L-mode shots presented hereafter, up to five plunges were performed with the probe sitting in a fixed position for up to 130 ms. For H-mode operation the time duration of the fixed position was reduced to 70 ms to limit the heat load deposition on the probe head. The acquisition sampling rate for all the shots was set to 2 MHz, which gives us a relatively long time series for turbulence analysis. In addition, one pin is run in swept mode in order to infer the local estimate of density and electron temperature. The information on divertor conditions is primarily obtained by two arrays of fixed flush mounted triple Langmuir probes, shown in figure 1 by red circles, sampled at low sampling rate (33 kHz).
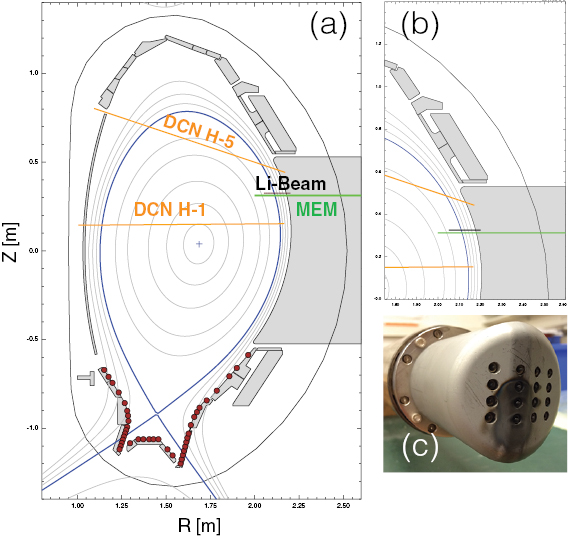
Figure 1. Experimental layout in AUG. (a) The poloidal section of a typical L-mode discharge performed in the so-called EOC shape. The separatrix is indicated by a blue line, and the positions of the principal diagnostics are also indicated. In particular, the position of the Li-beam (black line), the midplane manipulator (green line), the edge and core interferometer chords (orange lines) and the Langmuir probe measurements are shown. (b) A zoom of the field line close to the location of the measurements, (c) a photo of the probe head used as seen from the plasma.
Download figure:
Standard image High-resolution image2.2. TCV
The Tokamak à configuration variable (TCV) is a medium-sized tokamak located at the Swiss Plasma Center, Switzerland [22]. It is a conventional aspect ratio tokamak (major and minor radii R = 0.88 m and a = 0.25 m, respectively) with a highly elongated vacuum vessel and a completely open divertor. TCV features 16 independently powered poloidal field coils, resulting in unique shaping capabilities, with the ability to accommodate highly elongated plasmas (up to 2.8) and triangularity in the range  . The near-complete coverage of TCV surfaces with graphite tiles allows extreme flexibility in the power load deposition, making TCV an ideal test-bed for the study of different magnetic configurations and divertor geometries.
In recent years great effort has been devoted to increasing the amount of diagnostic equipment in TCV for divertor studies. A new 32-chord divertor spectroscopy system [23] has been installed for extracting information on recombination and electron temperature from the balmer series spectra. This information can be combined with radiation measurements estimated from bolometry [24]. An array of wall-mounted Langmuir probes (LPs) [25] covers the inner and outer wall as well as the floor. The cylindrical tips have diameters of 4 mm and are embedded into the tiles, except at the floor where they have a dome-shaped head protruding from the tile shadow by 1 mm. For the present experiment the probes have been operated in swept mode to obtain the density and temperature profiles at the wall. The set of LPs has been extended by the installation of a fast reciprocating probe (RCP) [26]. The probe head, described in detail elsewhere [27], is equipped with ten graphite electrodes 1.5 mm in diameter. The electrodes are arranged in such a way to provide a double probe for the density and temperature profiles, two Mach probes for parallel flow investigations, a pin for fast ion saturation current measurements, with the remaining probes collecting the floating potential in order to infer radial and poloidal electric field fluctuations from the local floating potential gradient. The radial separation between the floating potential pins is 1.57 mm, whereas the poloidal separation between the pins is 4 mm and 10 mm respectively. The fast movement of the probe head is 20 cm which is reached within 90 ms with a maximum speed of 2.2 m s−1. The ion saturation current and floating potential electronics have a bandwidth from 0.1 to 10 MHz with anti-aliasing filters at the Nyquist frequency. The acquisition frequency was set between 1–5 MHz for the different discharges used throughout the paper. The profiles in the SOL were obtained combining the data from RCP with that from the Thomson scattering diagnostic obtained in adjacent time instants. For TCV the profiles shown throughout the paper have been fitted using a Gaussian process regression technique (details can be found in [28] together with the link to the available software tool). The method allows for a proper determination of the fit and corresponding errors, as well as of the density gradient with the corresponding errors. This will be used throughout the paper to compute the e-folding length profile shown in the following figures. The line of sight (LOS) of bolometry, the location of the Langmuir probes and of the reciprocating manipulator used throughout the paper, and the LOS of the vertical far infrared interferometer for the edge and central chord, are shown in figure 2 to provide an idea of the spatial resolution of the diagnostic setup. The combined information provides a comprehensive set of measurements suited for the divertor investigation.

Figure 2. (a) The poloidal cross-section of the TCV tokamak with a typical equilibrium from one of the shots used in the present paper. The LoS of the bolometry (reddish) and the far infrared interferometer (orange) are shown as well as the location of the embedded Langmuir probes (blue) and the position of the midplane fast reciprocating manipulator (green). (b) A zoom of the edge and SOL region around the midplane. (c) A scheme of the fast reciprocating probe used.
Download figure:
Standard image High-resolution image3. L-mode current scan
The dependence of the SOL density profile on the plasma current in L-mode has been previously reported [2, 5, 6, 8] both for closed and open diverted devices. In all cases it has been shown that flatter profiles in the SOL develop at lower densities for lower currents. Following this premise the first set of experiments was conceived to disentangle the role played by plasma current variation from the changes in parallel connection length, consisting of two series of L-mode density ramps, up to disruption, at different current levels keeping respectively the toroidal field or the q95 constant.
3.1. Divertor target evolution
Figure 3 reports the main plasma parameters concerning the current scan at a constant toroidal field both for AUG and TCV. Three levels of plasma current for the two devices as well as the edge line integrated density and the fuelling levels used for the discharges are shown. The parallel connection lengths  , shown in figures 3(a) and (g), are the connection lengths from the outer target up to the X-point height, and clearly increase with decreasing current for both devices. The TCV discharges are purely ohmic plasmas, whereas in AUG an additional 0.5 MW of neutral beam injection (NBI) heating was added in order to keep a similar heating power through the separatrix during the scans. Still in figures 3(e) and (m), the power crossing the separatrix, estimated as
  , is reported for the various current levels for both devices. Clearly the additional heating allows us to keep much more comparable power levels for AUG. The divertor pressure on TCV, as seen from figure 3(n) measured by baratrons, does not exhibit differences between the various current levels. In AUG, where fast gauges located closer to the vessels are used, slightly higher pressure is achieved at a higher current (see figure 3(f)) [21].
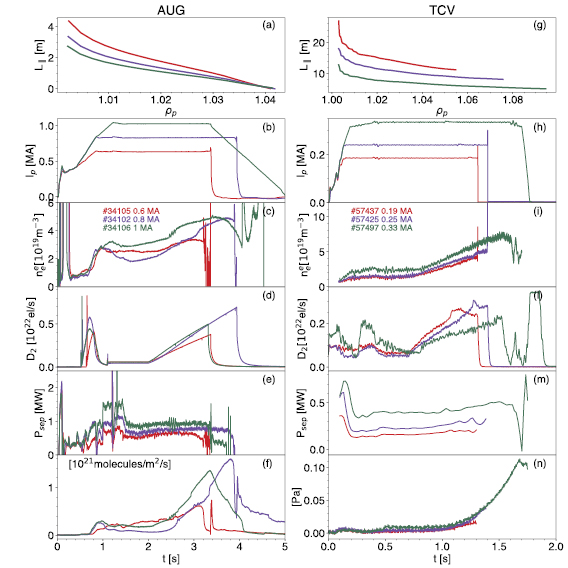
Figure 3. Discharge parameters for AUG (left columns) and TCV (right columns) for current scan analysis performed at constant Bt. From top to bottom: (a), (g) parallel connection length  from the target to the X-point heights for three discharges at different current levels but the same toroidal field. The toroidal plasma current (b), (h), the edge line average density (c), (i), the total deuterium fuelling (d), (l), the power crossing the separatrix (e), (m), and the divertor pressure (f ), (n).
Download figure:
Standard image High-resolution imageThe first relevant information can be derived by considering the response of the divertor to different density levels at different current. In figure 4 the total integrated ion fluxes to the outer divertor are shown as a function of edge density and the edge Greenwald fraction (i.e. the edge density, obtained from interferometric edge chord, normalized to the Greenwald density value  ) for AUG (a) and (b) and TCV (e) and (f ), respectively. The choice of normalization (edge density normalized to the Greenwald density) is done in order to consider possible effects due to the different density peaking obtained at a different edge safety factor [29]. As already observed, the integrated ion flux in TCV increases almost linearly with the density up to a threshold followed by a smooth rollover [30], the latter is assumed in the following as a proxy for plasma detachment. Unlike in AUG the increase of ion flux is faster than linear up to the threshold with a more pronounced rollover. These differences are likely due to the different degree of divertor closure [31]. In both devices we clearly see that ion flux rollover occurs early in the edge density at lower current. In AUG, where the power crossing the separatrix is a factor of two higher, the behaviour at different currents is reconciled in terms of the edge Greenwald fraction. The same observation holds for the two lower currents in TCV, whereas a higher edge Greenwald fraction is needed for the higher plasma current. In the scan shown in figure 3, where the density increase was kept similar at different values of current, indeed no detachment of the outer leg has been achieved for the higher current case. Conversely whenever the density is increased even further, as in the case of shot # 52065, reported as well in figures 4(e) and (f), clear outer leg detachment has been obtained even at a higher density. In the same figure 4 the behaviour of the inner divertor legs for both devices is shown. In AUG the integrated ion flux is much lower even though the behaviour in terms of edge density resembles what is observed in the outer divertor. In TCV the integrated ion flux to the inner divertor is larger and exhibits a less pronounced rollover at the lower current levels explored, whereas no sign of rollover is observed at a higher current. It is worth noting that unlike AUG, the inner target generally detaches later than the outer one in TCV [30, 32], and this has been observed in K-STAR as well [33]. It is worth noting that both K-STAR and TCV are carbon machines, with the inner strike point on a vertical target and a short poloidal distance to the X-point and an outer strike point on an horizontal plate with a much longer poloidal distance from the X-point. In both machines the presence of carbon impurities was able to increase the pressure and power dissipation with respect to the pure D case. In particular, carbon radiation is a strong power loss channel, but an additional indirect effect in the pressure balance may happen: the carbon-induced cooling and consequent reduction of the electron temperature can indirectly increase the momentum loss and increase the volumetric reaction rates, which are responsible themselves for momentum loss. Work is in progress within a 2D fluid SOL modelling effort for TCV to properly account for these contributions in similar plasmas [34]. In any case a close comparison of the detachment operational space between the two devices is beyond the scope of the present paper and will be eventually addressed in further investigations.
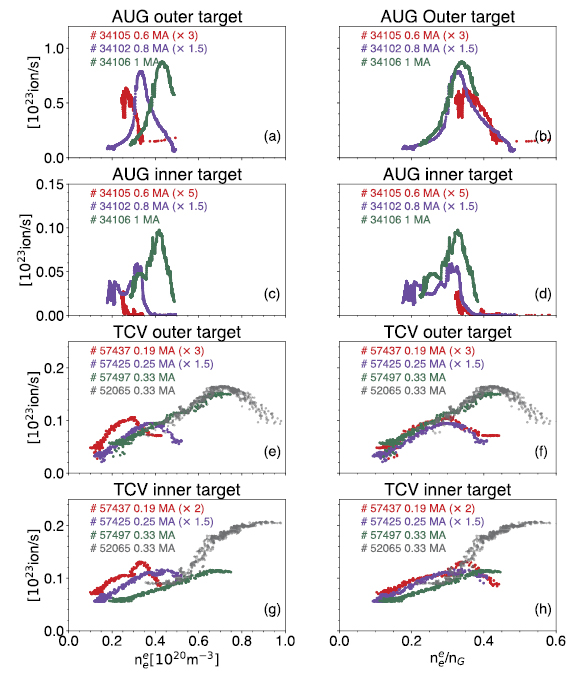
Figure 4. Outer target profiles as a function of edge density (a) and the edge density normalized to the Greenwald fraction (b) for AUG. The inner target profiles as a function of edge density (c) and the edge density normalized to the Greenwald fraction (d) for AUG. The outer target profiles as a function of edge density (e) and the edge density normalized to the Greenwald fraction (f ) for TCV. The inner target profiles as a function of edge density (g) and the edge density normalized to the Greenwald fraction (h) for TCV. All the data refer to the scan at a constant toroidal field.
Download figure:
Standard image High-resolution imageA similar current scan has been performed varying the toroidal field together with the current in order to keep q95 constant. The corresponding main plasma parameters are shown in figure 5 for both devices. From (a) and (g) we noticed that  was kept constant throughout the current scan, even though slight variations are observed in TCV at the lower current level. For the sake of completeness we need to underline that at the lower current level we had to operate TCV at an unusually low toroidal field (
 T). The time evolution of the aforementioned
  and of the divertor neutral pressure are shown in figure 5 for both devices. Again, the heating scheme used (pure ohmic discharges for TCV and an additional 0.5 MW of NBI heating in AUG) allows us to keep the
  approximately constant in AUG. The pressure in the divertor is constant throughout the scan in TCV whereas a slightly higher pressure is achieved at a higher current in AUG. The evolution of total ion flux at the outer and inner divertor as a function of edge density and edge Greenwald fraction are shown in figure 6. For AUG, in analogy to the observations obtained during the scan at constant toroidal field, the ion flux rollover is observed at lower density for lower current but the behaviour is reconciled in terms of the edge Greenwald fraction for both the inner and outer divertor. On the other hand, the comparison of shots at a similar current but different toroidal field (e.g. # 34104 and 34106) reveals that the rollover density threshold is essentially unmodified by the variation of
  , but a more robust and faster reduction of ion flux just after the rollover is obtained at larger
  . In TCV, instead no sign of detachment was observed either at the inner or at the outer divertor, even though the achieved density was sufficient to guarantee plasma detachment whenever the same density ramp was run at a higher toroidal field (compare figure 6(e) with figure 4(e)). This is an interesting observation which does not seem to be due to a change in the power crossing the separatrix since the values of
  at the same current are comparable at least around the time where higher field discharge exhibits ion flux rollover, as can be inferred by comparing figures 3 and 5. Understanding the differences at lower toroidal fields is presently under investigation.
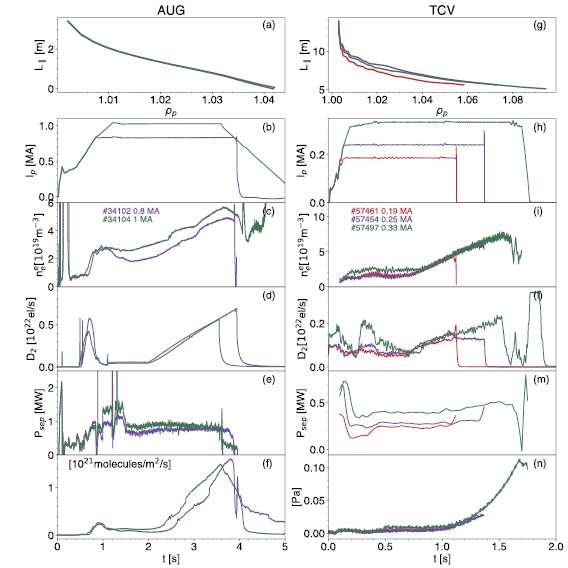
Figure 5. Discharge parameters for AUG (left columns) and TCV (right columns) for current scan analysis performed at constant q95. From top to bottom: (a), (g) parallel connection length  from target to X-point heights for three discharges at different current levels but the same toroidal field. The toroidal plasma current (b), (h), the edge line average density (c), (i), the total deuterium fuelling (d), (l), the power crossing the separatrix (e), (m), the divertor pressure (f ), (n).
Download figure:
Standard image High-resolution image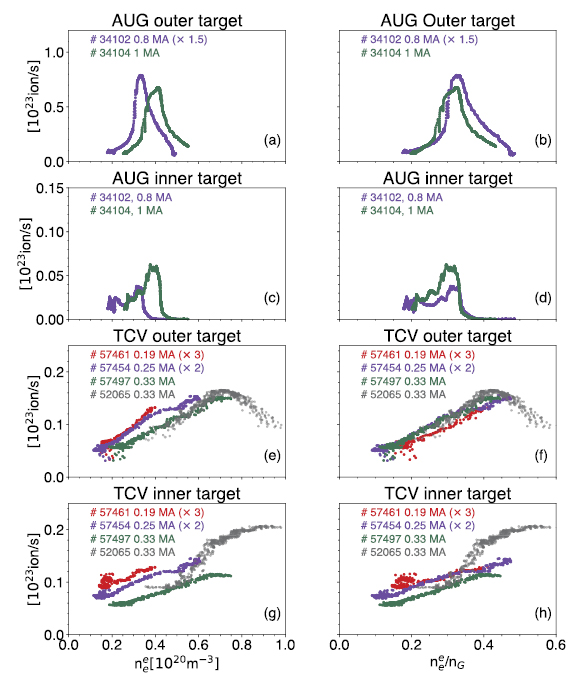
Figure 6. Outer target profiles as a function of edge density (a) and edge density normalized to the Greenwald fraction (b) for AUG. Inner target profiles as a function of edge density (c) and edge density normalized to the Greenwald fraction (d) for AUG. Outer target profiles as a function of edge density (e) and edge density normalized to the Greenwald fraction (f ) for TCV. Inner target profiles as a function of edge density (g) and edge density normalized to the Greenwald fraction (h) for TCV. All the data refer to the scan at constant q95.
Download figure:
Standard image High-resolution image3.2. Upstream profile evolution
Figures 7(i) and (ii) report on the evolution of the upstream profiles for different current levels at the same value of edge density and toroidal field for AUG and TCV respectively. In the same figures we have also included the density profiles at the outer target ((c) and (d) in figures 7(i) and (ii)) as well as the profiles of the normalized collisionality  defined as:

Figure 7. (a), (b) Upstream density profiles, normalized to the values at the separatrix for three different currents (colour code) with the same Bt at the same level of edge density. For TCV both the raw data and the Gaussian process regression fits are shown. (c), (d) The outer target density profiles as a function of the normalized poloidal flux  . The large circles and corresponding error bars are the results of a binning procedure on the raw data. (e), (f ) Divertor collisionality as a function of
  . The
. The  profile errors are obtained propagating the errors in density and temperature. Subfigure (i) refers to AUG whereas subfigure (ii) refers to TCV.
Download figure:
Standard image High-resolution imageThis quantity represents an effective collisionality, or equivalently the ratio between the parallel transit time divided by the inverse of the electron–ion collision frequency. This was originally introduced in [35] and adopted in [7] as a parameter to identify enhanced filamentary transport transition in high-density regimes. In particular in [7] it has been suggested that filamentary transport enhancement is regulated by the effective collisionality in the divertor,  , which depends on the parallel connection length, evaluated as the length from the X-point height to the outer target, and on the values of density and temperature in the divertor region, estimated in the present paper from the target density and temperature given by Langmuir probes at the outer target. In the following, all data will be presented as a function of the divertor collisionality
  . The error bars on
  shown throughout the paper have been estimated propagating the errors on the target density and temperature. It can be easily observed that flatter profiles are obtained at a lower current for the same density levels for both devices even though some differences may be noted. In AUG the different upstream profiles are associated with different target density profiles and clearly different divertor collisionality. All the cases where the profiles in AUG are flatter at the outer midplane are associated with higher values of divertor collisionality. In contrast, the outer divertor collisionality does not represent a proper metric for TCV since very different upstream profiles are obtained with comparable
  profiles, even well above the threshold of
  identified in [7] for increased filamentary transport regimes. This confirms previous observations [9] where a variation of divertor collisionality obtained through the modification of target flux expansion shows little impact on the evolution of upstream profiles. On the other hand we have already observed that, apart from the TCV case at higher current, the edge Greenwald fraction can reconcile the target profile evolution. Figures 8(i) and (ii) compare again the upstream and target profiles, as well as divertor collisionality at a comparable edge Greenwald fraction, but different current levels for both the devices. We clearly recognize that the upstream profile evolution behaviour at a different current is better reconciled in terms of the edge Greenwald fraction, with a similar shoulder developed at comparable
  nG.
nG.
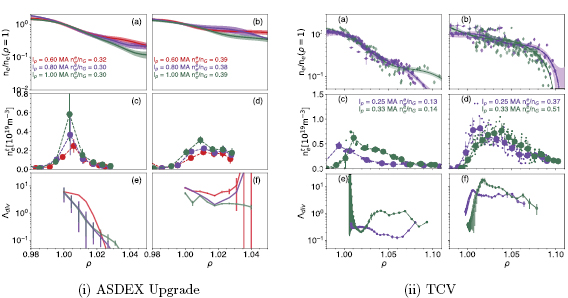
Figure 8. (a), (b) Upstream density profiles, normalized to the values at the separatrix for different currents (colour code) with the same Bt at the same level of edge Greenwald fraction. For TCV both the raw data and the Gaussian process regression fits are shown. (c), (d) The outer target density profiles as a function of the normalized poloidal flux  . The large circles and corresponding error bars are the results of a binning procedure on the raw data. (e), (f ) The divertor collisionality as a function of
  . The
. The  profile errors are obtained propagating the errors in density and temperature. Subfigure (i) refers to AUG whereas subfigure (ii) refers to TCV.
Download figure:
Standard image High-resolution imageThe investigation of the target evolution with the edge density in the current scan performed at constant q95, shown in figure 6, has already revealed differences between AUG and TCV, in particular showing that a reduction of the toroidal field prevents the plasma from reaching a detached condition in TCV at a lower current. This also reflects the different upstream behaviour, as shown in figures 9(i) and (ii) respectively for AUG and TCV. Indeed while for AUG the behaviour at constant q95 reflects what was observed at a constant toroidal field, with a substantial overlap of target and upstream profiles at equivalent values of edge Greenwald fraction, the behaviour of TCV is scattered and a clear shoulder only develops at high current, where the broader target profile is also recognized. We can also confirm that the evolution of the upstream profile is independent of the evolution of  as computed at the outer divertor. Investigation is in progress in TCV in order to eventually understand the dependence of shoulder formation on the divertor collisionality computed at the inner divertor,
  . Indeed, the inner divertor, with its shorter connection length
  with respect to that of the outer divertor, was able to exhibit a greatly different value of
  , with lower values at similar edge densities.
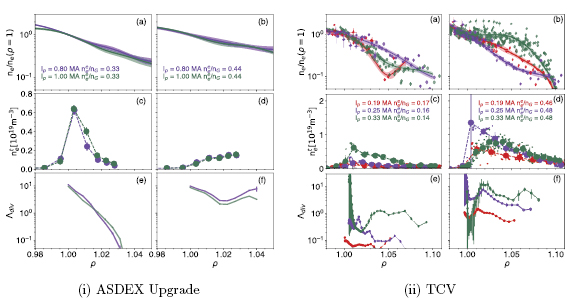
Figure 9. (a), (b) Upstream density profiles, normalized to the values at the separatrix for different current levels (colour code) with the same q95 at the same level of the edge Greenwald fraction. For TCV both the raw data and the Gaussian process regression fit are shown. (c), (d) The outer target density profiles as a function of the normalized poloidal flux  . The large circles and corresponding error bar are the results of a binning procedure on the raw data. (e), (f ) Divertor collisionality as a function of
  . The
. The  profile errors are obtained propagating the errors in density and temperature. Subfigure (i) refers to AUG whereas subfigure (ii) refers to TCV.
Download figure:
Standard image High-resolution imageIn order to properly understand the relation between the upstream and downstream condition we have monitored the evolution of the upstream profile with respect to the detachment condition. This can be done within a single shot in AUG, due to the availability of time-resolved SOL density profiles through LiB, whereas for TCV we had to rely on the repetition of similar shots, namely the 330 kA L-mode plasma with the same density ramp, where the reciprocating probe head has been plunged at different times. The result of this analysis is shown in figure 10 where upstream profiles, normalized to the value at the separatrix are shown for different levels of detachment. The obtained profiles suggest that the modification of the upstream profiles for both of the devices begins close to the ion rollover and further develops as soon as the ion-flux starts decreasing. For completeness it should be pointed out that the chosen scenario for shot repetition in TCV at 330 kA is the one which requires a higher edge Greenwald fraction to exhibit ion-flux rollover. A more refined and detailed analysis of the relation between the ion-flux rollover and upstream profile modification in TCV, including cases where detachment is achieved by pure N2 seeding, will be addressed in a forthcoming paper [36]. As far as TCV is concerned, from the present dataset we can confirm that if detachment is achieved by pure fuelling and intrinsic impurity radiation, the upstream profile variation is only observed close to and after ion-flux rollover.
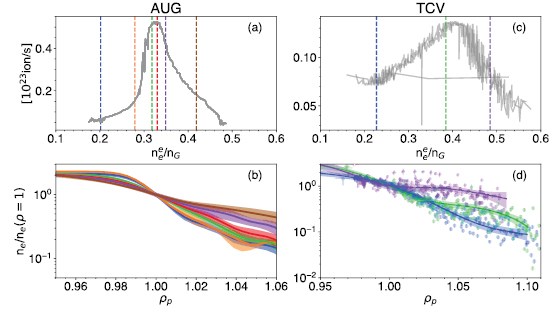
Figure 10. (a) The total integrated ion-flux at the outer target as a function of edge density normalized to the Greenwald density for AUG. (b) The SOL density profile normalized to the density at the separatrix for AUG. The colours refer to the values of density marked in panel (a). (c) The total integrated ion-flux to the outer target in TCV as a function of the edge density normalized to the Greenwald fraction. (d) Upstream profiles normalized to the density at the separatrix. The lines indicate the result of a GPR fit whereas the points indicate the actual data. The colour code refers to the vertical lines indicated in panel (c).
Download figure:
Standard image High-resolution image3.3. Influence of neutrals on shoulder formation
Even though the increase of filamentary convective transport has been recognized since the beginning [4] to play a fundamental role in the process of shoulder formation, the role of other mechanisms is presently under consideration. Among them, the influence of neutrals in the divertor region, which has been theoretically proposed [37] and experimentally suggested in [38], is the subject of intense study. On the other hand, the role of neutrals in the main chamber, which can modify the ionization rate in the outer midplane (OMP), has also been proposed as a possible candidate in the process of shoulder formation [15], even though it is still being debated [8].
This motivated activity to determine the emission of neutral deuterium in the divertor region in AUG, based on the evaluation of signals collected by two cameras with two different filters for  (656 nm) and
  (434 nm) lines, respectively. The two absolutely calibrated cameras [39] are both located just below the midplane (Z = −0.27) at slightly different toroidal angles (the centre of the two cameras is shifted by 6 toroidal degrees and they both observe the same divertor region). A tomographic algorithm has been developed in order to infer the 2D map of the emissivity
  . Assuming toroidal symmetry, the emission is a function of the radial and vertical positions only, i.e.
  . This allows us to to project each line of sight (LoS) corresponding to each camera pixel in the plane
  [40]. In this plane the different LoSs intersect each other, allowing for the development of a proper tomographic reconstruction. In order to introduce as few a priori constraints as possible, the pixel method is used, and the inversion is performed with an iterative algorithm. Two assumptions are made:
  and
and  emissions do not depend on the toroidal angle, and they are restricted to the region outside the separatrix. Thus the divertor region outside the separatrix is divided into rectangular pixels and the emissivity
  in each pixel is considered constant. Using this method, the link between the intensity measured by each LoS of the camera and the emissivity is a linear system of equations, that can be written as

where Ij is the line-integrated signal measured by the LoS j ;  is the unknown emissivity of the pixel i; and the matrix element aij is the length of the LoS j inside the pixel i. This matrix is evaluated only once, and it depends on the geometry of the LoS and the pixel division. In equation (2) there are
  LoSs and
  pixels, so the system is overdetermined. To invert it and obtain the emissivity of each pixel, the simultaneous algebraic reconstruction technique is used [41, 42]. This is an iterative technique which solves the linear system of equation (2) via an iterative error-correcting procedure, which can be written as
where  is the emissivity of pixel i after k iterations. The initial estimate
  is set to 0. Since the emissivity of each pixel is positive, this constraint is enforced in each iteration by setting to zero the coefficients that are less than zero after an iteration step. The convergence is quite rapid, and after about 20 iterations it is reached.
The results of this analysis are shown in figure 11 where the inversions for both  and
and  are shown at three different values of the edge-normalized Greenwald density. At the beginning, emission is strongly localized in the inner divertor, consistent with the presence of a high field side high-density region [43, 44]. During the fuelling ramp the divertor moves into a high recycling regime and
  and
and  radiation move towards the low field side (LFS) region, initially in the private flux region and then in the main SOL, moving upstream once the target density rolls over. This strongly resembles the observation in JET in the horizontal target [38]. In this configuration indeed the JET upstream profile develops a clear shoulder whenever fuelling is raised, and this is accompanied by a clear
  radiation front moving into the main LFS SOL. On the other hand whenever it is run in the vertical target configuration no shoulder is observed in JET at the same level of fuelling, and
  radiation was confined to a narrow region along the divertor leg. This observation seems to reconcile the behaviour of JET and ASDEX Upgrade despite the different divertor configurations.

Figure 11. Top panel: integrated ion-flux at the outer target as a function of the normalized Greenwald edge density. Middle row: tomographic inversion of  radiation at three different values of
  /nG. Bottom row: tomographic inversion of
  radiation at three different values of
  /nG.
/nG.
Download figure:
Standard image High-resolution imageEffort is ongoing to use the 2D map of the emissivity of the two Balmer lines in the divertor to infer the neutral density [45].
3.4. Filamentary studies
The role of enhanced convective filamentary transport in the formation of the SOL density shoulder has already been suggested [3, 4, 7, 9], even though reduced parallel losses can also influence the process. The relation between the profile evolution and blob sizes has been investigated in the present scan using properly designed probes. In both the devices the blob size is determined as  with
with  estimated as the FWHM of the conditionally averaged ion saturation current signal, where peaks 2.5 standard deviation
  higher than the average values have been detected. Due to the different experimental setup of the probe head, the estimate of the perpendicular velocity is done differently in the two devices. For TCV we have used the method extensively described in [27] and the perpendicular velocity is estimated as
  .
.  has been estimated from the conditionally averaged sample (CAS)
  using as a condition the detection of the peaks on the ion saturation current. The fluctuating electric field is computed from the local floating potential gradients. The poloidal velocity component is estimated from the 2D cross-correlation of poloidally and radially spaced floating potential measurements as detailed in [27]. For AUG the estimate of
  is done following the method described in the appendix of [21], based on the 2D cross-correlation using a conditionally sampled ion saturation current structure measured by pins spaced both in the radial and poloidal direction. For a better comparison with previous results we underline that
  is estimated differently with respect to [27], since in the present manuscript the asymmetric shape of the ion saturation current CAS is kept, thus considering the trailing wake neglected in the aforementioned paper [27]. Furthermore in previous AUG papers [7, 15, 21]
  was approximated by the auto-correlation time, and all the data shown were actually the blob diameter, rather than the blob radii, which will be shown in the present paper. In AUG the filaments are detected during the fixed positions of the probe. This implies a long signal length (up to 130 ms at 2 MHz for the L-mode cases) where several hundreds of filaments are detected and used to infer the CAS waveforms. In TCV conversely the probe is continuously moving: the peaks on
  exceeding the chosen threshold are sampled from a 3 ms window, as done in [27, 46], after removing the slow time evolution caused by the motion of the reciprocating probe. Several windows are sampled for each plunge at different radial insertions of the probe. Typical examples of the results obtained from the CAS technique for the two devices are shown in figure 12. The yellow bar indicates the estimate of the FWHM: for TCV we have also shown the typical waveform of the poloidal electric field fluctuations from the CAS. The data presented refers to a shot at low density: the shape of the ion saturation current, presented in units normalized to the rms value
  , is asymmetric for both devices, as already seen [6, 47–49], even though the total pulse length is different between the two machines. The pattern observed for AUG on the pins displaced in the radial and poloidal directions clearly recognizes the intermittent structure whereas from the time-delay a proper determination of the movement in the two directions can be inferred. The observed fluctuation of the poloidal electric field for TCV is of the order of 1.5–1.8 kV m−1 giving a radial velocity of the order of 1.5 km s−1 in agreement with the previous estimate [27].

Figure 12. The CAS results as obtained in low-density discharges in AUG (left columns) and TCV (right columns). The condition is the detection of peaks in the ion saturation current exceeding by 2.5 times the value of the standard deviation above the mean value. The upper panels show the ion saturation current typical waveform normalized to the standard deviation. The yellow bar indicates an estimate of the FWHM. For AUG the lower panel shows the corresponding conditionally sampled waveform on the ion saturation current displaced in the radial  and in the poloidal
  direction, used in the 2D cross-correlation analysis for the estimate of the binormal velocity. They are both normalized to the respective standard deviation
  . For TCV the waveform on the poloidal electric field fluctuation is associated with the ion saturation blob. It is worth remembering that in TCV the radial velocity fluctuations are estimated from the local poloidal electric field fluctuations as explained in the text.
Download figure:
Standard image High-resolution imageAs mentioned, the recent results ascribe the broadening of the SOL density profile to a transition in the filamentary regime from a connected regime to a disconnected or inertial one [7, 15, 50]. A threshold has been identified with the transition to inertial regimes occurring for  . The experimental results supporting this hypothesis have clearly been obtained in AUG and in JET, though for the latter device only when run in horizontal target configuration [7, 38]. However, the dependence on divertor collisionality is not universally recognized: for example
  fails to describe the operation of JET in the vertical target configuration [38] as well as in TCV, where very similar profiles are obtained with largely different outer target
  values, even though, as mentioned, the evaluation of the influence of the inner divertor
  influence is still under investigation.
In this respect we have investigated the evolution of the e-folding length of the SOL density profile, defined as  as a function of the previously defined divertor collisionality
  and as a function of the blob size
  . As previously mentioned, the e-folding length is not computed from the local exponential fit of the profiles, but rather by estimating the local density gradient as a result of the fitting procedure which provides an estimate of the error on the gradient as well, and is used then to propagate the error on the e-folding length estimate. The e-folding length is computed at the same radial location as the estimate of the blob size, namely for
  in AUG and
  in TCV. Blob dimensions are normalized to the local ion–sound gyroradius
  where the assumption Ti = Te has been assumed for TCV. In AUG instead, where detailed investigation of the behaviour of ion temperature in the SOL at different levels of density has been performed [10], we have assumed Ti = 3Te for
  and Ti = Te for larger collisionality. In order to get rid of possible uncertainties due to the scattered points, in TCV we have used the evaluation of the profile from the Gaussian-process regression fit shown in the previous figures (see figures 7–9), which also provides an evaluation of the error on the radial derivative of the fit. The results of this analysis are shown in figure 13 respectively. The original trend observed in AUG [7] is confirmed in both series of discharges with a clear increase of the e-folding length as soon as
  increases and
  strongly depending on the blob size. It is worth noting that within the different current levels no distinction is clearly observed. This is in agreement with the observation obtained from LiB diagnostics reported in [51], where no sensible dependence of blob size on the toroidal field strength was observed either scaling at constant Ip or constant q95. The corresponding blob values for the comparable Greenwald fraction are compatible with the observation obtained using LiB in AUG [51] or GPI [52]. In TCV, limited to the dataset with the same toroidal field, the e-folding length increases with blob size (see figure 13(g)), whereas we confirm that no dependence is observed on the outer target
  (see figure 13(c)). On the other hand, whenever the current is scanned, keeping q95 constant in TCV, the e-folding length is constant despite the two orders of magnitude of difference in
  (see figure 13(d)), but at the same time small variations of blob size are observed (see figure 13(h)). From the observation of figure 5 we have already suggested a possible link between the upstream profile variation and detachment condition: during the scan at constant q95 no signature of detachment or ion saturation rollover was observed (as seen in figure 6), and this analysis confirms that no variations of the upstream e-folding length and a small variation of blob size are observed if no ion-flux rollover occurs.
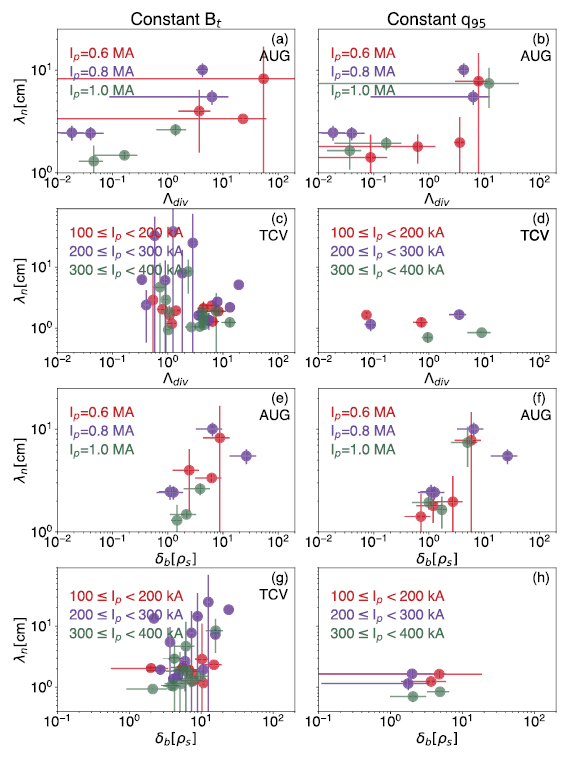
Figure 13. SOL density e-folding length  versus outer divertor collisionality
  for the scan at constant Bt (a) and at constant q95 (b) on AUG.
  versus
  for the scan at constant Bt (c) and at constant q95 (d) for TCV. SOL density e-folding length
  versus blob size
  for the scan at constant Bt (e) and at constant q95 (f ) on AUG. (c)
  versus
  for the scan at constant Bt (g) and at constant q95 (h) in TCV. Different colours refer to different currents. The errors on
  are obtained from the propagation of density and temperature errors. The errors on
  are obtained propagating the error on the gradient estimate and the density profile fit estimate. The errors on the blobs are estimated, propagating the errors on
  as well as the errors on the velocities. These have been computed considering the error on the shape of the CAS waveforms.
Download figure:
Standard image High-resolution imageIn order to check the dependence of the blob size on the divertor detachment status we consider a similar set of discharges used in figure 10 and evaluate the blob size at different edge Greenwald density fractions. The result is shown in figure 14. In AUG the number of plunges in a single shot prevents a detailed analysis close to the rollover. Nevertheless we can substantially confirm that the blob sizes are small with the plasma in the attached condition, and then the size increases close to and after the rollover. In TCV a sharp increase of blob size is observed around  with a further saturation at a larger edge Greenwald fraction. The same information can be obtained on a statistical basis considering all the databases available for both devices. For the sake of clarity we have included only the shots at the same toroidal field in TCV and for currents below 300 kA, where a clearer location of the ion-flux rollover is observed. The result is shown in figure 15(a): in AUG a sharp increase is observed around
  , which coincides—as seen in figure 4—with the transition to a high-recycling regime. For TCV we observe an increase of the blob size up to the edge Greenwald fraction
  where again ion-flux rollover at the outer target is observed for currents below 330 kA. Afterwards the blob size seems to saturate. The behaviour of the two devices is reasonably well reconciled, with an increase during the increase of the ion-flux to the outer target up to saturation after the rollover. For the sake of completeness it is worth mentioning that the smaller blobs in AUG have, as estimated, a diameter which is at the limit of our diagnostic and method capabilities. Nevertheless the observed trend, which is consistent with past results even though it was obtained with a different probe head, made us confident of the reliability of the drawn conclusions. The blob size estimates from the probes are based on the evaluation of the characteristic time
  and on the binormal velocity
  which can be projected into the radial and vertical motion. In figures 15(b)–(d), the different contributions are still shown as a function of edge density normalized to the Greenwald fraction. We clearly see that the larger variations are observed for
  , which increase with
  /nG in agreement with the results reported in [9], with the increase of the auto-correlation time observed in AUG [21] and with similar analyses based on the LiB diagnostic in AUG as well [53]. It is worth noting that these results seems to contradict observations obtained using GPI on C-Mod [48] or probe measurements still in TCV [47] where the pulse shapes of the intermittent structures were insensitive to the changes in density. So far no clear explanation of these differences has been determined. On the other hand, in the same figures we report both the radial and poloidal velocities normalized to the local ion-sound speed. For AUG a modest increase with the density is observed confirming what was shown previously using probes [21] or LiB [53]. The behaviour in TCV exhibits a different trend with an almost constant value for the poloidal component and a modest decrease, if any, at higher densities in TCV: this behaviour confirms previous observations [9]. On the other hand previous measurements of the effective radial velocity in TCV [47] show a small variation with density in the far SOL and a larger variation in the near SOL which is still compatible with present results.
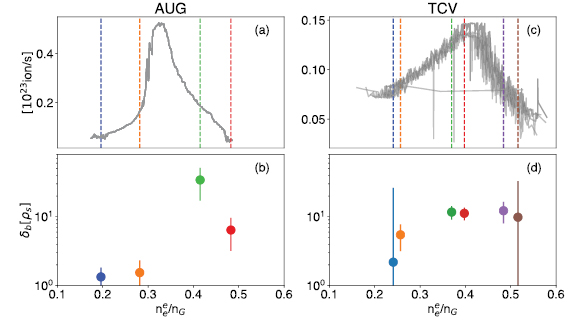
Figure 14. (a) The total integrated ion-flux at the outer target as a function of the edge density normalized to the Greenwald density for AUG. (b) The blob size as a function of edge density normalized to the Greenwald density in AUG. The colours refer to the values of density marked in (a). (c) The total integrated ion flux to the outer target in TCV as a function of edge density normalized to the Greenwald fraction. (d) The blob size as a function of edge density normalized to the Greenwald density in TCV. The error on the blobs is estimated propagating the error on  as well as the errors on the velocities. These have been computed considering the error on the shape of the CAS waveforms.
Download figure:
Standard image High-resolution image
Figure 15. (a) The blob size as a function of the edge Greenwald fraction for AUG and TCV. (b)  as a function of the edge Greenwald fraction. (c) The radial velocity normalized to the ion-sound speed as a function of the edge Greenwald fraction. (d) The poloidal velocity as a function of the edge Greenwald fraction. For TCV, in order to highlight the trend, the data have been binned in classes of ne/nG, and the corresponding box-plots are shown, with boxes representing 50% of the population, and the orange lines representing the median of the distribution of the bin. The centre of the box is positioned at the median value of the corresponding density population.
Download figure:
Standard image High-resolution imageFinally, in order to properly compare the filamentary features between the two devices we consider all the filaments detected in the  plane, where
  has already been described, the parameter
  is defined as
with an obvious meaning for the different quantities. Specifically, for both devices both  and
and  are computed considering
  as the parallel connection from the outer target up to the X-point height, whereas the ion-sound gyroradius is locally computed at the position of the filament measurements. These two invariants were originally introduced in the so-called two-region model [35]. The second invariant
  is a typical spatial blob scale. The proposed model allows the distinction of different regimes for filaments where different velocity scalings with respect to the filament size and different current closure schemes are identified. While a detailed description can be found in the original paper [35], for the present one it is sufficient to distinguish between the filaments electrically connected to the target (in the sheath-connect (Cs) or in the connected ideal interchange (Ci) regimes) on one side and those electrically disconnected as the resistive X-point (RX) or the resistive ballooning (RB) regimes on the other. These different regimes occupy different portions in the
  plane, as pointed out in [27, 35]. The evaluation of
  and
and  for all filaments detected in both devices is shown in figure 18. In the same plot we have also marked the regions for the different regimes. Actually, the boundary of the connected ideal interchange regime Ci depends on the magnetic fanning parameter
  , which is a measure of the elliptical distortion of the flux surfaces. In analogy to what was done in [27] for the plot shown in figure 16 we have chosen a value of
  . As pointed out in [27] TCV blobs have features that are mainly consistent with a RB type and a radial velocity which should scale as the square root of the blob size. For AUG the points at very low collisionality (
 ) appear to be close to a connected regime, whereas the transition to a clearly disconnected regime is achieved whenever higher collisionality is reached. Thus while in AUG different filamentary regimes seem to have been attained, in TCV in the explored collisionality region no regime variations have been observed and this could be responsible for the lack of dependence on collisionality. This could also be the reason for the lack of dependence of the e-folding length from
  , although further investigations are indeed mandatory. Presently, work is in progress to compare velocity estimates with independent measurements, such as fast camera velocimetry measurements, which will give us additional data to eventually support these considerations. Besides the determination of the filamentary regime, investigations are also under way to quantify the level of transport associated with the filaments at different levels of shoulder formation, in analogy to what was done in [15], since increased convective losses are ultimately responsible for the enhanced radial transport.

Figure 16.  versus
  for L-mode discharges in TCV and AUG. The different regimes Cs (sheath-connected), Ci (connected ideal interchange), RX (resistive X-point) and RB (resistive ballooning) are marked. In the plot we have used a magnetic fanning parameter
  . The error bars on
  are obtained propagating the errors on target density and temperature. The errors on
  are obtained from the error on the blobs which are estimated propagating the error on
  as well as the errors on the velocities. These have been computed considering the error on the shape of the CAS waveforms.
Download figure:
Standard image High-resolution imageAs already mentioned, increasing investigatory effort has been devoted to the role of neutrals in determining the SOL profile flattening at high density, both from an experimental [8] and a numerical point of view [54–57]. In this respect an attempt to distinguish the behaviour of the upstream SOL e-folding length with respect to the neutral pressure as measured at the midplane or in the divertor region in AUG has been carried out, and the results are shown in figure 19. In figures 17(a) and (b) the e-folding length, still computed around  , is shown as a function of divertor collisionality and of blob size respectively with a colour code representing the measurement of the subdivertor neutral pressure, whereas in (c) and (d) the same plot is shown with the colour code proportional to the pressure as measured by midplane gauges. The plot suggests, even though not perfectly, a general tendency to develop flatter profiles in the SOL at higher neutral pressure, with a weaker dependence on the divertor values with respect to the midplane ones. This is actually interesting, and in partial contradiction with the observation in JET [38] and MAST [8]. We will address a similar analysis in TCV as well, where more robust and reliable measurements from gauges both in the divertor region and midplane will be available in the near future. What the results up to now point out clearly is that global comprehension, which unifies the experimental observations obtained from a variety of devices, must retain the physics of interaction between plasmas as well as its fluctuations and neutrals.

Figure 17. (a)  versus
  with the colour code proportional to the divertor pressure. (b)
  versus
  with the colour code proportional to the divertor pressure. (c)
  versus
  with the colour code proportional to the midplane pressure. (d)
  versus
  with the colour code proportional to the midplane pressure. All data refer to AUG. The errors on the blobs are estimated propagating the errors on
  as well as the errors on the velocities. These have been computed considering the errors on the shape of the CAS waveforms. The errors on
  are obtained propagating the errors on the gradient estimate and the density profile fit estimate.
Download figure:
Standard image High-resolution image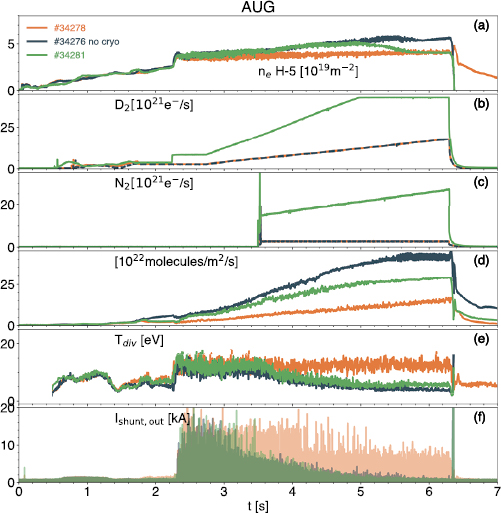
Figure 18. (a) The edge density from the H5 interferometer chord. (b) The total deuterium fuelling. (c) The total nitrogen seeding. (d) The subdivertor neutral pressure. (e) The temperature at the outer target. (f ) The shunt current at the outer target used as a proxy for ELM detection. The colours refer to three different discharges, all with the same heating power. In discharge # 34276 the cryogenic pump was not in operation.
Download figure:
Standard image High-resolution image
Figure 19. (a) Edge density versus time for shots #34276 (no cryogenic pump), #34278 and #34281. (b)–(d) Inter-ELM upstream density profiles normalized to values at the separatrix respectively for shots #34276, #34278 and #34281. The different colours refer to different time instants marked in (a). (e)–(g) Inter-ELM target density profiles for the three shots at the same time instants as the previous row. (h)–(l) Inter-ELM  profiles. Only AUG data are presented.
Download figure:
Standard image High-resolution image4. H-mode experiment
The question of whether the mechanism of SOL profile flattening also affects the profiles in H-mode is a fundamental issue, since operation at a high Greenwald fraction with the divertor in a detached condition is envisaged for future reactor-relevant plasmas. The present contribution will extend the observations already reported in [14, 15], with more detailed filamentary investigations in the H-mode plasma in AUG with a total power up to 5.8 MW and focusing on the role of divertor neutral pressure by comparing operation with and without cryogenic pumps.
The time traces of the relevant parameters are shown in figure 18 for three different discharges at 0.8 MA, Bt = −2.5 T in AUG all with the same heating power of 5.8 MW obtained through a combination of NBI and electron cyclotron resonance heating. Shots # 34276 and 34278 were operated with the same fuelling and seeding settings without and with cryogenic pumps, whereas for shot # 34281, where the cryogenic pump was operated, both fuelling and seeding were increased aiming to match the subdivertor neutral pressure (figure 20(d)). It is worth noting that the levels of fuelling and heating power attained in these shots are much higher than those reported in [15]. Comparing shots #34276 with #34278 we observe that keeping the same level of fuelling and seeding but starting the cryogenic pump prevents the plasma from detaching (indicated by the constant divertor temperature) with a modest increase in edge density. To reach similar conditions for edge density and detachment, high levels of fuelling and seeding are needed. Another clear difference between operation without and with the cryogenic pump is the edge-localized mode (ELM) behaviour, as observed by the measurements of the divertor shunt current at the outer divertor shown in figure 18(f), with shots #34276 and #34281 exhibiting a clear reduction of the ELM amplitude and a transition toward a small ELM regime at higher density, whereas a modest reduction is observed in the shot with the lower neutral divertor pressure.

Figure 20. (a)–(c) The total outer divertor integrated ion-flux versus edge density normalized to the Greenwald fraction. The vertical colour lines refer to the chosen interval for the evaluation of the upstream profiles (d)–(f ). The upstream profile normalized to the value at the separatrix for different values of the normalized edge Greenwald fraction. All data refer to AUG H-mode operation.
Download figure:
Standard image High-resolution imageIn figure 19 the upstream and target inter-ELM profiles for the same three shots are shown for three different time instants, in analogy to what was done in [15]. It is worth noting that while the determination of inter-ELM intervals is easy at the beginning of the H-mode phase of the discharge, the distinction at a later stage, with such a high ELM frequency and low amplitude, is difficult. Nevertheless even at high density a suitable threshold for the divertor shunt current has been determined in analogy to [15], even though no sensible differences were identified with respect to the average profiles determined without distinguishing ELM and inter-ELM intervals in the small ELM regime. This makes us confident that the considerations carried out can be properly compared with similar measurements presented in [58]. In all cases we start from a clearly attached plasma with a steep upstream profile and divertor collisionality, completely or at least partially below the threshold  . Both the target and upstream profiles start evolving for shots with comparable subdivertor neutral pressure (# 34276 and # 34281) moving towards high recycling and finally to fully detached conditions. Consistently, the divertor becomes fully collisional with a
  profile well above 1 in the explored radial region. Furthermore, the upstream profiles tend to flatten more robustly for the shot at the higher divertor neutral pressure. On the other hand, for shot #34278 the upstream and target profiles remain practically unchanged with the peak target density still increasing without sign of rollover. This is observed even though
  increases in the near SOL, thus confirming the stronger influence of the far SOL divertor condition in determining the upstream profiles in AUG [50]. In analogy to the investigation performed in the L-mode we now verify the evolution of upstream profiles in terms of divertor status. Figure 20 shows the evolution of integrated outer divertor ion flux as a function of the edge Greenwald normalized density for the same shots. For shot # 34276 without the cryogenic pump, a divertor evolution similar to the one observed in L-mode can be recognized, with the divertor moving from an attached condition, to high-recycling and then detachment after ion-flux rollover occurring around
  . For the same shot the upstream profiles start evolving, moving towards flatter profiles as the density is raised. Similar observations can be done for shot # 34281 where the upstream profile evolution starts whenever the outer divertor moves to the high-recycling regime, whereas for the shot with lower divertor neutral pressure the profile remains substantially unmodified without any signature of target ion-flux rollover.
The inter-ELM filament characteristics have been investigated in these shots. The determination of the inter-ELM intervals was done in analogy to [15]. The results concerning the relation with the inter-ELM density profile flattening are summarized in figure 21 where the e-folding length is shown as a function of divertor collisionality  in (a) and (c) and as a function of inter-ELM blob size in (b) and (d). The fluctuation data, as well as the corresponding
  , have been obtained at
  , further away from the separatrix with respect to the data in the L-mode. The symbol colour code is proportional to the divertor neutral pressure as measured in the subdivertor area in (a) and (b), and to the midplane neutral pressure as measured from the midplane gauges in (c) and (d). For completeness, since the local ion and electron temperature were not available for these shots at the probe location for a proper computation of
  , we have assumed that Te = 15 eV and Ti = 45 eV for
  , and that
  eV for higher collisionality in accordance with the observation reported in [10]. We are aware of the possible uncertainties caused by the lack of information on the ion temperature, but as pointed out in [10, 53], a better comparison between the experimental results and theoretical predictions is observed whenever hot ion approximation is retained. This motivates our choice in the determination of the ion sound gyroradius. From this analysis we can recognize the relation suggested in [7] with increasing
  observed when crossing
  , even though, as anticipated in [15], the transition is smoother and less clear than in the L-mode. Larger values of
  are obtained at higher neutral pressures (both divertor and midplane), consistently with the constant increase of pressure during the fuelling ramp observed in figure 18. On the other hand, from figure 21(d) we recognize that large blobs are insufficient to ensure the increase of
  , but for the same blob size flatter profiles are only obtained for higher values of neutrals at the midplane. Also, the relation between the e-folding length and blob size is weaker than in L-mode, thus supporting the idea that the paradigm of the filamentary regime transition proposed for the L-mode needs to be revised to provide a unified description of L and H-mode dynamics.
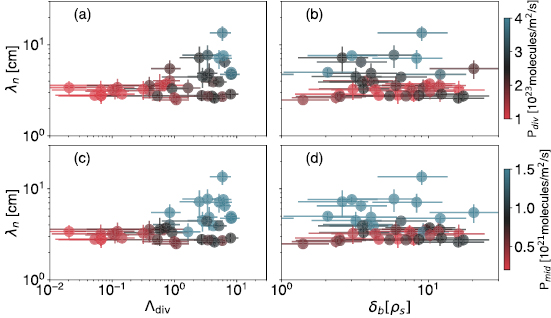
Figure 21. (a) The SOL density e-folding length  versus edge collisionality
  with the colour code proportional to the divertor pressure. (b) The e-folding length
  versus the blob size
  with the colour code proportional to the divertor pressure. (c)
  versus
  with the colour code proportional to the midplane pressure. (d)
  versus
  with the colour code proportional to the midplane pressure. All data refer to AUG H-mode operation. The errors on the blobs are estimated propagating the errors on
  as well as the errors on the velocities. These have been computed considering the errors on the shape of the CAS waveforms. The errors on
  are obtained propagating the errors on the gradient estimate and the density profile fit estimate.
Download figure:
Standard image High-resolution imageTo corroborate the measurements of the blob properties performed by the probes, we used gas-puff imaging (GPI) in the same discharges. The GPI system in AUG introduces a local density of neutrals via a piezoelectric valve at the LFS radius  and height
  [59]. In the experiments reported, a He puff was used to enhance the line emission and allow the toroidal localization of fluctuation signals, and the brightest, 587.6 nm wavelength line of helium was imaged using a Phantom v711 camera sampled at 398 kHz. Figure 22 compares results of the GPI measurements in shots #34276 and 34278 (without and with the cryogenic pump) based on a cross-correlation over 1 ms of signal with zero time lag using a reference at
  . The solid black line indicates the contour line at a 0.5 correlation value. Since the fluctuation power in the far SOL is dominated by filaments, the correlation is a good proxy for an average blob shape, i.e. filament cross-section. However, since the measurements were performed in H-modes, in the time histories used for cross-correlation care was taken to avoid ELM bursts, which overwhelm blob filaments by orders of magnitude. Both patterns show a somewhat radially elongated structure, with poloidal and radial correlation lengths, estimated as half of the FWHM value of the correlation,
  and
and  respectively.
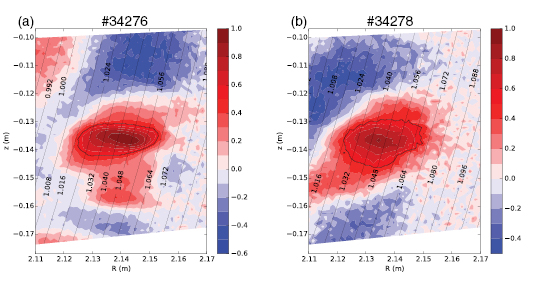
Figure 22. (a) The inter-ELM blob as measured through the cross-correlation technique for shot # 34276 in the period 4.368 s. (b) The inter-ELM blob as measured through the cross-correlation technique for shot # 34278 in the period 2.513–2.613 s. The solid back contour indicates the contour line with 0.5 correlation value. The flux surface labels are indicated as well.
Download figure:
Standard image High-resolution image
Poloidal and radial velocities are extracted from the motion of the emission features using a tracking TDE (time delay estimation) method [60], suitable for systems with a high degree of spatial resolution with relatively slow time resolution and detection speeds. Direct velocimetry results are converted to the nominal minor radius and poloidal directions using equilibrium reconstruction. At the marked far SOL location of  , the filament velocities in #34276 are
  and in # 34278
  . In the above, velocimetry errors are estimated as the larger of the fit errors in the tracking or the deviation between instances of inter-ELM activity.
Since the gas puffing and the probe plunges were not synchronized, a one-to-one comparison is not possible given the nonstationary condition of the discharge. Nevertheless, with similar conditions the probe estimates are respectively  and
and  , thus compatible with the GPI estimate. Also, the velocity estimates are consistent with a radial and poloidal velocity of
  ,
,  m s−1 for # 34276 and
  ,
,  for # 34278. Given the different location and type of measurement, this represents an excellent agreement providing confidence in the observations carried out by insertable probe measurement.
5. Conclusion
A unified effort within the EUROfusion medium-sized tokamaks (MST1) work programme has been coordinated to explore the role of filamentary transport in high-density tokamak regimes both in the L and H-mode, particularly focusing on the issue of SOL shoulder formation. Comparable current scans at a constant toroidal field or constant q95 have been performed to disentangle the role of plasma current from the modification of parallel connection length. In AUG we have proved that the shoulder formation at different current behaviour, with or without constant  , is well reconciled in terms of the edge Greenwald fraction. In TCV this is true only for the two lower current levels explored in the constant toroidal field scan. Furthermore, in analogy with JET, the upstream profile starts evolving with the transition to a high recycling regime for AUG, and is associated with an enhancement of
  radiation in the LFS SOL region, as reported in [38] for JET horizontal target plasmas. On the other hand TCV, with its completely open divertor, exhibits different divertor dynamical behaviour, with the target density increasing almost linearly with fuelling. For both devices we have proved that the evolution of the upstream profiles follows the dynamics of the divertor, with more pronounced and flatter profiles obtained after target density rollover. The lack of detachment at lower currents observed in TCV during the constant q95 scan prevents upstream variation and the development of an SOL density profile shoulder. In L-mode plasmas, the density e-folding length increases with blob size independently of the current in all scans performed in AUG, whereas the same relation—even if recognizable in the scan at constant toroidal field—is weaker and more scattered for TCV. What has been proved clearly is that the blob size for both devices increases with the edge Greenwald normalized density, and at least for AUG, larger filaments are observed at higher neutral pressure (the dependence on the midplane neutral pressure is more robust and clear as seen in figure 19(d)). The filamentary characteristics in L-mode have been considered in the framework of the two-region model, which allows the distinction between connected and disconnected regime. We have shown that for AUG the points at lower collisionality are compatible with electrically connected filaments, whereas the transition to disconnected regimes is obtained at larger collisionality. However, filaments in TCV always appear to be in disconnected regimes, confirming the previous analysis [27]. Work is in progress to understand if this difference could be at the basis of the different behaviour with respect to the divertor collisionality observed in the two devices. More detailed investigations are in any case mandatory in this case due to the uncertainty in the estimate of the local ion and electron temperature under the different conditions. H-mode density shoulders have been obtained in AUG, in discharges with high levels of both fuelling and seeding. We have demonstrated that neither large divertor collisionality nor large blobs are sufficient in themselves to guarantee shoulder formation, but that a high neutral density—in particular in the midplane region—is mandatory. The reason why this has not been confirmed in other devices [8] is presently under investigation. Work is presently in progress to extend the H-mode analysis in TCV, where high-density H-mode in detachment conditions has not yet been achieved, even with high values of inter-ELM divertor collisionality.
Acknowledgments
This work has been carried out within the framework of the EUROfusion Consortium and has received funding from the Euratom research and training programme 2014–2018 and 2019–2020 under grant agreement No. 633053. The views and opinions expressed herein do not necessarily reflect those of the European Commission. This work was supported in part by the Swiss National Science Foundation, the Austrian Academy of Sciences (KKKÖ), the Bilateral Scientific-Technical project SI 23/2018 Austria/Slovenia and the CEEPUS network AT-0063. This work was supported in part by the US Department of Energy under award No. DE-SC0010529.