

Abstract
Objective. The aim of the present study was to investigate the accuracy of localization and rotational orientation detection of a directional deep brain stimulation (DBS) electrode using a state-of-the-art magnetoencephalography (MEG) scanner. Approach. A directional DBS electrode along with its stimulator was integrated into a head phantom and placed inside the MEG sensor array. The electrode was comprised of six directional and two omnidirectional contacts. Measurements were performed while stimulating with different contacts and parameters in the phantom. Finite element modeling and fitting approach were used to compute electrode position and orientation. Main results. The electrode was localized with a mean accuracy of 2.2 mm while orientation was determined with a mean accuracy of 11∘. The limitation in detection accuracy was due to the lower measurement precision of the MEG system. Considering an ideal measurement condition, these values represent the lower bound of accuracy that can be achieved in patients. Significance. However, a future magnetic measuring system with higher precision will potentially detect location and orientation of a DBS electrode with an even greater accuracy.
Export citation and abstract BibTeX RIS
1. Introduction
Deep brain stimulation (DBS) is a surgical procedure used for the treatment of a variety of movement disorders such as Parkinson's disease, essential tremor, and dystonia [1] and is being studied for use in many other neurological conditions. Currently, more than 200 000 patients have been implanted with a DBS system worldwide. The surgery involves implanting a stimulating electrode (comprising of a linear array of stimulating contacts) into a specific target region of the patient's brain, which is connected to a battery-powered neurostimulator implanted in the chest near the collarbone. Recently, new DBS electrode designs have become available with segmented contacts (split into three segments along the circumference of the electrode) which allows steering of the electric fields in a desired direction [1–3]. First studies indicate improved therapeutic effects and lower side-effect thresholds compared to electrodes with standard ring contacts. However, the long-term clinical benefits of directional electrodes need to be investigated further. To use the full potential of this technology, correct localization and rotational orientation of the electrode in the anatomical brain structures must be determined for interpreting the observed stimulation effects and to inform and guide programming.
To date, no generally accepted protocol for electrode localization has been established. Current approaches for electrode localization are based on the fusion of pre- and postoperative neuroimaging data, e.g. postoperative computed tomography (CT) with preoperative magnetic resonance imaging (MRI). All images are affected by metal artifacts, so for low-quality images the localization errors are increased. Furthermore, significant discrepancies were reported between electrode centers estimated by CT and MRI, and differences in localization results were observed between various widely used software programs [4, 5]. Moreover, CT also exposes patients to ionizing radiations and MRI cannot always be conducted due to safety concerns. Accordingly, electroencephalography (EEG) and magnetoencephalography (MEG) provide alternative imaging modalities to detect electrode position by measuring the stimulation induced DBS artifacts. Earlier studies have already demonstrated the feasibility of electrode localization with EEG recordings, whereby a maximum error of about 15 mm was reported [6]. The feasibility and potential of MEG recordings for DBS electrode localization has not yet been investigated to the best of our knowledge.
Similar to electrode localization, no established means are presently available for non-invasively reviewing the electrode orientation. Current methods to determine electrode orientation, e.g. with x-rays, standard CT, flat-panel CT, and rotational fluoroscopy [7–9], all rely on high-quality images, since artifact patterns must be calculated from these images based on the electrode's orientation marker. Although these approaches are considered to be precise enough for high-quality images, patients are dosed with ionizing radiation in all these methods. Additionally, the feasibility of determining electrode orientation beyond mere localization by alternative imaging modalities such as EEG or MEG has not yet been investigated.
The aim of this paper is to assess a non-radiative method to determine the location and rotational orientation of a DBS electrode in a phantom using a state-of-the-art MEG scanner, which consists of a number of highly sensitive superconducting quantum interference devices (SQUIDs). These sensors, with a noise spectral density of approximately 3 fT  , are best suited to measure the magnetic fields generated by DBS. The magnetic fields produced by DBS electrodes are in the pT range, while those generated by normal brain activity are in the fT range. This is why the later has a negligible effect on the field generated by the electrode and can be ignored. First, we placed the electrode at predefined positions in the phantom, programmed the neurostimulator with electrode configuration settings specified in advance, placed the phantom within the MEG sensor array, and measured the magnetic field distribution. We then developed a precise electromagnetic finite element model to compute the magnetic fields produced at these positions with different electrode positions and orientations. A fitting approach was then used to find the model that minimized the error between simulated and measured data. The location and orientation of the electrode in the found model determined the result of position and orientation detection. In our previous works [10, 11], we have already investigated the characteristics of magnetic fields generated by a DBS electrode and have shown that an electrode can be localized with an average accuracy of less than 1 mm by measuring the magnetic field distribution around the phantom. However, we used a single fluxgate magnetometer (Fluxmaster, Stefan Mayer Instruments) for the recordings, generated a boosted DBS signal artificially over a multifunction data acquisition device (USB-6361, National Instruments), and used our in-house constructed measurement system. The fluxgate sensor had a noise level of 20 pT
  and an operating frequency bandwidth of 1 kHz.
The present work investigates the feasibility of localization and rotational orientation detection of a DBS electrode as implanted in clinical routine with a MEG scanner. This method may enable long-term studies to investigate any displacement and rotation of the electrode over time without exposing patients to radiation risk of CT or x-ray imaging. Electrode migration, i.e. an unintended postoperative displacement of the DBS electrode, on the one hand and, on the other hand, electrode rotation can be observed in clinical practice and poses a challenge [12, 13]. If the electrode continues to rotate after implantation, direct postoperative imaging may be inadequate to obtain the rotation for stimulation settings. The first clinical study [14] addressing this problem revealed large deviations from the intended implantation direction. Deviations of more than 30∘ occurred in 41% of cases and more than 60∘ in 11% of cases. Only postoperative CT imaging, which is part of the patient's routine clinical care, was used to avoid exposing the patient to radiation unnecessarily. Another clinical study indicated no change in direction within the first two weeks of implantation [15]. Here, in addition to postoperative CT imaging, only a single measurement was performed with rotational fluoroscopy due to the same reason. However, it is still of significant importance to establish whether directional electrodes continue to rotate and by how much. Our method could be carried out without hesitation in continuous intervals as often as desired without exposing patients to radiation at all.
2. Methods
2.1. Head phantom
The cylindrical head phantom used in this study is depicted in figure 1(a). It was slightly changed and adapted for this work compared to our earlier studies in [10, 11]. The cylinder body with dimensions comparable with a human head (diameter of 150 mm, height of 250 mm) is made of acrylic glass and is, therefore, neither electrically conductive nor magnetic. It was filled with an isotonic fluid (NaCl 0.9%) to mimic the electric conductivity of a human brain. We used a DBS system by Boston Scientific consisting of a current-controlled DBS neurostimulator (Vercise™ PC) and a directional electrode (Versice Cartesia™) as used in the clinical routine. The DBS system was integrated and fixed into the phantom. The DBS electrode can be moved along a circle in the xy-plane by rotating the adjustment wheel and was placed at five different positions; each with a different distance 'a' to the phantom's origin (40, 30, 20, 10, 0 mm). a = 0 mm represents the deepest position at the origin of the phantom, whereas a = 40 mm represents the position nearest to the phantom surface (phantom radius is 75 mm). The vertical position of the electrode remained fixed during these measurements. The electrode is connected to the neurostimulator via an extension wire and connector. In most previous works, the magnetic field around the DBS electrodes was severely contaminated by the presence of artifacts related to ferromagnetic extension wires. These wires were made of stainless steel and generated artifacts in the MEG signals [16–18]. We used non-ferromagnetic extension wires made of platinum-iridium to avoid such artifact [19]. Moreover, we used non-magnetic material for all other components used in the phantom. The screws on top of the electrode holder were made of titanium, while the adjustment wheel and the holders for the electrode and neurostimulator casing were made of plastic. Unintentionally, the ferrule under the titanium screw was made of ferromagnetic material and caused artifact at the corresponding sensor points. The structure of the directional DBS electrode is shown in figure 1(b). It comprised eight individually controlled platinum-iridium contacts (C1–C8), in which the two middle contact levels were segmented into three contacts each spanning 120∘ of the circumference. Any combination of these contacts can be activated to steer the stimulation current direction. The outer jacket is made of polyurethane. The dimensions of the electrode are as follows: diameter of 1.3 mm, contact length of 1.5 mm, and a vertical spacing between adjacent contacts of 0.5 mm.
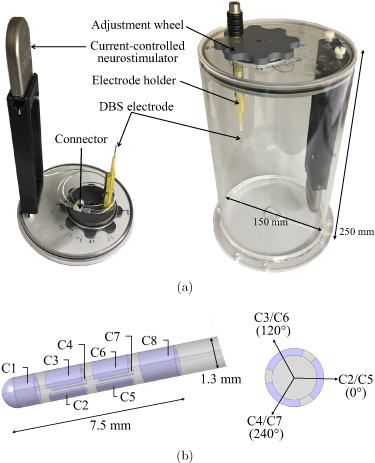
Figure 1. (a) Cylindrical phantom head with integrated current-controlled DBS neurostimulator (Vercise™ PC) and directional electrode (Vercise Cartesia™). The electrode is connected to the stimulator via the DBS connector and can be moved along a circle by rotating the adjustment wheel. (b) Modeled geometry of the directional DBS electrode. Contact C1 and C8 are full-ring contacts, and the others are contacts with equally spaced segments, each spanning 120∘ of the circumference.
Download figure:
Standard image High-resolution image2.2. MEG preparation
Before starting the actual MEG recording, several preparatory steps were performed. Four head position indicator (HPI) coils were attached to the surface of the head phantom and a round template with three landmarks (referred as nasion, right pre-auricular, and left pre-auricular) was fixed on the cylinder cap. Then, a point digitizer (Fastrak, Polhemus) was used to localize anatomical fiducial points (nasion, left and right pre-auricular) and HPI coils. Furthermore, 150 additional points around the phantom were localized to improve the accuracy of the spanned coordinate system of the phantom. Figure 2(a) shows the phantom during the digitization process; the glasses represent the reference, and one of the two receivers used for digitization. The digitized locations of the anatomical landmarks in [x, y, z] directions are as follows:
- Nasion: [0, 74.9 mm, 0]
- Right pre-auricular: [74.7 mm, 0, 0]
- Left pre-auricular: [−75.1 mm, 0, 0]
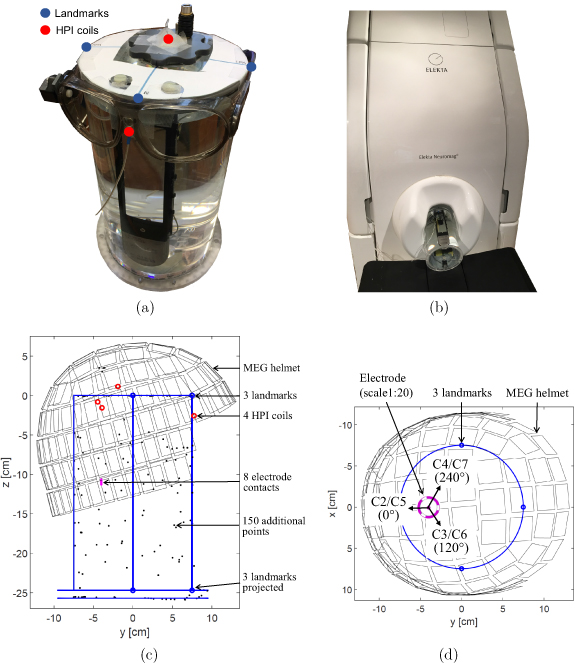
Figure 2. (a) Phantom during MEG preparation. Four head position indicator (HPI) coils are taped onto the phantom's surface to detect its position with respect to the MEG sensor array before recording (two HPI coils can be seen). Their positions, together with the anatomical fiducials (nasion, left and right pre-auricular points) and further additional points around the phantom surface are digitized by placing the tracker (located in the middle of both glasses) on the phantom's surface and by using the digitizer pen. (b) Phantom inside the MEG scanner. (c) Side view of the phantom in the MEG sensor array with all the digitized points. The blue circles represent the three anatomical landmarks, the red circles represent the four HPI coils, and the black dots show the additional points around the surface of the phantom. In addition, the position of the electrode (a = 40 mm) in the phantom is depicted as an example. (d) Top view of the phantom illustrating the orientation of each segmented electrode contact at electrode position a = 40 mm.
Download figure:
Standard image High-resolution imageThe cap of the cylindrical phantom lied exactly on the xy-plane, the longitudinal axis of the cylinder on the z-axis, and the origin of the coordinate system was in the center of the cylinder's circular cap. The radius of the cylindrical phantom was 75 mm, and the digitization process was performed with an accuracy of ±0.3 mm (given by the error of right pre-auricular). The locations of HPI coils, landmarks, additional points, and the position and orientation of the electrode were all expressed in the phantom coordinate frame. The phantom placement in the MEG scanner can be seen in figure 2(b). The MEG sensors were in the MEG coordinate system. Before each recording, MEG sensor positions were automatically determined in phantom coordinates. The relationship between MEG and phantom coordinates was determined by applying current with a particular frequency to the HPI coils and determining their positions with respect to the MEG sensor array. This step was performed by the MEG system itself, which already had the positions of the HPI coils in phantom coordinates. Figure 2(c) illustrates the positioning of the MEG helmet in the phantom coordinate system from side view and shows all digitized points. The coordinates of all five electrode positions were therefore known in advance, and only the position of the MEG sensor array with respect to the phantom was to be determined by the MEG system before the first measurement. Figure 2(d) shows the top view of the phantom with respect to the MEG sensor array and illustrates the orientation of each segmented electrode contact (C2–C7) at electrode position a = 40 mm.
2.3. Data acquisition
The electrical stimulation comprised of biphasic rectangular pulses with a stimulus pulse phase and a passive charge-balancing phase. The parameters of stimulation used are mentioned in table 1. MEG data was collected with an Elekta Neuromag VectorView® MEG scanner at the Universitätsklinikum Düsseldorf (UKD) in Düsseldorf. The scanner comprises of 306 individual channels, corresponding to 102 magnetometers and 204 gradiometers. It can be noted that only the magnetometer data was used in this study. The noise level according to the datasheet is about 3 fT  for both magnetometers and gradiometers. The acquisition parameters of the MEG scanner were set as follows: ***The sampling rate was set to its maximum of 5 kHz. The low-pass filter was set to the highest possible value of 1660 Hz and the cut-off frequency of the high-pass filter was set to direct current (no high-pass filtering) in order to obtain measurements of the DBS signal with the maximum allowed acquisition bandwidth. The duration of each measurement was three minutes. A total of 38 measurements with bipolar electrode configurations were taken (see table 1), with different activated electrode contacts (1–8: contact numbers, first number: anode, second number: cathode), stimulation parameters (amplitude, pulse width, frequency), and electrode positions within the phantom. Before each recording of the first 29 measurements, the phantom was removed from the MEG scanner, the position of the electrode was changed by rotating the adjustment wheel and the phantom was placed back again. It was not possible to place the phantom at the exact same position in the MEG every time, so the estimation of the phantom position in the scanner had to be performed each time by the MEG system, as described in detail in the previous section. A direct comparison between the localization and rotational orientation results across these 29 measurements can therefore not be drawn. However, in the 30th measurement, the electrode position was set once to a = 40 mm and was not changed until the end. Here, the obtained results could be compared with each other.
Table 1. Performed MEG measurements (1–8: activated contacts).
| Group | Num. | Bipolar configuration | Ampl. (mA) | Pulse (µs) | Freq. (Hz) | Position (mm) |
|---|---|---|---|---|---|---|
| 1 | 1–5 | 1 vs 234 | 11.9 | 100 | 170 | 40, 30, 20, 10, 0 |
| 2 | 6–10 | 1 vs 234 | 11 | 60 | 130 | 40, 30, 20, 10, 0 |
| 11–15 | 234 vs 567 | 11 | 60 | 130 | 40, 30, 20, 10, 0 | |
| 16–20 | 567 vs 8 | 11 | 60 | 130 | 40, 30, 20, 10, 0 | |
| 3 | 21–23 | 1 vs 2 | 11 | 60 | 130 | 40, 30, 20 |
| 24–26 | 1 vs 3 | 11 | 60 | 130 | 40, 30, 20 | |
| 27–29 | 1 vs 4 | 11 | 60 | 130 | 40, 30, 20 | |
| 4 | 30 | 1 vs 2 | 11 | 60 | 130 | 40 |
| 31 | 1 vs 3 | 11 | 60 | 130 | 40 | |
| 32 | 1 vs 4 | 11 | 60 | 130 | 40 | |
| 5 | 33 | 1 vs 234 | 3 | 60 | 130 | 40 |
| 34 | 234 vs 567 | 3 | 60 | 130 | 40 | |
| 35 | 567 vs 8 | 3 | 60 | 130 | 40 | |
| 36 | 1 vs 234 | 1.5 | 60 | 130 | 40 | |
| 37 | 234 vs 567 | 1.5 | 60 | 130 | 40 | |
| 38 | 567 vs 8 | 1.5 | 60 | 130 | 40 |
For the sake of clarity, the table is divided into five groups. In the first group, the bipolar electrode configuration with the maximum possible stimulation parameters was set. In the second group, measurements were performed with the activation of contacts at different electrode heights and positions. The third and fourth group provide directional stimulation with the activation of the tip of the electrode (contact C1) against an individual segmented contact (C2–C4). Notice that the phantom was not moved during the measurements in the fourth group and afterwards. In the fifth group, the stimulation amplitude was reduced to a value as used in clinical routine, i.e. 3 or 1.5 mA. The good quality of recorded data was ensured by an empty room measurement prior to the start of the experiment and by visual inspection of about 1 min of MEG recording before each measurement. Electrode localization was performed for measurements with non-directional stimulation (groups 1, 2, and 5), and rotational orientation detection was performed for measurements with directional stimulation (groups 3 and 4).
2.4. Signal processing
The processing steps of the MEG measurements are depicted in figure 3. For each measurement, we obtained 102 time signals, one from each MEG sensor. The measured data was imported into MATLAB® (Version R2018a) and preprocessed using the FieldTrip toolbox [20]. Each time signal was 180 s long and high-pass filtered (6th order Butterworth) with a cutoff frequency of 60 Hz without signal loss since the signal contains higher frequencies (stimulation frequency f0 and its harmonics) as shown in table 1. Each signal was divided into short segments of length equal to the inverse of stimulation frequency, e.g. for 170 Hz stimulation  ms (first five measurements in table 1) and
  ms for 130 Hz of stimulation (remaining measurements in table 1). These segments were then averaged which improved the signal-to-noise ratio (SNR) by
  , where
  . The maximum value from this averaged time segment is then taken for each MEG sensor, resulting in a total of 102 values representing the maximum magnetic field
  measured by each sensor at location i. Since these were phantom measurements, the measured MEG signals were not contaminated by biological artifacts such as cardiac muscle, skeletal muscles, or eye movements. Thus, the measurements with a phantom represent an ideal case. The ambient noise solely consisted of the power line interference, which only affected non-important frequencies (50 Hz and harmonics). The only magnetic noise in our MEG recordings arose from a non-biological source, i.e. from the ferromagnetic ferrule, which was placed under the screw, that over time became magnetized and generated an artificial magnetic field. This artifact was modeled in the electromagnetic simulations using the known position and dimensions of the ferrule and was subtracted from the measured data. The results are given in section 3.2.

Figure 3. Each measured MEG signal is high-pass filtered with 60 Hz cutoff frequency, segmented, and averaged to a single period with  averages. Then, the maximum amplitude value is taken.
Download figure:
Standard image High-resolution image2.5. Localization and rotational orientation determination
Finite element modeling (FEM) and model-fitting approach were used to determine location and rotational orientation of the DBS electrode in the phantom. Using FEM, the magnetic field was calculated at measurement points i with different electrode positions p and rotations r. The values calculated by the model are represented by  . That is, a single model with a given electrode position p1 and electrode rotation r1 resulted in 102 modeled values corresponding to a total of 102 measurement points. Modeled data with different electrode positions was used for electrode localization that was performed for measurements with non-directional stimulation (groups 1, 2, and 5 in table 1). The corresponding contacts of the electrode were activated in the model resulting in a symmetrical flow of current along the length of the electrode. Modeled data with different electrode rotations was used to perform orientation detection using measurements with directional stimulation (groups 3 and 4 in table 1). The bottom contact C1 (the tip) of the electrode was activated against one of the segmented contacts C2, C3, or C4. This led to a current flow that was steered in a direction compared to the non-directional stimulation. The model is described in detail in the next paragraph. A fitting approach was then used that searched for the model that best fit the measured and preprocessed data
  , which was described in the previous subsection. Therefor, the algorithm calculated the normalized root mean square error (NRMSE) between each modeled and measured data, and determined the model with the smallest error. From the selected model
  ,
,  was the computed electrode position and
  the computed electrode orientation. The error in electrode localization was calculated with the Euclidean distance between
  and
and  , the real known position of the electrode in the phantom. The error in determining the electrode orientation was calculated using the angle between
  and
and  , the real known orientation of the electrode in the phantom.
FEM electromagnetic simulations were based on a model created in COMSOL Multiphysics®, as shown in figure 4. For each structure in the model, the corresponding material was taken directly from the built-in material library and value of a uniform electrical conductivity σ, relative permeability µr
, and relative permittivity  r
were assigned. The electrode was placed parallel to the longitudinal axis of the cylinder. The cylinder body and the outer jacket of the electrode were modeled with acrylic plastic (
r
were assigned. The electrode was placed parallel to the longitudinal axis of the cylinder. The cylinder body and the outer jacket of the electrode were modeled with acrylic plastic ( , µr
= 1, r
= 4.2), the eight independent electrode contacts with platinum-iridium (
, µr
= 1, r
= 4.2), the eight independent electrode contacts with platinum-iridium ( , µr
= 1, r
= 1), and the content of the phantom with saline solution (
, µr
= 1, r
= 1), and the content of the phantom with saline solution ( , µr
= 1, r
= 80). These values were taken from the literature. The phantom including the modeled electrode was surrounded by a cuboid box with a length of 500 mm that is filled with air (
, µr
= 1, r
= 80). These values were taken from the literature. The phantom including the modeled electrode was surrounded by a cuboid box with a length of 500 mm that is filled with air ( , µr
= 1, r
= 1). The MEG helmet was modeled as a surface and all measurement points were located on that surface. Tetrahedral mesh of 'Extra Fine' resolution was utilized. To model the bipolar electrode configurations, the 'Terminal' boundary condition of 'Current Type' was used for the cathode and the 'Ground' boundary condition was used for the anode. Simulations were performed using the 'Magnetic and Electric Fields (mef)' interface of the 'AC/DC module' of COMSOL and magnetic flux densities in x, y, and z direction (
, µr
= 1, r
= 1). The MEG helmet was modeled as a surface and all measurement points were located on that surface. Tetrahedral mesh of 'Extra Fine' resolution was utilized. To model the bipolar electrode configurations, the 'Terminal' boundary condition of 'Current Type' was used for the cathode and the 'Ground' boundary condition was used for the anode. Simulations were performed using the 'Magnetic and Electric Fields (mef)' interface of the 'AC/DC module' of COMSOL and magnetic flux densities in x, y, and z direction ( ,
,  , and
, and  ) on the surface of the MEG helmet were calculated. In this experiment, SQUID sensors (fixed in the helmet) measured the magnetic field perpendicular to the helmet surface. To find the magnetic field
  perpendicular to the helmet surface in the simulation, we used the dot product
  , where
  is the unit vector perpendicular to the helmet at the sensor location i and
  .
.
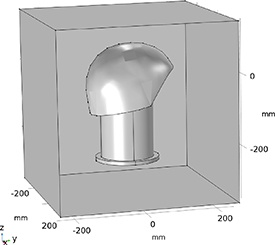
Figure 4. Diagram of the used finite element model with its dimensions. It includes the cylindrical phantom that is filled with saline solution, the directional DBS electrode placed inside the phantom, and the helmet-shaped MEG sensor surface. These structures are surrounded by a cuboid air box with a length of 500 mm.
Download figure:
Standard image High-resolution imageIn the model, the electrode was successively moved in the phantom with a step size of 1 mm (in all x, y, and z directions) and the magnetic field was calculated at each position. This data was used to analyze measurements with non-directional stimulation. The fitting approach found the electrode position which resulted in minimum NRMSE with the measured data. To analyze directional stimulation measurements, the electrode was successively rotated along its own axis with an angle step of 1∘ and the produced magnetic field was found for each step. Again, the fitting approach found the orientation that minimized the NRMSE. To improve detection accuracy, contiguous measurements could be evaluated together using a-priori information of electrode geometry. When determining electrode position, measurements with different levels of activated contacts along the electrode (lower, middle, upper level stimulation) were used, and the distance between adjacent levels was known to be 2 mm. When determining electrode rotation, measurements with different directional segments were used, and the angle between adjacent segments was known to be 120∘. In contrast to the analysis of a single measurement, where the fitting approach determined only a single model which gave minimum NRMSE, when analyzing contiguous measurements (i.e. three measurements with stimulation electrode at different level or direction), the fitting algorithm determined three contiguous models (i.e. three related models with stimulation level separated by 2 mm or direction separated by 120∘) whose calculated values minimized the sum of the individual NRMSE with the corresponding measured values. The results based on consideration of multiple measurements are presented in section 3.5.
3. Results
3.1. Magnetic field strengths
The magnetic flux densities obtained from the time signals are summarized in table 2. The maximum amplitudes from all sensors from all measurements in groups 2 and 5 were considered. From the data shown in the table, we can conclude the following two points:
- Decreasing the stimulation amplitude leads to a proportional decrease in the magnetic field.
- The expected mean magnetic fields from MEG measurements in DBS patients with bipolar stimulation amplitude of 1.5–3 mA will be in average in the range of 1–2 pT.
Table 2. Measured magnetic flux densities.
| Amplitude (mA), Pulse width (µs), Frequency (Hz) | Stats of values obtained from time signal from all sensors (pT) | ||
|---|---|---|---|
| Min | Mean | Max | |
| 12, 100, 170 | 2.4 | 25 | 65 |
| 11, 60, 130 | 2.0 | 7.6 | 24 |
| 3, 60, 130 | 0.6 | 2 | 6.6 |
| 1.5, 60, 130 | 0.3 | 1 | 3.3 |
3.2. Measured and modeled magnetic field distribution
The magnetic field distribution for measurement #11 (non-directional) can be seen in figure 5(a). Since we had data for only 102 points across the surface, we used interpolation to get a surface plot. This figure represents a typical measured field distribution for bipolar recordings. It shows the magnetic field that is generated by the current flowing between the activated contacts (see figure 5(b)) and the undesired field that is created due to the magnetization of the ferromagnetic ferrule (see figure 5(c)). Our phantom was made of non-magnetic materials (titanium screws and plastic parts). As already mentioned in section 2.4, this ferrule described the only magnetic noise which produced an artificial magnetic field. This artifact was observed in each measurement and was removed by modeling (in electromagnetic simulations) and by subtracting it from the measured data. Figure 6 compares the electromagnetic simulation results of a non-directional (left column) and directional (right column) stimulation. Figures 6(a) and (b) displays the top and side view of the electrode with the current density generated due to the active contacts. In the non-directional case, the current flows symmetrically along the electrode and in the directional case, it is asymmetrical. The asymmetry in the current flow also causes an asymmetry in the magnetic field distribution (see right side of figure 6(c)) which determines the rotational orientation of the electrode. We did not observe an effect of the connector, excess electrode wire, and neurostimulator on the measured magnetic field. This may be because the return current in the connector and wire cancels the field generated by the current flowing in the other direction (bipolar configuration). The current flowing within the neurostimulator may not be symmetrical and could have generated some magnetic field, but this is difficult to isolate and measure.
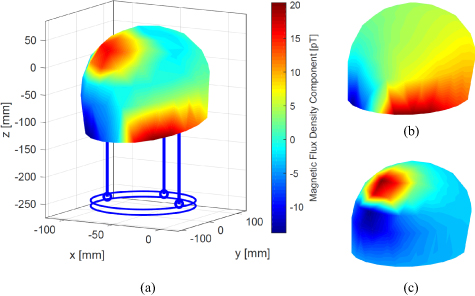
Figure 5. (a) Measured magnetic field distribution at the MEG helmet surface for measurement #11. The maximum amplitude from the averaged signal at each measuring point is calculated and interpolated between the points. The red and blue area in the lower part represents the magnetic field generated by the electrode and the circular red area in the top the artifact of the ferromagnetic ferrule. (b) Normalized modeled magnetic field distribution generated by the bipolar electrode configuration and (c) by the artifact of the ferromagnetic circular ferrule as the result of the electromagnetic simulation. The addition of both models represents the entire model.
Download figure:
Standard image High-resolution image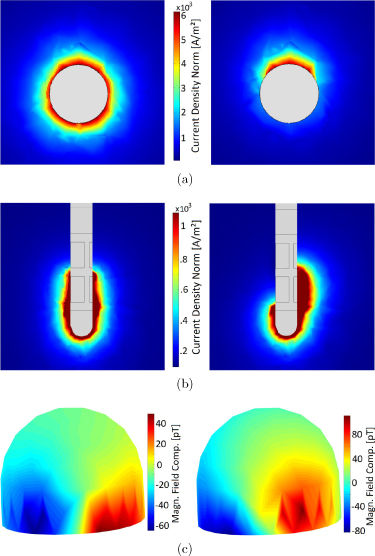
Figure 6. Electromagnetic simulation results of a non-directional (left column) and directional (right column) stimulation. The magnitude of the current density is visualized from the top view (a) and side view (b) of the electrode. With non-directional stimulation, the current flows symmetrically along the electrode, which generates the corresponding magnetic field distribution (c). With directional stimulation, the current flows diagonally, which causes a different field distribution that is used to determine the rotational orientation of the electrode in the phantom.
Download figure:
Standard image High-resolution image3.3. System measurement accuracy
Before the results of electrode localization and orientation determination are presented in the following sections, this section investigates the overall measurement accuracy since it describes the spatial resolution of the entire system. The system measurement accuracy depended on the inaccuracy of the following measuring steps:
- The phantom was constructed in-house and had an accuracy in sub-millimeter range (±0.1 mm).
- The digitizer device showed an accuracy of ±0.3 mm (see section 2.2).
- The position of the HPI coils on the phantom surface, localized internally by the MEG system, provided the accuracy of the initial phantom position determination. The distances between the fitted coil positions and the digitized points are compared in figure 7, which shows the HPI fitting errors for all performed measurements. The average error was ±1.6 mm for the pair 1–3, 1.4 mm for the pair 1–4, and 0.6 mm for the pair 3–4. The pairs with coil number 2 had larger fitting errors and were therefore not considered by the MEG system.

Figure 7. Error in the distances between HPI coils measured by the MEG scanner prior to each measurement. The pairs with coil number 2 showed high HPI fitting errors and were therefore not considered. The mean error of the fitting results is 1.6 mm for pair 1–3, 1.4 mm for pair 1–4, and 0.6 mm for pair 3–4.
Download figure:
Standard image High-resolution imageThe sum of all inaccuracies leads to a value of ±2 mm and describes the spatial resolution of the entire system. This value is taken into account in the electrode localization and rotation determination in the next sections. The dominant error is caused by the estimation of the phantom position by the MEG scanner.
3.4. Results using single measurement
In this section, the results of electrode localization and rotational orientation determination from the first three groups in table 1 are presented. Note that after each measurement in these groups, the phantom was taken out of the MEG scanner to reposition the electrode and could not be placed exactly in the same position with respect to the MEG scanner and, thus, the measurements conducted in these groups cannot be compared. Therefore, each measurement had to be analyzed separately.
3.4.1. Localization
Electrode localization was performed for the first 20 measurements in table 1. In these measurements with non-directional stimulation electrode position (in the xy-plane), the level of activated contacts along the z-axis was varied. The real electrode locations and the localization results from the measured magnetic data are depicted in figure 8. It shows the top view of the cylindrical phantom which has a radius of 75 mm. Five blue dots represent the five electrode placements (a = 40, 30, 20, 10, 0 mm) used in this work. The locations of the DBS electrode found using MEG are illustrated by red asterisks. This deviation is similar at all electrode positions which suggests that the localization accuracy is not affected by the proximity of the electrode to the phantom surface and to the sensor array. A similar distribution of localization results was observed for activated contacts at different electrode levels. The localization accuracy (represented by the Euclidean distance between real and computed electrode position) is calculated to be around 3 mm on average.
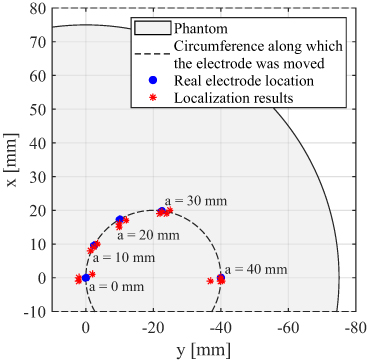
Figure 8. Top view of the cylindrical phantom with 75 mm radius. The electrode can be placed at any location on the inner circle (dashed line) by rotating the adjustment wheel. In this work, the electrode was placed at five different positions indicated by blue dots. Red asterisks illustrate electrode locations found by magnetic measurements.
Download figure:
Standard image High-resolution image3.4.2. Orientation detection
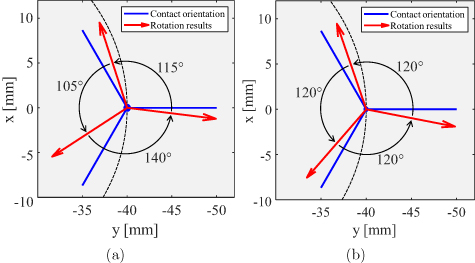
The rotational orientation of the DBS electrode was found for measurements 21–29. Directional current was applied in the phantom in different directions using bipolar stimulation by activating contact C1 as anode and segmented contacts C2, C3, and C4 one-by-one as cathode. Real orientation of each segmented contact at three different electrode positions in the phantom, as well as the rotation results from the measured data are depicted in figure 9. It displays the top view of the phantom, where blue lines represent real orientations of each segment and red arrows orientations estimated by magnetic field measurements. Computed orientations are located close to the corresponding real orientations. The detection accuracy was calculated to be around 15∘.
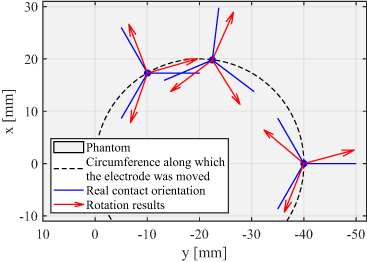
Figure 9. Top view of the cylindrical phantom. The electrode was placed at three different positions in the phantom represented by blue dots. Blue lines describe real orientations of each segmented contact and red arrows represent computed rotation results. The mean accuracy of rotation determination is around 15∘ on average.
Download figure:
Standard image High-resolution image3.5. Results using multiple measurements
In this section, the results of electrode localization and rotational orientation determination from the last two measurement groups in table 1 are presented. The position of the phantom remained the same across these measurements since it was not taken out of the MEG scanner to reposition the electrode. Since the distance between adjacent contacts of the electrode (which is 2 mm) and the angle between adjacent segmented contacts (which is 120∘) is known, measurements at different stimulation heights and directions can be considered together to improve detection accuracy.
3.5.1. Localization
Electrode localization was performed for the measurements 33–35 and 36–38, where the phantom was not moved during measurements. Figure 10(a) depicts the localization results for measurements 33–35 with colored points. Different colors represent different levels of activated contacts along the electrode, where green refers to the lower, red to the middle, and blue refers to the upper level. The positions of localized sources reveal an average localization error of 2.8 mm, which is closer to the accuracy obtained in the previous section. Since the position of each electrode level was estimated separately, the distance between adjacent points in the figure deviated significantly from 2 mm. If the a-priori known distance is applied as a condition for localization as delineated in figure 10(b), the result improves slightly to the value 2.2 mm. Moreover, it can be seen that localized points are not arranged along the electrode but along a different axis. This error is mainly due to the inaccurate estimation of the phantom position in the MEG scanner. When looking at the figure, it already becomes clear that the localization accuracy could be further improved if the localized points would be slightly shifted in negative z-direction and tilted in the xz-plane. This observation suggests that a slight readjustment of the MEG sensor array, i.e. an improvement of the system spatial resolution, would significantly improve the localization accuracy.
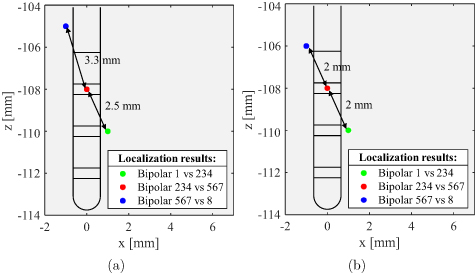
Figure 10. Localization results for different levels of activated contacts along the electrode (a) by considering each position separately and (b) by considering each position together while constraining solutions to known distances between adjacent positions.
Download figure:
Standard image High-resolution image3.5.2. Orientation detection
The determination of the rotational orientation of the directional electrode was performed for measurements 30–32. The electrode was directionally stimulated in the phantom by activating the tip of the electrode against all segmented contacts successively. The obtained rotation results are shown in figure 11(a) with red arrows, while the blue lines indicate real orientations of the segments. The accuracy of rotation determination is calculated to an average of 15∘, which corresponds exactly to the accuracy obtained in the previous section for different electrode positions. The orientation for each segment was estimated separately. If the a-priori known angle is applied as a condition for rotation detection, the result improves slightly to a value of 11∘, as illustrated in figure 11(b). This error is mainly due to the inaccurate estimation of the phantom position in the MEG scanner. A minimization of this error can be achieved by a more precise measuring system.
Figure 11. Rotational orientation results for each segmented electrode contact (a) by considering each orientation separately and (b) by considering each orientation together while constraining solutions to known angels between adjacent orientations.
Download figure:
Standard image High-resolution image
4. Discussion
In this paper, a new method to determine the position and the rotational orientation of a DBS electrode by using magnetic field measurements with SQUID sensors was presented. These measurements were valuable for us because they were performed on a MEG scanner in a clinical setting in comparison to our previous work, which was based on an in-house constructed measurement system with a single sensor. Employing clinically used DBS stimulation parameters of 1.5 mA/3 mA amplitude, 60 µs pulse width, 130 Hz frequency, and bipolar configuration, a magnetic field of 1/2 pT on average was measured. This value represents the minimum requirement for the sensitivity of magnetic field sensors for this type of application. However, the SNR of the measured signal can be drastically improved by segmenting the signal into time periods equivalent to the stimulation time period and then by averaging over these segments.
To date, no generally accepted protocol for DBS electrode localization is available. Localization of a DBS electrode in patients using MEG presents an alternative method to the currently employed neuroimaging approaches, in which the electrode is localized by visual inspection of metal artifacts. These neuroimaging techniques have their own limitations, which were briefly discussed in the introduction and in detail in our previous work [11]. In our method presented here, the stimulation current produced a strong magnetic field (in the pT range), significantly larger than the field generated by human brain activity (in the fT range), and was measured by MEG sensors. The DBS electrode in the phantom could be reliably localized with an accuracy of about 3 mm over all performed measurements, each measurement being considered separately for localization. The accuracy could be improved to around 2.2 mm by using multiple measurements and applying a-priori known distance between adjacent contacts as a condition for localization. These accuracies were limited due to the imprecise estimation of the phantom position by the MEG device. This suggests that the localization accuracy can be significantly improved further if the spatial resolution of the MEG scanner is also improved.
Similar to electrode localization, no established protocol to ascertain the electrode orientation is currently available. The determination of the rotational orientation of the electrode using MEG describes an alternative method to the existing radiation-based methods. Segmented contacts of a directional electrode can allow generation of an electric field in a desired direction. This new technology requires the knowledge of the exact electrode orientation in the brain in order to fully exploit its benefit. In all other methods currently available, patients are exposed to radiation. The method presented here is completely harmless and safe for patients. The orientation of each electrode's directional contact was determined with an average accuracy of 15∘, whereby each measurement was used separately for the determination. However, this error could be reduced to about 11∘ by using multiple measurements and applying the a-priori known angle between adjacent segments as a condition for orientation detection. Again, the accuracy was mainly limited by the spatial resolution of the MEG scanner, which suggests that a significant improvement in determining electrode orientation can be achieved if the measurement accuracy is improved.
A non-radiative and non-invasive method for the precise determination of a DBS electrode's position and rotation constitutes an important development in stereotaxic neurosurgery and DBS therapy. The results presented in this paper demonstrate that a MEG scanner can detect the position and orientation of a segmented electrode in a cylindrical phantom with decent accuracy, and a higher accuracy can be achieved if the scanner is made more precise. We are aware that our measurements were made under an ideal condition and that the accuracy will decline in real patients due to movements associated with breathing and cardiac activity. Moreover, a heterogeneous patient-specific FEM head model will be required. Nevertheless, the desired localization accuracy can be achieved using a more precise MEG scanner. At present, MEG scanners use a fixed helmet-shaped sensor array, relative to which the head can move. Emerging technical developments using optically pumped magnetometers may lead to cap-shaped MEG sensor arrays that will move with the head [21], i.e. no relative movement between head and sensors, and can adapt to the individual head shape. In that case, sufficient accuracy in determining the position and rotation of the electrode can be achieved. Therefore, the results presented here suggest that, in principle, a non-invasive and radiation-free electrode localization and orientation detection is possible using MEG, and new technical developments will foster this endeavor.
5. Conclusion
We have presented a novel non-invasive and non-radiative method to determine location and rotational orientation of a DBS electrode using MEG. Magnetic field around the phantom was measured with a clinically used MEG scanner and calculated using precise electromagnetic FEM model. A fitting approach was then used to minimize the error between measured and modeled values. Our method localized the DBS electrode with an accuracy of about 2.2 mm and its orientation with an accuracy of 11∘ regardless of the electrode location in the phantom. The spatial resolution of the MEG scanner was the main limiting factor for these lower accuracies. If more precise MEG systems are available, allowing precise determination of the phantom position in the MEG scanner, these accuracies will be improved significantly.
Acknowledgment
This work was supported by the German Research Foundation (Deutsche Forschungsgemeinschaft, DFG) through the Project T1 of the Collaborative Research Centre CRC 1261 Magnetoelectric Sensors: From Composite Materials to Biomagnetic Diagnostics. Furthermore, we would like to express our very great appreciation to the group of Prof Schnitzler from the Heinrich-Heine-University Düsseldorf, in particular to Levent Kandemir and Holger Krause, for their support in performing the MEG measurements.