
Abstract
Objective. To characterize the cortical oscillations associated with performance of the sustained attention to response task (SART) and their disruptions in the neurodegenerative condition amyotrophic lateral sclerosis (ALS). Approach. A randomised SART was undertaken by 24 ALS patients and 33 healthy controls during 128-channel electroencephalography (EEG). Complex Morlet wavelet transform was used to quantify non-phase-locked oscillatory activity in event-related spectral perturbations associated with performing the SART. We investigated the relationships between these perturbations and task performance, and associated motor and cognitive changes in ALS. Main results. SART induced theta-band event-related synchronization (ERS) and alpha- and beta-band event-related desynchronization (ERD), followed by rebound beta ERS, in both Go and NoGo trials across the frontoparietal axis, with NoGo trials eliciting greater theta ERS and lesser beta ERS. Controls with greater Go trial beta ERS performed with greater speed and less accuracy. ALS patients exhibited increased anticipation compared to controls but similar reaction times and accuracy. Prefrontal (area under the receiver operating characteristic curve (AUROC) = 0.8, Cohen's d = 0.97) and parietal (AUROC = 0.82, Cohen's d = 1.12) beta-band ERD was significantly reduced in ALS but did not relate to performance, while patients with higher Edinburgh Cognitive and Behavioural ALS Screen (ECAS) ALS-specific scores demonstrated greater ERS in beta (rho = 0.72) upon successful withholding. Significance. EEG measurement of task-related oscillation changes reveals variation in cortical network engagement in relation to speed versus accuracy strategies. Such measures can also capture cognitive and motor network pathophysiology in the absence of task performance decline, which may facilitate development of more sensitive early neurodegenerative disease biomarkers.
Export citation and abstract BibTeX RIS

Original content from this work may be used under the terms of the Creative Commons Attribution 4.0 license. Any further distribution of this work must maintain attribution to the author(s) and the title of the work, journal citation and DOI.
1. Introduction
The sustained attention to response task (SART) is a widely employed task of ability to sustain overt attention. This subdomain of executive function is probed by requiring the participant to withhold a motor response to a rare target among regular responses to non-target stimuli. While accuracy and response time measures have shown ability to capture impairments in sustained attention [1], the contribution of a combination of perceptual, planning, motor and attention functions to these task-specific measures makes them relatively non-specific to the dysfunction in different regions of cortical networks. Further, differences in performance may reflect variation in participant approach with respect to the speed-accuracy trade-off (i.e. the extent to which response speed is prioritised over response accuracy) [2].
The functions and neural processes engaged by SART are reflected in the cortical regions it activates, including prefrontal, parietal and motor domains. We have recently demonstrated this cortical activation through the combination of quantitative electroencephalography (EEG) and source analysis, which provides excellent temporal resolution with good spatial resolution. We have also demonstrated that disease-related abnormalities in cortical network activation can be interrogated individually using spatially and temporally specific measures to determine the nature of underlying network disruption, even in the absence of impaired task performance [3].
Functional network communication at short and long range is captured by EEG as sinusoidal oscillations of specific frequencies, typically grouped into delta (<4 Hz), theta (4–7 Hz), alpha (8–12 Hz), beta (13–30 Hz) and gamma (>30 Hz) bands. Changes in the magnitude (power) of these oscillations in relation to task performance are referred to as event-related spectral perturbations (ERSP). ERSP reflect changes in the degree of network communication within and between cortical regions as a task is performed [4, 5]. Relative increase in oscillation magnitude is referred to as event-related synchronization (ERS), while relative decreases are referred to as event-related desynchronization (ERD). These ERSP may be phase-locked (i.e. occurring at the same position along the sinusoidal waveform across trials relative to the stimulus delivery) or non-phase locked (i.e. oscillation magnitude changes consistently, but the position along the sinusoidal waveform relative to stimulus delivery varies across trials) [6]. While phase-locked changes are captured by time domain analysis, such as our previous analysis of event related potentials, non-phase locked changes are lost through averaging across trials. These non-phase locked oscillations can capture important information on cortical network performance and provide valuable information on physiological processes. Additionally, they have highlighted disrupted intracortical motor and cognitive network communication in Parkinson's [7, 8] and Alzheimer's [9] disease, predict cognitive decline in mild cognitive impairment [10], and provide greater diagnostic ability than event-related potential measures in mild cognitive impairment and Alzheimer's disease [11].
Here, we investigated the changes in cortical oscillations during the SART by quantifying non-phase locked ERSP. We sought to establish whether these oscillations are disrupted in amyotrophic lateral sclerosis (ALS) using time-frequency domain EEG analysis, and to determine whether such oscillations predict task performance measures in controls and in ALS patients. We hypothesised that these measures will provide additional insight into the nature of dysfunction in cortical networks which bridge motor and cognitive function in ALS.
2. Methods
2.1. Participants
2.1.1. Recruitment
Patients were recruited at Ireland's National ALS specialty clinic in Beaumont Hospital. Controls included healthy, age-matched, population-based individuals recruited from an existing cohort established and maintained by the Irish ALS Research Group.
2.1.2. Inclusion criteria
All participants were over 18 years of age and able to give informed written consent, or in the presence of two witnesses, verbal consent. Patients were diagnosed with Possible, Probable or Definite ALS in accordance with the El Escorial Revised Diagnostic Criteria.
2.1.3. Exclusion criteria
Those with neurological functional/structural, psychological or muscular disorders other than ALS (including those with comorbid frontotemporal dementia (FTD)) and those currently taking neuromodulatory or myomodulatory medications (e.g. antidepressants, anti-epileptics, GABA antagonists) that could affect recordings were excluded, except for riluzole.
2.2. Experimental paradigm
The experimental paradigm is identical to that described in detail in our previous SART study [3], briefly described here. Participants were seated at a distance of 1 ± 0.1 m in front of a monitor. Individual digits of one to nine were shown in random order for 250 ms with an interstimulus interval randomised between 1120 and 1220 ms during which the screen was black. Responses were captured by clicking the left button of a computer mouse with the right index finger. Four recording sessions of 252 trials, with the number 3 appearing in 11% of trials, were undertaken. The behavioural measures captured were: response time, overall response accuracy, NoGo accuracy (percentage of 3-digit stimuli followed by response omission), Go accuracy (percentage of non-3 digit stimuli followed by a response in the permitted time window) and anticipation rate (clicking less than 150 ms after a go stimulus). Participants were instructed to click every time they saw a number except for the number three, to equally prioritise speed and accuracy and to use only their finger to respond, to reduce EMG artefact in the EEG signal. Participants performed one practice round without performance being measured under supervision of the experimenter.
2.3. Data acquisition
2.3.1. EEG
EEG recordings were taken with 128 Ag-AgCl electrodes during the experimental paradigm via the BioSemi® ActiveTwo system (BioSemi B.V., Amsterdam, The Netherlands). Recordings were performed at St. James's Hospital, Dublin. EEG signals were filtered online from 0 to 134 Hz and digitized at 512 Hz.
2.3.2. ALS functional rating scale revised (ALSFRS-R)
ALSFRS-R data were recorded at the Irish National ALS specialty clinic for each participant. Scores were included in analysis if collected within ±90 d of EEG.
2.3.3. Cognitive and behavioural tests
ECAS and Delis–Kaplan Executive Function System Colour-Word Interference Test (CWIT) [12] data were included if collected within ±90 d of EEG.
2.3.4. Disease duration
Disease duration was quantified as the number of months between patient-reported date of first symptom onset and date of EEG recording.
2.4. Data analysis
2.4.1. EEG signal pre-processing
Signal pre-processing procedures are identical to those described in detail in our previous SART study [3]. This includes application of a high pass 0.3 Hz dual-pass 5th order Butterworth filter and a low pass 35 Hz dual-pass 117th order equiripple finite impulse response filter, manual removal of non-stereotyped artefacts, epoching of data from 200 ms pre-stimulus to 900 ms post-stimulus, independent component analysis and removal of noise-specific components, mean baseline amplitude subtraction and common average referencing.
2.4.2. Time-frequency analysis
Each trial epoch consisted of 563 data points (i.e. 1100 ms of data recorded at 512 Hz) per channel. A random subset of Go trials followed by correct responses (a click) were chosen to match the number of NoGo trials followed by correct response (no click) for further analysis. Complex Morlet wavelets were chosen for time-frequency analysis as they have a sinusoidal basis with symmetric Gaussian envelopes and their width can be adjusted for the desired number of oscillations. To facilitate the application of the complex Morlet wavelet transform, for each channel, each epoch was data-padded with 563 repetitions of the first data point at the start, and 563 repetitions of the last data point at the end. As data had been low-pass filtered at 35 Hz during pre-processing for a previous time-domain analysis [3], calculation of wavelet moduli was performed for a range of 1–35 Hz. The complex coefficients of transform (W) were subsequently re-epoched by removing the padded data. Mean inter-trial phase variance (ITV) across epochs (e) was calculated per time point (t) and frequency (f) to provide a measure specifically of non-phase locked (i.e. not captured by our previous event related potential (ERP) analysis) oscillatory activity [13] as:
where  denotes mean value of W across all epochs and
  denotes the total number of epochs. ITV were calculated for the Fz, Cz and Pz channels. These electrodes were chosen due to their proximity to executive and motor function associated cortical domains. Baseline values for each frequency were calculated as mean ITV across the −200 ms to 0 ms window. Event related spectral perturbation (ERSP) values for each time and frequency was then calculated as:
for t = 1–900 ms. Time–frequency analysis was performed separately for Go and NoGo trials. Analysis of the difference between NoGo and Go trials was performed by subtraction thereafter.
2.5. Statistics
2.5.1. Oscillation analysis
To check for gender effect, analysis of variance (ANOVA) were performed separately for each Go and NoGo region of interest (ROI), using electrode, gender and group (patient or control) as independent variables, to measure the significance of gender and group effects on ROI power (dependent variable). A false discovery rate (FDR) of 5% was applied to p-value families across ANOVA, implemented using the Benjamini and Hochberg method [14], to account for multiple comparisons. Tukey's post hoc analysis was also implemented for each ANOVA to identify individual electrodes which significantly differed between groups. For time–frequency plane statistical analysis of each electrode, data were down sampled to 34 Hz (i.e. 1/15 data points). To identify significant (i.e. significantly different from zero) ERSP in controls, Wilcoxon's (paired) Sign-Rank W-statistic, transformed to Z scores, was used as a test statistic. To identify significant differences between control and patient ERSP, area under the receiver operating characteristic curve (AUROC) [15] was used as a test statistic. In both cases, a 5% false discovery rate [16] was used as a frequentist method for determining significant power differences amidst these high-dimensional data. Empirical Bayesian inference [17] provided Bayesian posterior probabilities, as well as the achieved statistical power and AUROC.
2.5.2. Effect sizes and correlations
Specific time-frequency areas were defined as ROIs based on significant oscillation patterns identified in the control group (without inclusion of, or comparison to the patient group) as ERD/ERS elicited by the SART in controls has not previously been reported. These ROIs were defined in order to determine effect size of differences between patients and controls and investigate clinical correlations in patients, based on mean ERSP values (without down sampling) within these ROIs. Cohen's d was used as an index of effect size, where d > 0.8 indicates a large effect size [18].
Spearman's non-parametric rank correlation was used to investigate relationships between mean ERSP values in the ROIs and neuropsychological and motor test scores. Partial correlation was implemented for investigating relationships to CWIT inhibition and inhibition-switching subscores, to control for the effects of decline in speech function (quantified by the ALSFRS-R speech score) at time of CWIT testing. Multiple comparisons were accounted for using a 5% FDR, implemented using the Benjamini and Hochberg method [14].
2.5.3. Demographics
Mann–Whitney U-testing and chi-squared proportion testing were used to compare age and gender respectively between groups, with significant differences determined where q = 0.05 (corresponding to the p < 0.05 for individual testing).
2.5.4. Selected measures for reporting the main findings
For reporting the results of statistical analyses, we use the p-values as a first stage screening for significant findings. We then report the effect sizes (e.g. Cohen's d), which reflect how strong the changes in the brain are (as a patho-physiological phenomenon). Finally, to show how much discrimination between controls and ALS patients is afforded by each measure, we use the AUROC as a measure commonly used in medical statistics [19].
3. Results
3.1. Participant demographics
The same ALS patient and control datasets were employed as in our previous time-domain study [3], with one additional patient dataset analysed here. Therefore, a total of 24 ALS patients (3 female, age median [interquartile range]: 69 [59–72] years) and 33 controls (17 female, age median [interquartile range]: 64 [57–69] years) were included in this analysis. Groups were age-matched but not gender matched, as previous comparison of male and female controls for parameters of interest revealed no gender-related differences [3]. ANOVA found significant group effects for some ROI (described below) but no significant gender effects. The ALS cohort included three patients with a C9orf72 gene expansion, with the remainder of patients not carrying or not tested for this pathogenic expansion. Site of onset of disease symptoms was spinal in eighteen patients, bulbar in five patients, and thoracic in one patient. Disease duration and time since diagnosis median [interquartile range] of patients was 17.65 [10.15–23.92] months and 4.42 [2.98–9.71] respectively. ALSFRS-R, ECAS and CWIT scores collected within 90 d of EEG were available for 18, 15 and 9 patients respectively. Survival data were not analysed as only two patients were deceased at time of analysis.
3.2. Task performance
Mean response time was 364 ms in controls and 375 ms in patients. Mean ± standard deviation trial accuracy (Go and NoGo) was 99.67 ± 0.48 and 78.31 ± 12.73% in controls and 98.96 ± 1.60 and 77.90 ± 12.53% in patients respectively. Control and patient accuracy and response time measures were not significantly different. Patients had significantly (p = 0.0042) greater anticipation errors than controls (patient mean ± standard deviation: 0.084 ± 0.14%, control: 0.01 ± 0.03%).
3.3. Event related spectral perturbations
3.3.1. Go trials
During Go trials, theta-band (4–7 Hz) ERS (i.e. increase in power relative to baseline), alpha-band (8–12 Hz) ERD (i.e. decrease in power relative to baseline) and beta-band (13–30 Hz) ERD were present across the frontoparietal axis. Beta ERD was followed by ERS, predominantly in Fz and Cz. These ERSP patterns in healthy controls, as informed by sign rank statistical analysis, were examined further as ROIs for comparing ALS patients against controls and when performing correlation analyses in 100–700 ms, 250–600 ms, 200–500 ms and 650–850 ms post-stimulus time windows respectively (figure 1(A)).

Figure 1. Significant (A) Go and (B) NoGo trial related spectral perturbations in controls. Heat maps illustrate mean ERSP values for significant (sign rank pcorr < 0.05, at q = 0.05) ERSP. Regions of interest are demarcated by black boxes. Light blue areas are those of no significant spectral perturbation relative to baseline. Colour bar limits are set according to the maximum and minimum values observed for that trial type in any electrode of interest.
Download figure:
Standard image High-resolution image3.3.2. NoGo trials
Theta-band ERS, alpha-band ERD and beta-band ERD were also present across the frontoparietal axis during NoGo trials. A significant synchronization was also present in upper beta band (20–30 Hz). These ERSP were examined further as ROIs (when comparing ALS patients and controls and when performing correlation analyses) in 100–700 ms, 350–700 ms, 200–600 ms and 750–850 ms post-stimulus time windows respectively (figure 1(B)).
3.3.3. The difference between NoGo and Go trials
NoGo trials differed from Go trials by greater theta band ERS over Fz and Cz, greater alpha ERD (i.e. greater event-related reduction in oscillatory power in NoGo trials relative to Go trials) and reduced slow beta (13–22 Hz) ERS (i.e. less event-related increase in oscillatory power in NoGo trials relative to Go trials) in all three electrodes. These ERSP differences in the control group were in the 150–450 ms, 500–900 ms and 600–850 ms post-stimulus time windows respectively (figure 2), and were defined as additional ROIs (for comparing ALS patients against controls and when performing correlation analyses).
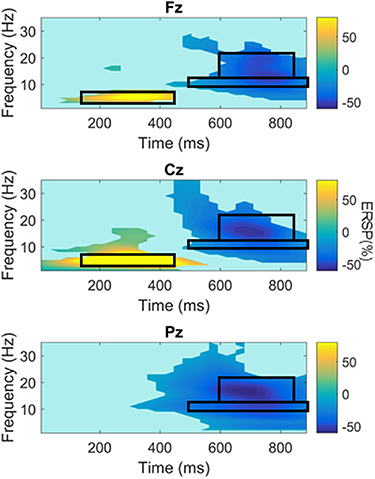
Figure 2. Significant differences between NoGo and Go trial related spectral perturbations in controls. Heat maps illustrate mean ERSP NoGo-Go values for significant (sign rank pcorr < 0.05, at q = 0.05) trial differences in ERSP. Regions of interest are demarcated by black boxes. Colour bar limits are set according to the maximum and minimum values observed for that trial type in any electrode of interest.
Download figure:
Standard image High-resolution image3.4. ERSP in ALS compared to controls
Analysis of the entire time-frequency plane identified significantly reduced beta-band ERD in Fz and Pz during Go and NoGo trials in ALS compared to controls (AUROC values illustrated in figure 3, effect sizes and AUROC values listed in table 1). These findings are in keeping the findings of ANOVA, which identified significant group effect (across electrodes) on beta-band power in this window (p values listed in table 1). This ANOVA also identified significant reduction in Go trial beta ERS (650–850 ms, p = 7.72 × 10⁻⁴) across electrodes, which was predominantly accounted for by Fz, the only individual electrode to show significant difference between groups at post hoc testing (Tukey's p = 0.048). No significant differences between patients and controls were found for the difference between NoGo and Go trial ERSP.
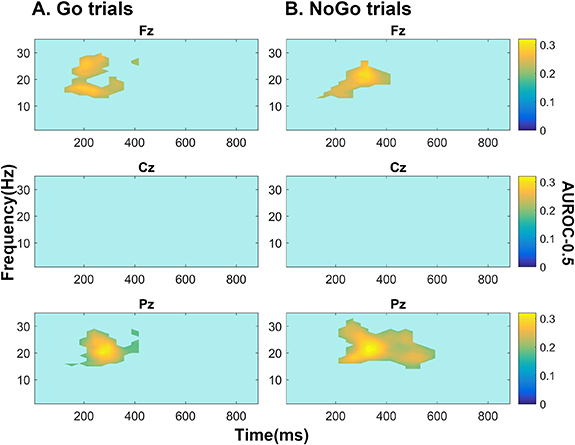
Figure 3. Area under the receiver operating characteristic curve minus 0.5 values for significant ERSP changes in ALS (versus controls) for (A) Go and (B) NoGo trials. All significant findings were of increased power (i.e. ERS) in ALS patients relative to controls. Fz and Pz power (1 − β) = 0.32 and 0.31 and Bayesian Posterior probability (P1) = 0.92 and 0.88 respectively during Go trials and power = 0.18/0.27 and P1 = 0.90/0.88 respectively during NoGo trials. Non-zero values plotted are those deemed significant based on a 5% false discovery rate by testing the full time-frequency plane using empirical Bayesian inference. Colour bar illustrates area under the receivership operating characteristic curve centred around zero (i.e. AUROC-0.5).
Download figure:
Standard image High-resolution imageTable 1. Summary of statistics for significant changes in SART-associated ERD/ERS in ALS patients compared to controls. ANOVA group effect p values are the effect of group on this region of interest for this trial type, across electrodes. Difference between ALS and controls pertains to ANOVA and individual electrode analyses. Cohen's d quantifies effect size (>0.8 denotes large effect size, >1 denotes very large effect size), area under the receivership operating characteristic curve (AUROC) quantifies discrimination between ALS and controls by this measure (>0.8 denotes very good discrimination).
| Frequency range (Hz) | Trial | Time range (ms post stimulus) | Difference between ALS and controls | ANOVA group effect p | Electrode | AUROC | Cohen's d |
|---|---|---|---|---|---|---|---|
| 13–30 | Go | 200–500 | Less ERD in ALS | 5.18 × 10⁻⁴ | Fz | >0.8 | 0.97 |
| Pz | >0.82 | 0.92 | |||||
| NoGo | 200–600 | Less ERD in ALS | 9.71 × 10⁻⁴ | Fz | >0.8 | 0.89 | |
| Pz | >0.82 | 1.12 |
3.5. Correlation with task performance
Correlations between late beta-band ERS in Go (650–850 ms post stimulus) and NoGo (750–850 ms post stimulus) trials and task performance measures are summarised in table 2. Significant negative correlation was identified between response accuracy and late beta band ERS in Pz during Go trials (i.e. poorer accuracy with greater beta ERS) for controls but not patients.
Table 2. Significant correlations between beta-band (13–30 Hz) ERS (%) and SART performance measures. Negative rho values reflect less ERS with larger behavioural measure value (longer reaction time or greater accuracy). Go trials time window—650–850 ms post stimulus, NoGo trials time window—750–850 ms post stimulus. Uncorrected p-values (p) remained significant when corrected at FDR q = 0.05.
| EEG trial | Channel | Behavioural measure | Participant | p | rho |
|---|---|---|---|---|---|
| Go | Fz | Response time | All | 1.18 × 10⁻⁴ | −0.49 |
| Patient | 1.12 × 10⁻⁴ | −0.72 | |||
| Cz | All | 9.22 × 10⁻⁶ | −0.56 | ||
| Patient | 6.19 × 10⁻⁵ | −0.74 | |||
| Pz | All | 9.30 × 10⁻⁴ | −0.43 | ||
| Patient | 9.97 × 10⁻⁵ | −0.72 | |||
| Total % accuracy | Control | 0.011 | −0.44 | ||
| NoGo % accuracy | 0.008 | −0.45 | |||
| NoGo | Cz | Response time | All | 0.0036 | −0.38 |
| Patient | 0.0052 | −0.56 |
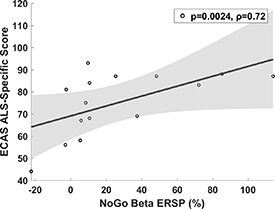
Significant negative correlations between response time and beta-band late ERS in patients and the overall group (i.e. faster response time with greater beta ERS) across the electrodes of interest were present in controls alone as a trend but were not significant following multiple comparison correction. Theta band ERS in Pz during Go trials showed significant negative correlation with response time in the total group (p = 0.010, rho = −0.34) with similar trends when patients and controls were considered separately (patients: p = 0.055, rho = −0.39, controls: p = 0.052, rho = −0.34). Patient, but not control, response times also negatively correlated with Cz alpha band ERSP in NoGo trials (i.e. greater alpha ERD was associated slower response times, p = 0.013, rho = −0.5). Patient ECAS ALS-specific score was correlated with beta ERS (750–850 ms post stimulus, p = 0.0024, rho = 0.72) over Cz during NoGo trials (i.e. greater executive performance with greater beta ERS, figure 4). No significant correlations were identified for other ROIs, disease duration or ALSFRS-R or CWIT scores.
Figure 4. Correlations between ECAS ALS-specific score and ERS over Cz in beta band 750–850 ms post stimulus during NoGo trials. P-value (uncorrected) pertains to non-parametric Spearman's correlation test and was significant at FDR q = 0.05.
Download figure:
Standard image High-resolution image
4. Discussion
We have characterized SART-evoked cortical oscillation changes at sensor level along the frontoparietal axis and have correlated these with task performance. These oscillations relate to the speed and accuracy with which a participant performs the task, and are disrupted in ALS patients.
4.1. SART related spectral perturbations in controls
Beginning at approximately 150 ms post-stimulus, alpha and beta band ERD were observed during both Go and NoGo trials across the frontoparietal axis, in addition to theta band ERS over the frontal lobe (in Fz and Cz), which was greater during correct response withholding. Beta ERD was followed by ERS, which was significantly reduced during correct response withholding.
4.2. Beta oscillations (13–30 Hz)
Motor tasks evoke well-characterized movement-related beta desynchronization (βMRD), beginning in the second before movement onset and peaking during movement performance, followed by movement-related synchronization (βMRS) during movement termination [20, 21]. βMRD is associated with motor planning and execution, while βMRS reflects inhibition of the motor networks to terminate the motor program [22]. Like SART-related beta ERS observed here, βMRS is maximal in Cz and larger in Go trials than NoGo trials, and reaches significance at approximately 800 ms post-stimulus [22]. Similar to the SART, a Go/NoGo task not designed to test sustained attention is also found to elicit beta ERD/ERS during Go and NoGo trials, with Go trial ERS inversely correlating with response time [23]. These similarities indicate that the SART captures this measure of motor cortical activation and inactivation in addition to those of attention and response control.
4.3. Alpha oscillations (8–12 Hz)
Alpha ERD/ERS did not correlate with control task performance in this study, such that the ability to determine the role of this ERD in SART performance is limited. Alpha ERD is associated with thalamocortical network excitation [24] and release of the task-engaged cortical regions from inhibition [25]. This measure has been captured during a number of other attention and memory tasks, and is considered to reflect retrieval of task-relevant information from one's 'knowledge system' [25, 26].
Peri-movement alpha ERD is also observed in Go/NoGo tasks not designed to test attention or memory, and represents a general disinhibition of the motor networks to facilitate movement. In keeping with our observations, this movement-related alpha band ERD (αMRD) generally persists for longer than βMRD and does not typically rebound to synchronization [27]. However, αMRD is not found to be greater during NoGo trials of these tasks [23, 27, 28], as we observed here, while cognitive alpha ERD increases with task complexity. Therefore, this alpha change may not be a purely motor cortical phenomenon and requires further characterization by larger, source level studies to differentiate potential cognitive and motor underpinnings.
4.4. Theta oscillations (4–7 Hz)
Theta band ERS showed significant correlation with SART response time in the overall group, with similar trends within the individual groups that were probably underpowered to detect this effect in each single group. An n-back task study, which also identified frontocentral-predominant theta ERS peaking approximately 250 ms after stimulus delivery, demonstrated association of this ERS with attention allocation, rather than working memory [29]. Further, frontal midline theta, a focal increase in theta power induced by numerous cognitive tasks and localized to the dorsal anterior cingulate and medial prefrontal cortex [30], reflects attentional processing [31]. This is consistent with the presence of theta ERS for all trial types, with greater magnitude during NoGo trials.
4.5. Increasing SART specificity and understanding the speed-accuracy trade-off
Utility of the SART as a test of sustained attention has been criticized due to the extent of performance variation within healthy populations, which has been attributed to the speed-accuracy trade-off [2]. Task performance requires sufficient working memory, attention, response inhibition and motor control, among other functions. Therefore, differences in performance measures such as response time and accuracy may reflect normal or abnormal differences in an array of cortical functions. However, this lack of specificity is advantageous when EEG is recorded simultaneously, as a battery of measures which individually interrogate each of these functions, differentiated by their spatial, temporal and frequency characteristics, can be measured from a single paradigm.
We have previously demonstrated how time-domain analysis of SART-EEG provides individual measures of response control and attention, facilitating identification of specific cognitive and motor functions affected in ALS [3]. Here we have extracted non-phase locked cortical oscillatory changes across time and frequency domains, capturing additional measures of specific network activity and communication that were lost through averaging in our previous analysis and which are not frequency-domain reflections of event related potentials. We have demonstrated that individuals who prioritize speed over accuracy display greater beta ERS during Go trials, potentially reflecting greater post-movement motor cortical inhibition in these individuals. While the causative relationship between this measure of motor cortical deactivation and task approach warrants further investigation, the specificity of this correlation to this ROI within the time-frequency plane facilitates separation of this variation in speed-accuracy trade-off observed in healthy cohorts [2] from other, pathological, changes in cortical networking captured at other times and frequencies, such as those we have identified in ALS.
4.6. Dysfunctional network communication in ALS during the SART
ALS patients showed significant reduction in frontal and parietal beta ERD. βMRD elicited by motor preparation-specific paradigms [32] has previously been shown to be reduced in ALS. This has been proposed to reflect upper motor neurone degeneration, although motor function of the upper extremities does not correlate with βMRD [33, 34]. SART-elicited beta ERD similarly did not correlate with task performance, in alignment with the lack of difference in task response time or accuracy between patients and controls. The lack of significant change in Cz beta ERD in ALS patients observed here also indicates measurement of broader motor network dysfunction beyond the precentral gyrus, such as in the premotor, supplementary motor and posterior parietal cortices. Therefore, while the similarity of this ERD to βMRD suggests that they are of similar (or the same) motor physiological basis, source localisation is required to clarify the specific generators of these oscillations.
Regardless of its physiological origin, the large effect size (Cohen's d = 1.12) and good discrimination (AUROC = 0.82) of ALS patients from controls by beta ERD highlights the need for further exploration of this promising measure as a biomarker of ALS and ALS subphenotypes. Further, as the symptoms of neurodegenerative diseases such as ALS can limit the duration of data collection sessions, the ability of SART to simultaneously elicit a number of distinct measures of motor, motor preparatory and executive function could maximise the efficiency with which cognitive and motor networks are interrogated in both research and clinical settings.
As a group, ALS patients also showed reduced Go trial beta ERS, predominantly over the prefrontal cortex. While the correlation between Go trial beta ERS and poorer response accuracy observed in controls was absent, strong correlations were observed between NoGo trial beta ERS over the motor cortex and executive performance in patients. This correlation, alongside existing literature (described above), may reflect ALS patients with sufficient executive function exerting increased prefrontal control over motor cortex activation to sustain task performance. Patient (but not control) response times were also longer in those with more central alpha ERD in NoGo trials. Together, these findings indicate that sustained performance in patients is achieved through balancing pathological dysfunction with compensatory engagement in cognitive and motor networks. These findings exemplify the utility of EEG in capturing cortical network (dys)function in disease with greater sensitivity and source specificity than task performance measures, which do not emerge until cognitive reserve and alternative neural networks can no longer compensate [35]. However, larger dataset collection is now required to perform comparisons of these measures between clinical, genetic and disease stage ALS subcohorts and facilitate further interrogation of the relationship between this cortical pathophysiology and cognitive and motor symptom severity with higher statistical power. Further, the pathological or compensatory roles of ERSP in ALS require further elucidation through longitudinal and source level analyses.
4.7. Limitations
This analysis focussed on three electrodes of interest across the frontoparietal axis in order to simultaneously investigate previously unexamined SART-associated cortical oscillations and perform preliminary screening for potential ALS biomarkers. Spatial resolution of these findings is poor. Therefore, while they capture the activity of important generators of SART response across primary motor, pre-motor and supplementary motor areas (in the motor domain) and prefrontal and parietal generators (in the cognitive domain), our ability to attribute different ERSP to specific cortical regions is limited. Source-localised analysis will be needed in a future study to elucidate the sources of abnormalities in cognitive oscillations across the cortex, informed by a dense electrode montage, and potentially increase the discriminative ability of these measures in detecting ALS. Expansion of the datasets shall facilitate further interrogation of the relationships between these measures of cortical pathophysiology and disease stage, rate of progression and symptom severity.
5. Conclusion
Our data demonstrate that time-frequency analysis of EEG during SART, in addition to event related potential analysis, provide measures of cognitive and motor network function that may not be captured by behavioural performance or by other neuropsychological testing. These measures help to dissect the summated complex interactions within and between the cortical networks which regulate task performance, including speed-accuracy trade-off strategy and compensation for pathology. Moreover, we demonstrate that cortical oscillation abnormalities not captured by task performance measures have large effect sizes and show good discrimination between ALS patients and controls. Such discrete measurements may provide informative, sensitive biomarkers of disease-related network dysfunction and warrant further investigation.
Acknowledgments
The authors report no conflicts of interest which would bias the conduct of this study. This study was funded by the Irish Research Council [IRC, Grant Numbers: GOIPG/2017/1014, GOIPD/2015/213], the Health Research Board [HRB, Grant Numbers: HRA-POR-2013-246, MRCG-2018-02], Science Foundation Ireland [SFI, Grant Number: 16/ERCD/3854] and Research Motor Neurone [Grant Number: MRCG-2018-02]. Additional psychology data for participants of the study were collected with support of the Motor Neurone Disease Association [MNDA, Grant Number: Hardiman/Oct15/879-792]. We thank the Wellcome-HRB Clinical Research Facility at St. James's Hospital in providing a dedicated environment for the conduct of high-quality clinical research. Finally, we would like to thank all the patients, participants and their families who volunteered to take part in this study.
Ethical statement
This study was ethically approved by St. James's Hospital (REC reference: 2017-02 Chairman's Action 18). All participants gave written, informed consent in advance of participation. The study was performed in accordance with the Declaration of Helsinki.
Author contributions
R M, B N, O H, N P, R R—Conception and design of the study. R M, S D, M P-G, E C, A F, T B, M H, O K—Acquisition of data. R M—Analysis of data. R M, B N, O H—Drafting of manuscript or figures.