

Abstract
Objective. Brain–computer interface (BCI) technology enables people to use direct measures of brain activity for communication and control. The National Center for Adaptive Neurotechnologies and Helen Hayes Hospital are studying long-term independent home use of P300-based BCIs by people with amyotrophic lateral sclerosis (ALS). This BCI use takes place without technical oversight, and users can encounter substantial variation in their day-to-day BCI performance. The purpose of this study is to identify and evaluate features in the electroencephalogram (EEG) that correlate with successful BCI performance during home use with the goal of improving BCI for people with neuromuscular disorders. Approach. Nine people with ALS used a P300-based BCI at home over several months for communication and computer control. Sessions from a routine calibration task were categorized as successful ( 70%) or unsuccessful (<70%) BCI performance. The correlation of temporal and spectral EEG features with BCI performance was then evaluated. Main results. BCI performance was positively correlated with an increase in alpha-band (8–14 Hz) activity at locations PO8, P3, Pz, and P4; and beta-band (15–30 Hz) activity at occipital locations. In addition, performance was significantly positively correlated with a positive deflection in EEG amplitude around 220 ms at frontal mid-line locations (i.e. Fz and Cz). BCI performance was negatively correlated with delta-band (1–3 Hz) activity recorded from occipital locations. Significance. These results highlight the variability found in the EEG and describe EEG features that correlate with successful BCI performance during day-to-day use of a P300-based BCI by people with ALS. These results should inform studies focused on improved BCI reliability for people with neuromuscular disorders.
Export citation and abstract BibTeX RIS
1. Introduction
The National Center for Adaptive Neurotechnologies (NCAN) and Helen Hayes Hospital support long-term home use of BCI-24/7, a P300-based brain–computer interface (BCI), by people with amyotrophic lateral sclerosis (ALS). Once a candidate with ALS demonstrates proficiency, the device is installed in their homes and used for basic communication (e.g. typing messages for caregivers, e-mail, internet browsing) on a regular basis over months and years [1, 2]. While autonomous use of the BCI is not monitored, calibration data are routinely collected, transferred, and inspected offline to ascertain system and classifier reliability. Despite periods of successful use, these calibration data indicate home users can experience substantial variations in BCI performance within and across days [1, 3, 4]. Such performance variations can be frustrating to the user and limit the overall practicality of the system. To date, analyses have failed to adequately characterize the variation in BCI performance not accounted for by BCI system failure including signal quality [5, 6]. While day-to-day variability can be attributed to inherently non-stationary nature of electroencephalogram (EEG), these variations represent more profound non-stationarities in pathological neural signals relative to the normal signals [3, 7, 8]. These variations are also not well correlated with system reliability issues, e.g. high impedance. Within past several years, studies reported pathological changes beyond the primary motor areas in patients with ALS [9–11]. Considering the inherent associations of EEG responses utilized for the operation of this BCI, these cognitive factors may have an effect on BCI performance during practical use [12].
To date, no study has addressed the neural correlates of day-to-day BCI performance variations in people with ALS. The purpose of this study is to identify and evaluate EEG features that significantly correlate with performance on the routine calibration task associated with independent home use of the BCI-24/7. Data were collected from nine users with moderate to severe ALS while they operated the BCI independently for up to 10 months. Conventional EEG features including spectral band power and event-related potential peak amplitudes were examined to draw inferences to known functional correlates like cognitive processing [13] and drowsiness [14]. While a few longitudinal BCI studies have been conducted with people with ALS in a home environment [1, 2, 15], most have been carried out either in a laboratory environment or under expert supervision [16, 17]. BCI researchers have not yet established whether BCI technology can be of practical value to those in need [18]. The data set examined here represents EEG recordings made during long-term, and self-directed BCI use. Thus, these data should provide insight into BCI in practice.
Improved understanding of the mechanisms of successful P300-based BCI use should lead to better methods and more reliable BCI use for people with ALS whose vision is not compromised [19–22]. These insights can lead to methods that help identify suitable candidates for long-term P300-based BCI operation, or inform users about their BCI readiness on a given day. Such information may save significant time, effort, and frustration for users and caregivers; and may thereby improve BCI performance and increase satisfaction.
2. Materials and methods
2.1. BCI-24/7 system
The BCI-24/7 home system relies on the P300 Speller Application of BCI2000 software [23], associated hardware and an eight-channel electrode cap. Its application package comprises the Diagnostics, a system set-up program for the system assistant (SA), and a main menu for the BCI User. The Diagnostics checks hardware and software connections, assists with cap selection and placement, visualizes electrode impedances during gel application, and displays the digitized EEG signals. The main menu includes applications for communication (e.g. WordPad, e-mail with word-prediction, print and speech outputs), entertainment (e.g. an Internet RSS reader and You-Tube), and a copy-spelling calibration task (see [2] for more details). BCI-24/7 is designed to be managed by the SA, i.e. a caregiver or family member, after training. The SA is trained to place the cap, start the system for the BCI User, and perform minor trouble shooting. When the BCI User is finished using the BCI, she or he selects the icon to end the session and the SA exits the software and removes the cap.
2.2. Users
The nine users with ALS were referred for BCI evaluation by the Center for Rehabilitation Technology (CRT) at Helen Hayes Hospital or were self-referred. The users were studied in their homes for a period of two–ten months while operating the BCI-24/7 system independently [1, 2]. Table 1 shows demographic and related information for all users. Users' ALS revised functional rating scale (ALS-FRS-R) scores ranged between 0 and 32 (median =12, std =12.83) on a 48-pt scale [24], where 48 represents normal function and 0 represents complete loss of function. All studies were approved by the Institutional Review Boards of New York State Department of Health and Helen Hayes Hospital; and all BCI users provided informed consent or assent for the study.
Table 1. Information on BCI use. Successful runs are defined as runs having an accuracy  70%. The performance range is the accuracy range over all runs.
| User | 1 | 2 | 3 | 4 | 5 | 6 | 7 | 8 | 9 |
|---|---|---|---|---|---|---|---|---|---|
| BCI use (months) | 2.5 | 5 | 2.5 | 2.5 | 5 | 2 | 10 | 9 | 5 |
| Successful/total runs | 62/127 | 48/65 | 45/52 | 39/51 | 34/49 | 19/29 | 29/60 | 49/83 | 28/36 |
| Performance range (%) | 0–100 | 10–100 | 30–100 | 0–100 | 30–100 | 30–100 | 0–100 | 0–100 | 0–100 |
2.3. Data acquisition
EEG data were recorded with eight tin electrodes mounted in an elastic cap (Electro-Cap International) placed at locations Fz, Cz, P3, Pz, P4, PO7, PO8, Oz [8]. The EEG was amplified using a g.USBAmp amplifier (g.tec Medical Technologies), digitized at 256 Hz, band-pass filtered at 0.5–30 Hz, and notch filtered at 58–62 Hz. All recording channels were referenced to the right mastoid and grounded to the left mastoid. All data acquisition, real-time signal processing, and feedback processes were controlled using a modified version of BCI2000 [23].
The trained SA inspected signal quality using two dynamic displays in the diagnostics: a color-coded tool for impedance levels (<40 k acceptable) and a display of the digitized EEG signals. All signals were inspected by the SA for environmental, mechanical, and physiological artifacts [18]. Intractable artifacts resulted in a call to Wadsworth Center for technical support.
While data quality depended on environmental conditions in the home and the trained SA, the BCI-24/7 settings favored stable EEG recordings (bandpass filtered from 0.5 Hz to 30 Hz with a 58–62 Hz notch filter), i.e. low and high frequency artifacts such as from movements and line noise, were largely absent. Impedances measures of 40 k were set as the acceptable upper limit. Thus, electrode impedances up to 40 k
 were included in the present analysis. To verify that BCI performance was not implicitly linked to the impedance values in this data set, a two-sample t-test was performed on the individual electrode impedances from unsuccessful and successful runs for each subject. No statistically-significant higher impedance was found for the unsuccessful runs compared to the successful runs for any subject [25]. Additionally, the data discussed here were visually inspected for record quality. Records with significant artifacts were excluded from the analysis.
2.4. Task and procedure
Users operated the BCI independently in their own homes over a series of months. They completed a brief copy-spelling/calibration task on a daily or weekly basis [1, 2]. Each instance of this task is known as a run. The average number runs for all users is 61 runs (range 29–127 runs), as listed in table 1. For each run, the user was seated upright in a comfortable reclining bed, chair, or their own wheelchair at a comfortable viewing distance (i.e. 90 cm) from the monitor. The user viewed an  matrix containing alphanumeric characters and symbols that flashed using the checkerboard paradigm (CBP) [26].
Users were asked to attend to a predetermined sequence of target characters and silently count the number of times each target character flashed. The number of prescribed characters varied between 10–20 for each run. Each character in turn was shown in parentheses at the end of the word as it became the target. After 4 s, the character in parentheses began to flash in groups of 4, 5 or 6 characters with no two items in a group adjacent to each other (i.e. the checkerboard (CB) format [26]). A group flashed every 125 ms (8 Hz flash rate), and the number of flashes varied across users for each selection. After each flash sequence, the EEG data was classified through a stepwise linear discriminant analysis (SWLDA) using no fewer than 70 selections (980 target flashes) collected during at least two evaluation sessions as detailed in [8]. Through a combination of forward and backward stepwise regression procedure, the most statistically significant predictor variables (p < 0.1) were selected and the least significant variables (p > 0.15) were removed. This procedure was repeated until the maximum number of features (i.e. 11 in this study) was reached, or until no additional terms satisfied the entry/removal criteria. Character-selection rate [26] was optimized at system installation and the calibration coefficients were tested against the new copy-spelling data at approximately weekly intervals. In our study, online feedback of the character selected by the classifer was provided directly below the prescribed character. The online performance of each run was determined based on the number of correctly selected characters divided by the total number of characters in that run. The spectral and temporal features for each run were computed as described below.
2.5. Data processing
2.5.1. EEG power spectra.
The power spectrum for each run was calculated using the 256-point Welch's method with a window length of 1 s and 0.5 s overlap, resulting in 1 Hz frequency bins. The average power in five frequency bands was then computed using traditional bands: delta (1–3 Hz), theta (4–7 Hz), alpha (8–14 Hz), low-beta (15–18 Hz), and high-beta (19–30 Hz). The spectral feature space resulted in a matrix of N  40 (five spectral features
  eight channels), where N is the total number of runs for each user. To visualize the EEG power spectra across users, the power of each user's spectrum was normalized to a maximum value of 1 by dividing the power at each frequency bin by the maximum power value across the user's spectrum.
2.5.2. ERP components.
The target responses were extracted 0–750 ms post-stimulus. The mean of each response was removed and all responses from each run were averaged, resulting in 193 temporal amplitude features for each channel and run per user. To investigate the correlations between characteristic ERP components and online performance, N100 and N200 amplitude components were defined as the minimum peaks between 80–170 ms and 220–350 ms respectively, while the P200 and P300 amplitude components were defined as the maximum peaks between 190–275 ms and 276–500 ms periods, respectively. The late negative component from 500–700 ms was also evaluated to cover the majority of the response window. This resulted in a temporal feature matrix of N  40 (5 temporal components
  8 channels) for each user. For visualization of the average ERPs across users, the amplitude of each user's ERP was normalized to have a maximum value of 1 by dividing the amplitude at each time point by the maximum absolute value of the user's ERP.
2.5.3. Correlations and statistical analysis.
Pearson's correlation coefficients were computed between the online accuracy and each feature (temporal and spectral) across all runs for each user. In order to represent the significant positively and negatively correlated features across users, the correlations corresponding to p  0.05 (Bonferroni corrected by the number of channels which results in 0.05/8 = 0.0063) were set to zero as not significant, and the significant positive and negative correlations were set to 1 and −1, respectively. It was observed that the respective polarities of the significant correlations were consistent across users for all features; thus, there is no ambiguity when averaging the thresholded correlations across users. This average indicates the proportion of users for which each feature was significant at a given electrode location. Because of the imbalance in the number of successful and unsuccessful runs, as well as the total number of runs for each user, a bootstrapping procedure was used to test for significant differences in the feature values between successful and unsuccessful runs. For each subject, seven unsuccessful runs and 19 successful runs (corresponding to the minimum and maximum number of unsuccessful and successful runs across subjects, respectfully) were randomly sampled. For each feature, the means of the two groups were computed across subjects and the difference of the group means was calculated. This process was repeated 1000 times to create a distribution. The difference in means was determined to be statistically significant if confidence interval does not contain zero, where the confidence interval was set at alpha =0.05 (Bonferroni corrected by number of channels). As a more categorical evaluation of performance, runs with actual online accuracies
  70% were labeled as successful and all other runs were labeled as unsuccessful [5, 27].
3. Results
3.1. Performance variations
Figure 1 presents performance variations across different days of six representative users. The y -axis reflects the classification accuracy and the x-axis shows the number of days after the initial BCI session. The vertical bars for a single day indicate the range of performance variation over all copy-spelling runs for a single day, from minimum to maximum performance. The red dashed line indicates the linear performance trend. The linear performance trends are relatively flat with some users exhibiting positive and negative slopes, respectively. Notably, some days exhibit substantial performance variations, while other days show little or no variation. An ANOVA analysis indicated that within and across day variability was user specific (p <0.05). Furthermore, daily range of performance differences could also vary drastically from day to day.
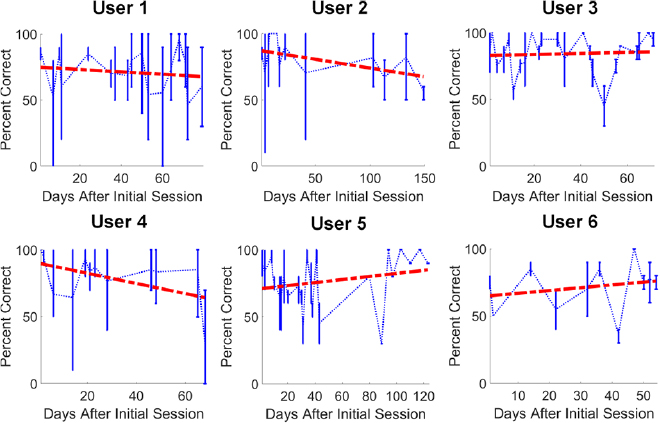
Figure 1. Performance variations for six representative users. The y -axis presents classification accuracy (as % correct), and the x-axis presents the number of days after the initial session. Each connected data point indicates the mean accuracy for one day. The vertical bars reflect the minimum and maximum performance for that day. Data were not available for the days without vertical bars. The red dashed line indicates the linear performance trend over time.
Download figure:
Standard image High-resolution image3.2. Performance correlations with frequency bands
Figure 2 shows topographies of the thresholded correlation values (i.e.  1) averaged across users. The color scale represents the average thresholded significant correlations between online accuracy and the respective spectral power across all the subjects. The correlations corresponding to p
  (with Bonferroni correction) were set to zero as not significant, and the significant positive and negative correlations were set to 1 and −1, respectively. The average was then computed across all the users. Eight of nine users had significant positive correlations between the alpha band and performance at channel PO8, with an average significant correlation coefficient of 0.46. Over half of the users also showed significant alpha-band correlation with performance at channels P3, Pz, P4 and Oz, with average significant correlation coefficients of 0.39, 0.41, 0.41 and 0.46, respectively
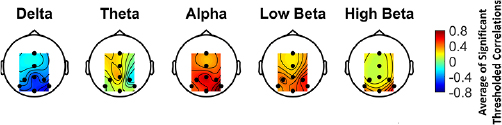
Figure 2. Average topographies of significant thresholded correlations between online accuracy and spectral power. The correlations corresponding to p  (with Bonferroni correction) were set to zero as not significant, and the significant positive and negative correlations were set to 1 and −1, respectively.
Download figure:
Standard image High-resolution imageDelta-band activity was negatively correlated with performance over channels Pz, P08, and Oz in over half of the users with average significant correlation coefficients of  , and −0.47, respectively. Over half of the users showed significant positive correlations in the low-beta band at P4 and P08, and in the high-beta band at PO8.
3.3. Performance correlations with temporal ERP components
Figure 3 shows the thresholded correlation between performance and the 5 temporal ERP components. Over half of the users had a significant positive correlation between P200 maximum peak amplitude over channels Fz and Cz with average significant correlation coefficients of 0.5 and 0.48, respectively. Consistent significant correlations between the N100, N200, P300, or the 500–700 ms components and performance were generally not observed for any channel.
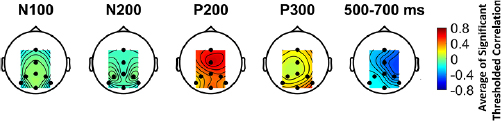
Figure 3. Average topographies of significant thresholded correlations between online accuracy and N100, N200, and 500–700 ms minimum peak amplitude and P200 and P300 maximum peak amplitude. The correlations corresponding to p  (with Bonferroni correction) were set to zero as not significant, and the significant positive and negative correlations were set to 1 and −1, respectively.
Download figure:
Standard image High-resolution image3.4. Waveforms and spectra for successful and unsuccessful runs
Figure 4 shows the normalized spectral power amplitude averaged over all users for each channel. The solid bars indicate the statistically significant differences for each frequency band, as determined by the bootstrapping procedure described in the methods. Delta-band power is significantly greater for unsuccessful runs compared to the successful runs for all channels except Fz. In contrast, alpha- and low beta-band power is significantly lower for the unsuccessful runs relative to successful runs for all channels, and high beta-band power for all channels except Fz and Pz. No significant differences were observed in the theta band.
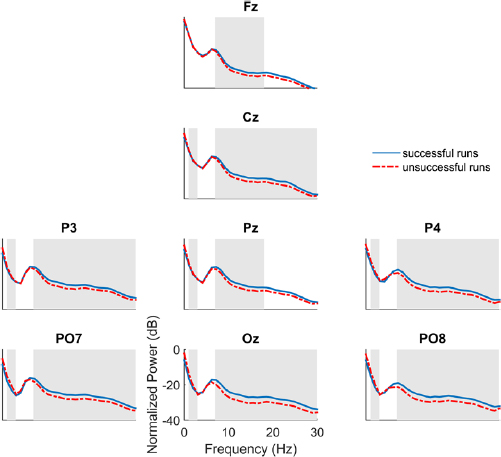
Figure 4. The normalized power spectra for successful (blue) versus unsuccessful (red) runs averaged over all subjects. The solid gray bars indicate the statistically significant features (p <0.05, with Bonferroni correction).
Download figure:
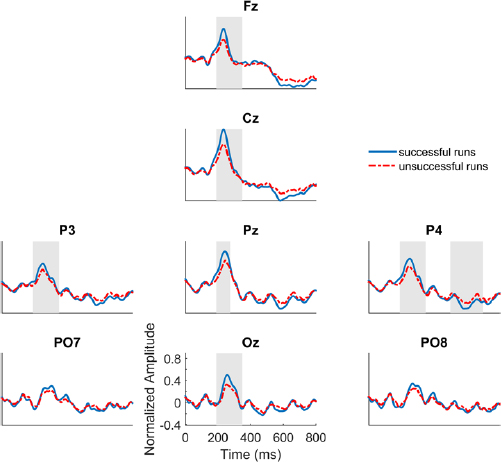
Standard image High-resolution imageFigure 5 shows the normalized target ERPs for successful and unsuccessful runs averaged across users. The solid bars indicate the statistically significant differences for each ERP component, as determined by the boostrapping procedure. These results show a distinct positive peak around 220 ms in most channels (median =220.66, std =7.84 at Fz and median =223.63, std =6.79 at Cz), with higher amplitude in successful runs compared to unsuccessful runs. This P200 difference is statistically significant for all channels except PO7 and PO8. The N200 difference is statistically significant at Fz, Cz, P3, P4, and Oz. There is a difference in the negative peak around 550 ms on most channels, although this late 500–700 ms component is only significant at P4. It should be noted that conventional ERP response windows were implemented to compute the features and statistics, which may be adjusted to better capture the peak latencies observed these unique responses.
Figure 5. The normalized target ERPs for successful (blue) versus unsuccessful (red) runs averaged over all subjects. The solid gray bars indicate the statistically significant features (p <0.05, with Bonferroni correction).
Download figure:
Standard image High-resolution image
4. Discussion
P300-based BCI home users with ALS can exhibit substantial performance variations within and across sessions. Increased alpha-band power and decreased delta-band power generally reflect improved performance. Specifically, alpha-band activity showed significant positive correlation at PO8 for 89% of the users and at P3, Pz, P4 for over 50% of the users. Over 50% of the users also showed significant negative correlations between delta band activity and performance over Oz, Pz, and PO8. Successful runs were also significantly positively correlated with ERP amplitude activity around 220 ms over several channels.
Within past several years, characterizing neural markers of ALS have led to investigations into cognitive issues which indicate that neural degeneration not only results in motor dysfunctions but also leads to cognitive impairments including attentional deficits [28–30]. Such deficiency occurs in as many as 50% of the affected individuals and negatively affects BCI performance [31, 32]. Thus, to facilitate the BCI use for all type of patients, cognitive signatures need to be incorporated into BCI system design. Our current analyses of spectral and ERP activity help elucidate cognitive neural functions during a focused attention task in ALS patients. These analyses, in tandem with other studies, may also encourage developments that improve performance during real-time BCI use or offline adaptations that account for cognitive status of the user. These include advanced signal processing and classification algorithms, improved spatial approaches, neuromodulation techniques to enhance user's cognitive functionalities, analysis approaches based on single-trial dynamics, and changes to user-interface and task parameters.
Performance variations may also reflect changes in motivation, implying that assessment of users motivation and methods to motivate users could improve performance [16, 33]. One of the limitations of this study is that we did not parametrically assess users' motivation. Since home use is not mandatory, presumably our participants wanted to use the system at the time they did. However, future home studies could incorporate brief surveys providing vital information that might explain some of the observed activity. Our analyses could support this important future research direction, and could even be of value without them. The obtained key features correlated with BCI performance (i.e. alpha, delta, and P200 amplitude) could potentially be used in a model to screen for readiness prior to BCI sessions. However, further work is needed to develop and test the such a model in a real-world setting. While this study did not focus on evoked power, non-phase locked evoked power in low frequency components (i.e. theta) is a potential extension of the present work. In another study, we showed non-phase locked theta increase and phase locked theta decrease are associated with unsuccessful runs in ALS patients performing a P300-BCI task [34]. While phase-locked theta power decrease can be attributed to ERP amplitude decrease in unsuccessful runs, a theta increase can be associated with the realization of uncertainty, response conflict, the need for behavioral change, or adaptation [35]. Another limitation of our study is a lack of dedicated resting-state recordings. Previous studies have shown that EEG features recorded during the resting state [36, 37] as well as those recorded during the task associated with cognitive functions (i.e. attention and working memory) [12] can be critical to the BCI performance. Thus, future studies might benefit from including both spontaneous and task-induced responses.
The literature now provides several reports of independent use of an EEG-based P300 BCI system indicating that there is stable performance over time. Sellers et al (2010) reported a median accuracy of 83% during independent use of an EEG-based P300 system for one BCI user over two and a half years [1]. In a similar fashion, Wolpaw et al (2018) reported an average accuracy of 73% (std =11%) from 14 users [2]. The data used in our analyses reflect unsupervised BCI use by people with ALS. There were no requirements beyond the collection of routine calibration data to confirm optimization. Our finding of variations within and across days likely reflects a granularity that these studies did not address. Future studies that include additional requirements during BCI independent use will no doubt provide insight into both user and device.
In general, BCI performance prediction for both within and across sessions, can help users decide whether to start, continue, postpone, or end a BCI usage session. Users might wear more convenient EEG sensors that could monitor key features and predict when communication is most or least feasible. Also, since each BCI session requires early calibration and testing, key features could be extracted and analyzed quickly to assess whether the upcoming communication session is poor or not. In addition to predicting ideal performance sessions, results could also improve classification performance. Conventional classification approaches could improve if they better incorporated phasic data and unique waveforms across different sessions and adapted themselves based on patients' demands considering their characteristics and disease progression [38]. Thus, future work must be done to examine how the EEG features and BCI performance vary with patients' features. The incorporation of such information into state-of-the-art BCI models can open new avenues for the future advancement of BCIs for a practical communication and control. While the methods and materials in this study are easily transferable to other real-world BCI research and usage activities, the key features presented here might be adapted to other modalities [20, 39–42] and be analyzed along with data from other sensor mechanisms [21, 22].
As noted above, the approach used here relied on visual stimuli. This may raise two concerns: (1) BCIs based on vision are not practical for patients without adequate vision; and (2) the visual-based methods here might not transfer well to other modalities. The first concern is not without merit, and it is agreed that non-visual BCIs should be explored further. However, the data in this study were collected in real-world settings with patients, who could use the visual modality. Therefore, BCIs based on visual stimuli are useful for some patients, although not all of them. The second concern is not supported by recent literature. Many groups have shown that BCIs based on tactile and/or auditory stimuli can provide communication for patients without vision [39, 41]. These BCIs rely heavily on methods used in visual BCIs. The approaches described here might be adapted to predict and improve BCI performance with persons who use non-visual BCIs for extended periods, including the emerging group of persons with disorders of consciousness who require a BCI for basic communication and control.
Overall, this study explored correlations between BCI performance and post-processed power spectra and ERP components. The results could lead to improved long-term BCI reliability through the development of new methods to identify user-specific optimal BCI parameters, predict and adapt to performance variations, and better understand brain function in persons with ALS.
Acknowledgment
Research supported by the National Science Foundation (1064912, 1421948), the National Institutes of Health (1P41EB018783 (NIBIB), HD30146 (NCMRR, NICHD) & EB00856 (NIBIB, NINDS).