


Abstract
The stability of induced junction silicon photodiodes used to construct the predictable quantum efficient detector (PQED) has been studied over a time period of a decade by measurements of its spectral responsivity against absolute cryogenic radiometers (CR) in two independent laboratories at CMI and PTB. PQEDs operated at room temperature show a long-term temporal stability within 150 ppm over a broad spectral range during a 10-year period, well within the range of the claimed measurement uncertainty values of the CRs. This long term stability fulfills one of the fundamental requirements to establish a new primary standard for the measurement of power of optical radiation.
Export citation and abstract BibTeX RIS

Original content from this work may be used under the terms of the Creative Commons Attribution 4.0 licence. Any further distribution of this work must maintain attribution to the author(s) and the title of the work, journal citation and DOI.
1. Introduction
The predictable quantum efficient detector (PQED) has been developed by a joint European effort in the framework of the EURAMET iMERA+/EMRP programs (Sildoja et al 2013) (Muller et al 2013). The PQED consists of two custom-made induced junction silicon photodiodes in a wedge trap configuration. The most notable property of this type of detector is that within 0.02% its external quantum efficiency (EQE) in the spectral range from 450 nm to 850 nm is dependent only on fundamental constants. The PQED is therefore an ideal candidate for a new primary standard for optical radiometry in the visible range (Donsberg et al 2014).
When the analysis of PQED responsivity is refined to include specular reflectance of the detector and calculated charge-carrier losses within the induced junction photodiodes, the predicted responsivities have uncertainties of about 0.01% at 95% confidence level (Sildoja et al 2013). It is straightforward to measure the specular reflectance of the PQED, but determination and monitoring of charge-carrier recombination losses is a more challenging task (Gran et al 2012) (Tran et al 2022). The inversion layer photodiodes are fabricated by growing a thick (100–300 nm) layer of silicon dioxide on top of a p-type silicon wafer (Hansen 1978) (Zalewski and Duda 1983). In general, photodiodes made of p-type silicon are reported to show more stable spectral responsivity than photodiodes made of n-type wafers when inversion layer, phosphorus diffused (p-type), or boron diffused (n-type) photodiodes were fabricated in similar conditions (Korde and Geist 1987). The reasons for this difference were suspected to come from lower sensitivity to moisture and from the built-in field close to the oxide-silicon interface that minimizes the time that photogenerated minority carriers spend near the interface in p-type silicon.
We address the stability of the charge-carrier recombination losses in induced junction photodiodes made of p-type silicon by accurately measuring the spectral responsivity of PQEDs at multiple wavelengths over a long period of time. Considerable effort has been spent to validate the absolute value of the PQED spectral responsivity against the current standard for optical radiometry, the cryogenic radiometer (CR), with standard uncertainty close to 0.01% and below (Muller et al 2013). Here the results obtained after 2013 are combined with earlier results and conclusions are drawn from the available data.
2. Measurements
This stability study concerns four selected PQEDs equipped with 8 p-type photodiodes manufactured during the iMERA European project Qu-candela. In the framework of this project two photodiode production batches were manufactured including photodiodes with different thermally grown silicon oxide thickness: 100 nm, 220 nm and 300 nm. The photodiodes with thickness above 200 nm provided the best performances in terms of measured spatial uniformity of response and low spectral reflectance as reported in (Sildoja et al 2013). The PQEDs under investigation in this manuscript are equipped with photodiodes with 220 nm and 300 nm oxide thickness.
The PQED's EQE at a vacuum wavelength λ0 is the ratio between the PQED measured responsivity at λ0 and the responsivity of an ideal lossless photodiode that converts all photons of wavelength λ0 in electron–hole pairs and it is given by the equation (Muller et al 2013):
where R m ( λ 0) is the measured PQED spectral responsivity at the vacuum wavelength λ0 and e, h, c are fundamental constants. The spectral responsivity of four PQEDs have been measured. One PQED by the Czech Metrology Institute (CMI) and other three PQEDs by the Physikalisch-Technische Bundesanstalt (PTB) against CRs over a period of about ten years: starting from about one year after the photodiode manufacturing in 2011 to the current date. The measurements are performed with the highest level of accuracy on a set of laser lines covering the visible spectral range: 476 nm, 532 nm, 568 nm, 647 nm, 760 nm, 800 nm and 850 nm. To reduce dust contamination on the photodiodes the PQEDs are kept in dust free environment when stored and purged with a dry nitrogen gas when the PQEDs are used. All measurements reported have been carried out with the PQEDs at room temperature.
2.1. PTB facility
The cryogenic-radiometer-based calibration facility of PTB is shown schematically in figure 1. It has been designed and set up to achieve lowest possible uncertainties for the spectral responsivity calibration of semiconductor detectors by avoiding and reducing main uncertainty contributions such as, e.g., those caused by stray light and the determination of the transmittance of the Brewster window (BW). The power-stabilised laser radiation enters the setup through the common BW. The CR and the detector under calibration (DUC) are mounted on a swivelling table with a vertical swivel axis to move either the CR or a DUC behind the common BW into the laser beam. The DUC can be a PQED as well as a common reflection or transmission trap detector mounted in the detector chamber (D). CR and the DUCs are positioned on the swivelling table in a way that the distances of their apertures to the swivel axis are almost identical. Therefore, they are at a nearly identical position behind the fixed BW when they are moved into the beam. Thus, a window-correction-free and distant-error-free setup is realised. To further reduce the effect of stray light, the DUCs are equipped with apertures having the same diameter as the aperture in front of the absorber cavity of the CR. Hence, the remaining effect of stray light on the calibration result depends on the small difference between the aperture areas and the stray light level near the edges of the circular apertures and can be corrected. To measure the stray light a detector consisting of a large area Si 10 mm × 10 mm photodiode behind an annular aperture is positioned concentrically to the laser beam and in the same distance to the BW as CR and DUC. The measured stray light in the vicinity of the aperture edges is used to determine the correction and uncertainty contribution arising from the stray light (Werner et al 2014). Thus, mainly by reducing or avoiding the uncertainty contributions arising from stray light and BW, the total relative standard uncertainty of the spectral responsivity measurement could be reduced within the range from 25 ppm to 40 ppm (Muller et al 2013).The following power-stabilised lasers were used in the calibrations reported here: Kr ion laser, frequency-doubled Nd:YAG laser, semiconductor laser, Ti:sapphire lasers. The laser vacuum wavelength was measured with an uncertainty better than 1 pm. The calibrations were performed at a laser power of about 100 μW and by applying a reverse bias voltage of 5V to the PQEDs. Before each calibration the PQED was aligned in such a way that the incident laser beam and the weak beam reflected by the PQED were collinear. The calibrations were performed at the centre position of the effective sensitive area of the PQED. The centre position was determined by scanning the detector through the beam in vertical and in horizontal direction to determine the detector positions for which the measured signal was reduced to half the maximum signal. The arithmetic mean of the two positions of half-maximum signal for one direction was used as the respective centre position for this direction.
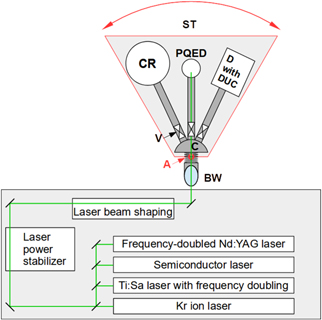
Figure 1. Scheme of the cryogenic-radiometer-based calibration facility of PTB: the CR and the DUC, being a PQED or a common trap detector located in the detector chamber (D), are mounted on a swivelling table (ST) with a vertical swivel axis (A) to move either the CR or a DUC behind the common BW into the laser beam. The tubes connecting the distribution chamber C and the CR or the DUC are equipped with valves and can be evacuated or filled with air. Thus, DUC operated in vacuum or air and the CR operated in vacuum can be irradiated through the common BW.
Download figure:
Standard image High-resolution image2.2. CMI facility
The CMI CR facility uses a spatially filtered Kr laser beam stabilised by feedback controlled Pockels cell to irradiate alternately the PQED under test and the CR absorbing cavity. A BW is placed only in front of the CR cavity and therefore the relative optical losses in the BW have to be measured. Since the PQED and CR cavity are placed at different distances, the laser beam stray light must be minimized to negligible level by good beam shaping and proper spatial filtering. The laser beam is about 3 mm in diameter. The stray light on the cavity plane is measured by a Si quadrant photodiode that is placed on the cavity entrance aperture. The laser power impinging the CR's cavity and the PQED ranged between 150 μW to 300 μW. The PQED photocurrent is converted to voltage by a calibrated transimpedance amplifier (TIA) equipped with a 1 KΩ feedback resistor. A bias of 10 V is applied to the PQED to extend its linear operational range at these power levels (Salffner et al 2018). The PQEDs under test are placed on a manual Gimble for pitch and yaw angular adjustment and on vertical and horizontal motorized stages. First the PQED back reflected beam is manually aligned with respect of the incoming laser beam. Then a series of two automatised horizontal and vertical scans that include the full PQED sensitive area are performed with a step of 100 μm. The PQED horizontal and vertical middle position is determined as the centre of the mass of the horizontal and vertical scans signal respectively. The same scans' data is used to quantify the uniformity of the PQED around the middle point that for most of the laser wavelengths values used during its calibration has been measured to be better than 50 ppm mm−1. The laser vacuum wavelengths that are used by CMI to cover the visible spectrum are: 476.4 nm, 568.4 nm, 647.3 nm, 752.8 nm and 799.5 nm. Each laser vacuum wavelength is measured by a calibrated wave-meter with uncertainty better than 1 pm (figure 2).
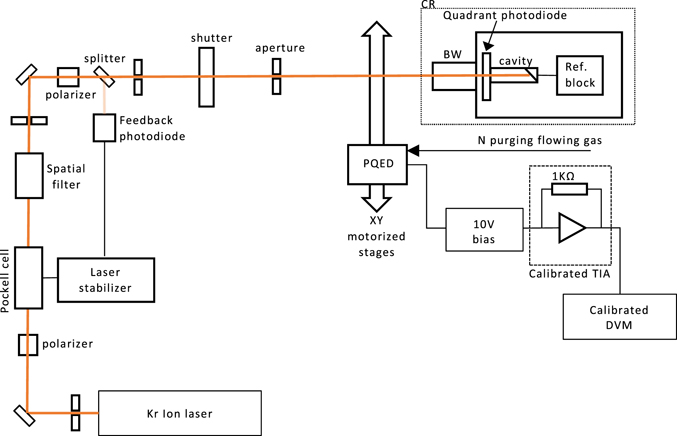
Figure 2. CMI facility schema.
Download figure:
Standard image High-resolution image3. Results
The measurement results of the PQEDs' EQE by each laboratory are reported in the tables below. They cover a time period of about eight years each. The values are reported with their associated total expanded uncertainty (k = 2). It is important to notice that the measurements were performed on four distinct PQEDs. The latest measurements were performed in CMI at the end of 2020. The higher uncertainty value for the wavelength of 799 nm is mostly caused by the measurement of the optical losses due to the cryogenic radiometer's BW (tables 1–4).
Table 1. PQEDs' EQE value measured in PTB.
| Wavelength/nm | 2011 | 2014 | 2015 | 2016 | 2018 |
|---|---|---|---|---|---|
| 476.4 | 0.99990 ± 0.00007 | 0.99996 ± 0.00006 | |||
| 531.0 | 0.99990 ± 0.00005 | 0.99994 ± 0.00007 | |||
| 532.1 | 0.99989 ± 0.000075 | ||||
| 532.3 | 0.99991 ± 0.00006 | ||||
| 647.3 | 0.99990 ± 0.00007 | ||||
| 757.4 | 0.99983 ± 0.00006 | ||||
| 799.5 | 0.99997 ± 0.00009 | ||||
| 850.2 | 0.99984 ± 0.00012 |
Table 2. Summary of the uncertainty budgets for the results shown in table 1 stating minimum, maximum and typical values of relevant uncertainty contributions.
| Source of uncertainty | Relative standard uncertainty/ppm | |||
|---|---|---|---|---|
| Min | Max | Typical | ||
| CR | Electric power measurement | 14 | 14 | 14 |
| Cavity absorptance | 4 | 4 | 4 | |
| Non-equivalence of optical and electrical heating | 4 | 4 | 4 | |
| Position of CR | 7 | 7 | 7 | |
| Correction for variation of laser power and background radiation | 2 | 30 | 10 | |
| PQED | Gain of TIA | 8 | 8 | 8 |
| DVM measurement of TIA output | 5 | 5 | 5 | |
| Correction for stray light | 8 | 50 | 25 | |
| Correction for variation of laser power | 2 | 2 | 2 | |
| Position of PQED | 10 | 10 | 10 | |
| Laser wavelength | 1 | 2 | 2 | |
| Repeatability | 5 | 30 | 10 | |
| Combined standard uncertainty | 24 | 69 | 36 | |
| Combined expanded uncertainty (k = 2) | 47 | 138 | 72 | |
Table 3. PQEDs' EQE values measured in CMI.
| Wavelength/nm | 2012 | 2016 | 2019 | 2020 |
|---|---|---|---|---|
| 476.4 | 0.99995 ± 0.00018 | 1.00000 ± 0.00015 | 0.99990 ± 0.00016 | 0.99987 ± 0.00016 |
| 568.4 | 0.99987 ± 0.00016 | |||
| 647.3 | 0.99998 ± 0.00015 | 0.99983 ± 0.00017 | 0.99973 ± 0.00020 | |
| 752.8 | 0.99993 ± 0.00011 | 1.00005 ± 0.00012 | ||
| 799.5 | 1.00008 ± 0.00025 | 0.99999 ± 0.00025 |
Table 4. Uncertainty budget of CMI PQED EQE measurements performed in 2020.
| Source of uncertainty | Relative standard uncertainty/ppm | |||
|---|---|---|---|---|
| Min | Max | Typical | ||
| CR | Electric power measurement | 10 | 10 | 10 |
| Cavity absorptance | 20 | 20 | 20 | |
| Non-equivalence of optical and electrical heating | 2 | 2 | 2 | |
| Brewster window transmittance | 17 | 74 | 30 | |
| Brewster window scatter | 5 | 5 | 5 | |
| PQED | Gain of TIA | 20 | 20 | 20 |
| DVM measurement of TIA output | 12 | 12 | 12 | |
| Correction for variation of laser power | 2 | 2 | 2 | |
| Position of PQED | 8 | 35 | 15 | |
| Laser wavelength | 1 | 2 | 2 | |
| Repeatability | 48 | 89 | 65 | |
| Combined standard uncertainty | 61 | 125 | 80 | |
| Combined expanded uncertainty (k = 2) | 122 | 251 | 160 | |
In figure 3 the graphical representation of all the PQEDs EQE values measured by both PTB and CMI. In addition, the typical temporal drift observed at PTB for a group of traditional trap detectors (TDs) based on Hamamatsu S6337 windowless silicon photodiodes over a period of about 10 years is shown for comparison. We reported the EQE values at two wavelengths 850.2 nm and 568.4 nm with only one data point that provide further evidence of the near-ideal PQED responsivity behavior on all visible spectral range. These single data points can in addition be used to estimate the temporal stability of PQED by taking into account the date of manufacture of the photodiodes and the fact that the EQE at this date is equal to 1 at the highest. Thus the upper limit of the temporal drift of the PQED is (EQE − 1) divided by the temporal difference to the date of manufacture in 2011.

Figure 3. PQED vs TD EQE temporal stability (Note: the marker '532 nm (PTB)' includes also the PTB measurement at 531 nm.) The dashed lines show for comparison the temporal drift typical for a group of traditional trap detectors based on Hamamatsu S6337 windowless silicon photodiodes which have been calibrated at PTB over a period of about 10 years.
Download figure:
Standard image High-resolution image
4. Discussion
Since the manufacturing of the PQEDs in 2010 remarkably high EQE and undetectable drift in the PQED responsivity is observed to the measurement uncertainties of the CRs at CMI and PTB. To understand this observation we have to look at the working principles of the PQED. The PQED photodiodes are driven by the fixed charges in the oxide generating an induced n-type layer close to the SiO2–Si interface on the p-type substrate. This n-type layer generates the pn—junction in the PQED photodiode meaning that the fixed charges are essential to have a well-functioning photodiode.
3D simulations have revealed that the internal quantum deficiency of the induced junction photodiode, under sufficient reverse bias, is limited by the surface recombination velocity parameter S0 given by the product of the density of interface states, their capture cross section and thermal velocity of the minority charge carriers. The surface recombination velocity is therefore limiting the PQED performance when the photodiode is biased. There are basically two ways of reducing surface recombination; chemical passivation (reducing the number of interface states) and field effect passivation (reducing the co-existence of electrons and holes at the interface). The fixed charges have, in addition to be the 'engine' of the device, a field effect passivation property.
When our observations indicate an undetectable drift over more than a 10-year period the consequence has to be that the detector maintains its properties over time. More specifically, the changes in the number of interface states and the fixed charges in the passivation layer must be so small that this will not generate any observable changes in the quantum efficiency to the measurement uncertainty of the state-of-the art CRs.
Handling and storage of the device must be ensured to avoid dust contamination and maintain fixed charge and number of interface states to avoid drift in the responsivity.
5. Conclusions
The EQE values of a set of four PQEDs have been measured over an eight-year period using two independent state-of-the-art CR facilities in PTB and CMI with the highest accuracy currently available. For all PQEDs measured, the EQE is typically better than 09 999 for a wide spectral range from 476 nm to 850 nm. The data collected do not show any noticeable temporal degradation within the stated measurement uncertainties of the CRs. The PQEDs outperform the TDs in terms of EQE value and temporal stability over all visible spectral ranges and most remarkably at shorter wavelengths where the TDs exhibit the largest temporal drift: about 370 ppm year−1 for the commonly used Hamamatsu S6337 series photodiodes. We would also like to add that there is a currently running European EMPIR project (chipS-CALe) in which new induced junction photodiodes have been produced by a different manufacturer from the Qu-candela project. From the preliminary results these new photodiodes seem to perform, from the EQE standpoint, at least as well as the photodiodes manufactured in 2011 (Koyabasi et al 2021). The long-term stability of these photodiodes still needs to be investigated.
Acknowledgments
The authors of PTB are grateful to Ingmar Müller who designed, set up and characterized the PQEDs calibrated by PTB and to Uwe Johannsen who set up and improved the cryogenic radiometer calibration facility of PTB. The research leading to these results has received funding from the European Community's Seventh Framework Programme, ERA-NET Plus, under Grant Agreement No. 217257, from the European Metrology Research Programme (EMRP) Project SIB57 'New Primary Standards and Traceability for Radiometry' and from the project 18SIB10 chipS.CALe (EMPIR). The EMRP is jointly funded by the EMRP participating countries within EURAMET and the European Union. The EMPIR programme is co-financed by the Participating States and from the European Union's Horizon 2020 research and innovation programme. EI acknowledges the support by the Academy of Finland Flagship Programme, Photonics Research and Innovation (PREIN), decision number: 320167.