
Abstract
Germband extension during Drosophila development is primarily driven by cell intercalation, which involves three key components: planar cell polarity, anisotropic myosin contractile forces on cellular junctions, and cellular deformation and movement. Prior experimental work probed each of these factors in depth, but the connection between them remains unclear. This paper presents an integrated chemomechanical model that combines the three factors into a coherent mathematical framework for studying cell intercalation in the germband tissue. The model produces the planar cell polarization of key proteins, including Rho-kinase, Bazooka and myosin, the development of anisotropic contractile forces, and subsequent cell deformation and rearrangement. Cell intercalation occurs through T1 transitions among four neighboring cells and rosettes involving six cells. Such six-cell rosettes entail stronger myosin-based contractile forces, and on average produce a moderately larger amount of germband extension than the T1 transitions. The resolution of T1 and rosettes is driven by contractile forces on junctions anterior and posterior to the assembly as well as the pulling force of the medial myosin in the anterior and posterior cells. The global stretching due to posterior midgut invagination also plays a minor role. These model predictions are in reasonable agreement with experimental observations.
Export citation and abstract BibTeX RIS

Original content from this work may be used under the terms of the Creative Commons Attribution 3.0 licence. Any further distribution of this work must maintain attribution to the author(s) and the title of the work, journal citation and DOI.
1. Introduction
During development of the Drosophila embryo, a morphogenetic process known as axis elongation establishes the fly's anterior–posterior (AP) axis. The germband, a monolayer of cells that eventually develop into the segmented trunk, converges along the dorsal-ventral (DV) axis while extending along the AP axis, approximately doubling its length in the end. Cell intercalation is the primary cause of this convergent extension [1]. Localized cellular behaviors such as cell-shape changes [2, 3] and oriented cell division [4], and tissue-scale forces due to posterior midgut invagination [5, 6] and unipolar enrichment of myosin at parasegmental boundaries [7] also contribute to the germband extension process.
Cell intercalation is realized through the T1 transition and rosette formation and resolution [8, 9]. In a T1 transition, four cells exchange neighbors to elongate the cluster's dimension in the AP direction while shrinking it in the DV direction (figure 1(a)). Rosettes involve a greater number of cells that contract along a common axis into a flower pattern, and then resolve by elongating in the transverse direction (figure 1(b)). Both transformations consist of active contraction of cell borders perpendicular to the AP axis, conventionally called the AP edges, and extension of cell borders perpendicular to the DV axis, known as the DV edges. However, because rosettes involve contraction of more than one cell interface into a common vertex, they require coordinated contractile behaviors [10]. The relative importance of the two processes to cell intercalation is an open question [6, 11]. But rosette appears to be the more intensive of the two, as it requires stronger contractile forces along the AP edges [10], and results in greater change in aspect ratio for the assembly of cells [9, 11].
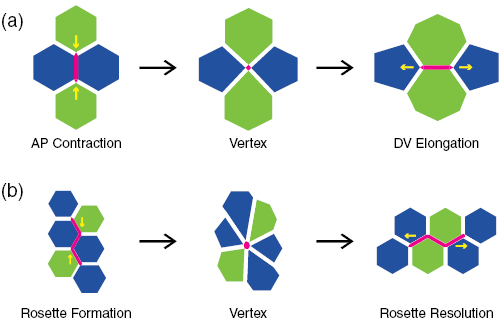
Figure 1. Mechanisms of cell intercalation: (a) a four-cell T1 transition and (b) a six-cell rosette formation and resolution. Both consist of two stages. The first involves contraction of an AP edge in T1 transition or a linked AP edge for rosette formation (colored red) to a single vertex, while the second involves expansion of the vertex to a horizontal DV edge.
Download figure:
Standard image High-resolution imageCell intercalation has a biochemical aspect and a mechanical aspect. The former consists in the planar cell polarization (PCP) of several proteins, with the accumulation of Abl, Shroom, F-actin, nonmuscle myosin-II (Myo-II) and Rho-kinases (Rok) on the AP edges and apparently antagonist proteins such as Bazooka (Baz), E-cadherin (E-cad) and β-catenin on the DV edges [12–14]. The mechanical aspect is manifested by the contraction and elongation of cell borders, the rearrangement of cells and the overall deformation of the germband. These two aspects are closely coupled together. PCP is a pre-condition for the mechanics of intercalation; it generates the actomyosin apparatus for anisotropic contraction of cell edges [9, 15]. Meanwhile, the mechanics feeds back to the biochemistry through tension-regulated myosin dynamics [10, 16]. Interestingly, apart from enabling myosin contraction, PCP also contributes directly to cell intercalation by actively remodeling the adherens junctions (AJs) between cells. On a contracting AP edge, Rok downregulates adhesion [17], and antagonizes Baz that maintains and stabilizes AJs [18]. Besides, Abl enrichment promotes turnover of the AJ protein β-catenin [13]. All three pathways lead to AJ disassembly on contracting AP edges. On DV edges, on the other hand, Baz facilitates the apical localization of E-cad and β-catenin, and stabilizes the adherens junctions [9, 11, 19]. Thus, PCP can promote contraction of AP edges and the growth of the nascent DV edges.
Over the past decade, the mechanical and biochemical aspects have been studied in depth separately, leading to many useful insights, e.g. on the origin of planar cell polarity [7, 20] and the nature of the contractile forces [21–23]. But the two are rarely examined together despite ample evidence for their influencing each other. Lan et al [24] made a tentative step in this direction, by integrating the biochemistry of planar cell polarization and the mechanics of cell deformation in a highly idealized four-cell setup. This model captures several features of experimental observations of T1 transition, including certain quantitative data such as AP/DV polarity and the magnitude of convergent extension. Its prediction of the mechanism for DV elongation has been confirmed by later experiments [6, 22]. While a useful first step [23, 25, 26], Lan et al's model suffers from several fundamental limitations. Four cells are the minimum to realize the T1 transition, but cannot represent rosettes at all. The setup also fails to reflect the spatial expanse of the germband and the apparent stochasticity in when and where T1 transitions happen during germband extension. Moreover, it neglects interaction with the surrounding tissue, as well as the tissue-scale stretching due to posterior midgut invagination (PMI).
As an outgrowth from the model of Lan et al [24], the present work seeks to address its limitations. By adopting a 52-cell setup for the germband (figure 2), we introduce spatial and temporal stochasticity by randomly selecting AP edges on which to induce the onset of PCP. To represent the effect of the surrounding cells, we connect the model tissue to an outer boundary with cables bearing constant tension, and also impose a constant pre-tension on all cell edges according to experimental evidence [21]. PMI will be implemented according to experimentally measured extension rates [5]. Besides, the new model allows rosette formation and resolution; they arise when, by chance, two nearby AP edges are both selected to undergo contraction. Finally, we will also include the effect of AJ remodeling on AP and DV edges.
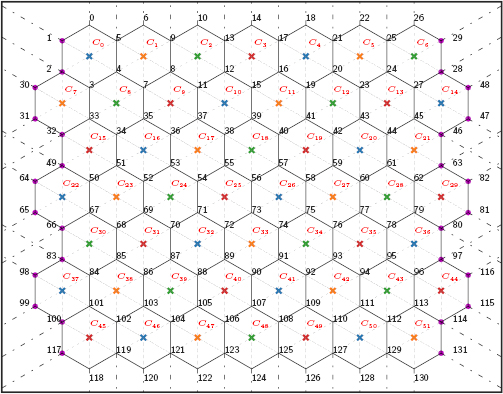
Figure 2. Geometry of the 52-cell tissue, with all the cells and vertices labeled. The cell centroids are represented by coloured crosses, with the phase lag  for blue, orange, green and red, respectively. The external cables, shown as dashed lines attached to the vertices of the tissue boundary, are initially aligned with the various spokes or edges. The magenta-colored boundary vertices are subjected to an additional outward movement due to PMI.
Download figure:
Standard image High-resolution image2. Model description
The initial configuration of our 52-cell germband tissue is depicted in figure 2. Each cell is initially a perfect hexagon with 6 vertices and 6 edges. On each cell edge we define 4 proteins: Shroom, Rok, Myo-II and Baz; the edge can lengthen or shorten according to the myosin contractile force and a linear elasticity. Within each cell, six spokes connect the vertices to the centroid of the cell. Based on experimental observations [3, 15, 27], we impose pulsating medial myosin on the centroid that pulls on the vertices along the spokes. The position of the centroid is updated at each time step as the cell deforms. With the current setup, it is relatively easy to generalize to larger tissues, at the expense of longer computing time.
2.1. Kinetic model
Our kinetic model is based on experimental observations of the biochemical pathways leading to PCP [9, 13, 14, 18], the mechanisms of AJ remodeling [9, 11, 13, 19] and a tension-myosin positive feedback [10, 16, 24]. Figure 3 depicts these interactions schematically. By tracking the amount of Shroom (S), Rok (R), Myo-II (m) and Baz (B) on each cell edge, the model predicts polarization of those proteins and in turn an anisotropic contractile force on AP edges. On each edge, the evolution of these species are governed by the following differential equations:
where for S we impose an anisotropic, time-independent level on the AP, DV and slanted ('shoulder') edges [14, 24]. The terms and the parameters are as explained in [24], with each unit of S, m, R and B consisting of 162 molecules of the respective protein. In particular, the e−S form in equation (1) is chosen for mathematical convenience, the real kinetics of the Shroom-Rok chemical pathway being unclear at present. Note that  is a myosin detachment rate that is suppressed by tensile force f on the edge, a well-known positive feedback between junctional myosin and tension [10].

Figure 3. Schematic showing how the model generates PCP and contractile forces on cell edges. On a contracting AP edge, the elevated Shroom enriches Rok, which in turn depresses Baz and activates myosin. On DV edges, Baz suppresses myosin and promotes AJ buildup via the rest length (details of AJ remodeling in section S1 of the online supplemental information (stacks.iop.org/PhysBio/15/066008/mmedia)). Myosin and tension are linked in a positive feedback.
Download figure:
Standard image High-resolution imageWe model the pulsating medial actomyosin network by imposing a sinusoidal myosin signal on the centroid of each cell:
Although the cyclic contraction of medial actomyosin is an interesting phenomenon in its own right [15], it is not a central element in the current model, and is therefore modeled ad hoc. The phase angle ϕ is specified for each cell in the tissue (see figure 2) such that the neighbors exhibit anti-correlation on average, in agreement with experimental observations [15]. See the online supplemental information (SI), section S2 for more details on the neighbor-neighbor correlation for medial myosin.
2.2. Mechanical model
As in previous vertex models, the cells deform and move through the over-damped motion of its vertices:
where η is an effective viscosity,  is the position of the ith vertex, fij is the total force on the edge connecting vertices i and j,
  is the medial myosin force from neighboring cell k pointing toward its centroid, and
  is a pressure force in cell k along the outward 'normal direction', which bisects the polygonal corner at i. Each cell edge exhibits a passive elastic force and a myosin-based active contractile force:
where μ is the elastic modulus of the edge, lij and l0 being its current and resting length, mij is the Myo-II level on the edge, and β is the myosin force constant [24]. The magnitude of the medial myosin force is simply  , mmk being the medial myosin of cell k, and that of the pressure force is
  , A0 and Ak being the resting and current cell area of neighbor k, and α the bulk modulus for the cell.
Besides mechanical forcing, remodelling of AJs is another factor in the contraction of AP edges and elongation of DV edges. The exact mechanisms for the remodeling are not clear at present, but several plausible pathways have been suggested, involving Rok, Abl, Baz, β-catenin and E-cad [11, 13, 18]. Among these, only Rok and Baz are accounted for in our model, and they localize to complementary cell borders upon onset of PCP [24]. We have chosen Baz to be the variable through which to encode AJ remodeling, as Baz exhibits similar polarization patterns to β-catenin and serves as a good surrogate for the latter [13]. In turn, the strength of AJs is modeled by passive elasticity on each edge, with a resting length l0(B) that varies with Baz. On AP edges, therefore, l0 shortens with declining Baz and thus facilitates contraction of the edge, while on DV edges, l0 grows with Baz to facilitate DV elongation. More details can be found in section S1 of the online SI.
Finally, the geometric, kinetic and mechanical parameters are evaluated from experimental data where possible. These are tabulated in SI (section S3) with sources and justifications. The numerical techniques for the computation are also discussed in SI.
2.3. Treatment of tissue boundaries
The 52-cell assembly of figure 2 represents only a portion of the real germband. Unlike in whole-embryo models [28], we need to treat the outer boundaries of the model tissue so as to mimic the interaction with the surrounding tissue in reality. As the germband does not exhibit spatial periodicity, it would be erroneous to impose periodic boundary conditions. Modeling the surrounding tissue by elastic springs attached to a fixed circular boundary produced poor results in Lan et al [24]. The springs hindered the contraction along the DV axis and extension in the AP axis and skewed the convergent extension of the tissue. In reality, the surrounding tissue would be undergoing convergent extension as well, and its deformation would accommodate that of the model tissue. To represent this interaction, we have introduced 'cables' emanating from the boundary nodes more or less isotropically (figure 2), each carrying a constant tension (to be defined in the next subsection). As the boundary vertices move, the cables shift as well, without changing their orientation.
In addition, PMI exerts a stretching force on the germband along the AP axis. Lye et al [5] quantified this stretching not as external forces on the germband, but as shape change of the cells. Collinet et al [6] represented it as movement of the boundary along the AP axis. Following [5], we view the germband extension as comprising the effects of cell intercalation and cell-shape change due to PMI. Using their measurements, we convert the rate of cell-shape elongation into a rate of AP extension for the tissue, and add that, at each time step, onto the movement of the boundary vertices that results from the intercalary forces and external cables. Thus, the global stretching due to PMI amounts to an additional horizontal outward movement on our boundary vertices. Details can be found in SI (section S4).
2.4. Protocol of simulation
It is convenient to first imagine an equilibrium state in which the tissue is in chemical and mechanical balance. Imposing a uniform Shroom level of Se = 0.5 on all edges, we find a chemical equilibrium with Re = 0.659, Be = 0.607 and me = 0.912 on all edges. Force balance is achieved by having perfectly uniform hexagonal cells of edge length  , with each edge carrying a uniform pre-tension
  ,
,  being the resting length at equilibrium level of Baz Be. On the boundary vertices, the pre-tension is balanced by the external cables. See SI (sections S1, S3 and S4) for detailed discussion on choosing the values of l0,
  and the cable forces Fcable to ensure mechanical equilibrium prior to the onset of cell intercalation.
The procedure for simulation is as follows. For the initial period, up to t = 400 s, we maintain the uniform Se = 0.5, Re = 0.659 and Be = 0.607 on all edges. The medial myosin pulse is applied with phase lags among neighboring cells as prescribed in figure 2. Thus, the cells oscillate gently during this period, with no cumulative changes or polarization. Because of the positive feedback of junctional tension on myosin, the junctional myosin will oscillate about a mean value slightly below me thanks to the additional compression on the cell edge by the medial myosin.
At t = 400 s, we initiate the PCP by randomly selecting an AP edge by the stochastic scheme described in the next subsection, and raising S to 1 on it to initiate polarization and AP contraction. In the mean time, we assign an intermediate S = 0.625 on shoulders connected to the contracting AP edge. As new DV edges are created, from T1 transition or rosette resolution, S = 0.5 is assigned on them. This anisotropic Shroom pattern is based on experimental observations [14], and is assumed to be time-independent throughout the simulation.
2.5. Temporal and spatial stochasticity
During germband extension, the contraction of AP edges appears at apparently random times and locations. Here we model temporal stochasticity as a Poisson process. The frequency parameter is estimated from experimental data [13] to be roughly 0.05 event of AP contraction per cell per minute (see details in SI, section S5). Note that the Poisson distribution thus designed yields the expected frequency of AP contraction only at the start of our simulation. The geometric regularity of our model tissue, with relatively few AP edges, means that the actual rate of AP contraction drops in time and fewer T1's and rosettes will have taken place in the end than indicated by the target frequency.
Spatial stochasticity is implemented by selecting a random available AP edge for each contraction. The term available refers to AP edges that are connected to at least 3 cells and have yet to begin contraction. An interior AP edge, with neither end vertex exposed to the outside, are connected to 4 cells, while those at the boundaries are connected to 3 or fewer cells. T1 swap is impossible with AP edges that are connected to 2 cells or 1 cell. We also impose a constraint that no boundary AP edge be selected if an interior AP edge is available. The reason is that a sequence of early contractions on the boundaries tend to make some cells concave and cause that part of the tissue to collapse. AP contraction typically culminates in neighbor swaps through T1 transition or rosette formation, to be discussed next.
2.6. T1 transition and rosettes
We have adapted the scheme for T1 transition of Lan et al [24]. When an AP edge contracts to a critical length of  , i.e. 2% of its equilibrium length, a neighbor swap is implemented by rotating the AP edge counter-clockwise into a new horizontal DV edge and reconnecting its vertices to the closest neighbors. Shroom is set to S = 0.5 on the nascent DV edge, in keeping with the observed anisotropy [14]. Different from Lan et al [24], however, we do not set m = 0, R = 0 and B = 0 on the nascent DV edge. Instead, the DV edge carries over all the protein levels from before the rotation. This is because the model of Lan et al [24] lacked any treatment of the establishment of cell-cell junctions along the growing DV edge. As our model captures this effect via l0(B), we no longer need to make these drastic assumptions.
Rosettes form after two adjacent AP edges and the shoulder edge in between contract to a single vertex (figure S3). We model the initiation of rosettes as a stochastic process. If, by chance, two AP edges connected to the same shoulder edge are selected successively to contract, we use a second Poisson distribution to determine whether a rosette should form. If an affirmative answer is returned, Shroom is elevated to Sm = 1.4 on the two AP edges as well as on the shoulder sandwiched in between such that the 3 edges form a 'linked AP edge' [9, 10]. Its contraction to a single vertex then produces a six-cell rosette. To our knowledge, the only previous vertex model that accounted for rosettes is Trichas et al [29], for the mouse visceral endoderm. In experiments, rosettes made of 5–11 cells have been reported [9]. For simplicity, however, we restrict our model to six-cell rosettes only. The frequency parameter in the second Poisson process is estimated from in vivo data of Tamada et al [13], at 0.026 rosette per cell per minute (see details in SI, section S5), about half the rate of formation for T1 transitions. An additional constraint is that a cell is barred from participating in two or more rosettes at the same time. This avoids the appearance of overlapping or neighboring rosettes, which the model fails to resolve properly owing to its geometric simplicity. Note that in vivo the germband cells undergo multiple rounds of rosette formation, and neighboring and overlapping rosettes do occur [9].
Rosette resolution follows a similar scheme to the T1 transition described above. Once the linked AP edge has shrunk to a critical length of  , we replace it by a new horizontal DV edge, with neighboring vertices separated by a uniform distance of 0.02le. The critical length is three times that for T1 transition since 3 edges are involved in the rosette formation. After the transformation, the cell edges are reconnected onto the new DV edge as explained in SI, section S6, so as to ensure a unique topological outcome. On these new DV edges we set the Shroom level to Se = 0.5 according to PCP [14], and let Rok, Baz and Myo-II evolve according to the kinetic model.
3. Results and analysis
Certain features of the model prediction are similar to those in the previous model of Lan et al [24] for the four-cell assembly, such as the development of the PCP in terms of Rok, Baz and Myo-II distributions within each cell. These features will receive only a cursory mention in the following. We will focus on the novel features of the current model, including those that arise from the large expanse of the tissue and the formation and resolution of rosettes. To isolate the effects of T1 and rosettes, we first study a scenario of germband extension with T1 transitions only. Then we will focus on the formation and resolution of a single rosette. Finally, we study the tissue-wide properties during a full simulation that incorporates both T1 transition and rosettes.
3.1. Germband extension with T1 transition only
We start by simulating the intercalation in the 52-cell tissue that undergoes T1 transition only, without rosettes. Because of the medial myosin pulse (equation (4)), the cells exhibit a gentle oscillation for the initial 400 s of the simulation, before PCP and intercalation set in. This period corresponds to the early Stage 6 of experimental observations (e.g. figure 1 in Blankenship et al [9]), and is similar to what Lan et al [24] described using the four-cell assembly.
Starting at t = 400 s, we randomly select AP edges to start PCP, at the frequency mentioned above, until all available AP edges have undergone contraction and T1 transition. The whole process is shown in movie 1 of the SI. Most features of the T1 transition are similar to those predicted by Lan et al [24], and some details are given in section S7 of the SI. For example, the development of PCP produces a greater contractile force on the AP edge (figure S4). The AP contraction is driven mainly by the junctional myosin force against resistance of the shoulder forces, while DV elongation is driven by the medial myosin forces in the two cells anterior and posterior to the new DV edge as well as the shoulder forces, mostly against the myosin force on the DV edge (figure S5). A new feature is the disassembly of the AJs on the contracting AP edges and the strengthening of AJs on the growing DV edge. Modeled through the resting length l0(B) of the cell edges, the declining elastic resistance on the AP edge promotes its contraction, while the lengthening l0 on the DV edge relieves the elastic tension and facilitates DV elongation.
Over the course of the simulation, T1 transitions occur stochastically in space and time. To probe this stochasticity, we have run 10 independent simulations under identical conditions. Because of the regularity of the geometric setup, a total of 49 T1's take place in each run, and the tissue elongates to the same regular pattern (see movie 1). An interesting indicator of the stochasticity of the process is the times for AP contraction TAP and DV elongation  . For each AP contraction, we measure the time between the onset of PCP and the moment that the AP edge length shrinks to the threshold of 0.02le. The duration of DV elongation is measured between the appearance of the new DV edge and the moment when the DV length first attains the equilibrium length of le = 4 μm. This treatment differs from that of Lan et al [24], whose DV edge length oscillated more or less regularly, and its third peak was taken to be the end of the elongation process. In the current model, the elongation of the DV edge is less regular and a third peak cannot be easily defined. Compiling TAP and
  data for all the T1 transitions in the 10 simulations, figure 4 shows that both times exhibit a rather wide distribution. This is because AP contraction and DV elongation are affected by what the neighboring cells happen to be doing, and the latter varies stochastically thanks to the random selection of AP edges for contraction. After averaging all 490 T1's, we have mean values TAP = 493 s and
  s. Experiments have recorded TAP ranging from 450 to 600 s and
  ranging from 420 to 600 s [8, 9]. The predicted mean values are somewhat shorter than the measurements. Potential causes include the uncertainties in evaluating the parameters and in defining the start and end points of contraction and elongation. Besides, the broader distribution of figure 4 suggests that our model tissue is too small and sensitive to noise.

Figure 4. Histograms showing the distribution of times needed for (a) AP contraction and (b) DV elongation during T1 transition. The data are collected from 10 runs, and the mean time of the distribution is marked with a red dashed line.
Download figure:
Standard image High-resolution imageNext, we will examine the degree of anisotropy in terms of the distribution of the proteins and the contractile forces. Following prior experimental and modeling work [10, 14, 15, 18, 22, 24, 30], we focus on the ratio of these quantities between the AP and DV edges. In experiments, the level of various proteins are measured by averaging vertical or horizontal edges of differing lengths [21, 30]. These edges are presumably at different stages of T1 transition. To approximate the averaging in the experiments, we have taken the time average on AP edges from the onset of AP contraction to the T1 swap, and on DV edges from the T1 swap to the completion of DV elongation. Additionally, we have averaged among the T1 transitions for the 10 realizations. The results are compared with prior experiments and modeling in table 1.
Table 1. AP/DV ratios of various proteins and the edge force during T1 transition: comparison between model predictions and experimental measurements.
| Experiments | Model of Lan et al [24] | This model | |
|---|---|---|---|
| Rok | 1.5–1.9 [14] | 1.65 |  |
| Baz | 0.33–0.5 [14, 18, 31] | 0.607 |  |
| Myo-II | 1.3–2.1 [14, 18, 27, 31] | 2.74 |  |
| Edge force | 1.7–2.55 [10, 30] | 7.5 |  |
The AP/DV contrasts in Rok and Baz levels are somewhat weaker in our model than in the experiments, while the Myo-II contrast falls in the experimental range. Our force ratio is slightly below the experimental data, but is a marked improvement over the prediction of Lan et al [24]. Experimentally, the force ratio is estimated from the ratio of end retraction speeds after laser ablation of the cell edges. What is measured, therefore, is the total force on the edges, which in our model comprises the myosin and elastic contributions. Since Lan et al [24] did not consider the myosin tension on the nascent DV edges, they have over-predicted the ratio by a wide margin. In addition, a more precise comparison can be made of the magnitude of the edge forces. Bambardekar et al [30] have reported an average force of 0.324 nN on AP edges and 0.127 nN on DV edges. In comparison, our model predicts 0.68 nN and 0.46 nN, respectively, more than twice as high as the measured values. In the experiment, the force values were averaged over edges oriented within 45° of the AP or DV axis, and may have included various shoulder edges. In our model, the AP and DV edges are clearly defined. This may partially explain the discrepancy.
Finally, let us turn to the overall deformation of the tissue. Following Collinet et al [6], we define a relative length Lr as the current AP length of the tissue, measured between the centroids of the leftmost and rightmost cells, divided by the initial length before the onset of axis elongation. Figure 5 shows the temporal evolution of Lr averaged over the 10 runs. The relative length of the model tissue (large box) rises to a value of Lr = 1.74 at the end of the simulation, roughly 40 min after the onset of intercalation. This compares with experimental measurements of Lr = 2–2.5 [1, 6]. In vivo, the germband undergoes many rounds of T1 and rosette processes. In our model tissue, the simple geometry allows fewer T1 transitions, and no rosettes in this case. These have contributed to the under-prediction of tissue elongation.
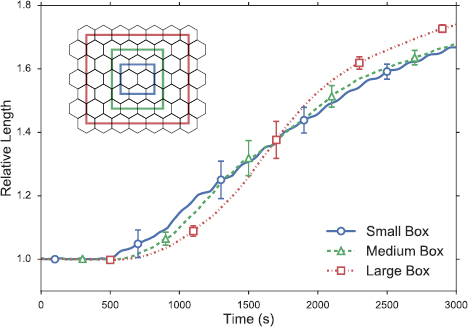
Figure 5. Tissue elongation subject to T1 transitions: comparison of the relative length Lr of the three tissue clusters demarcated by the rectangular boxes in the inset, the largest being the entire model tissue. The error bars indicate spread among the 10 simulations over which averages are taken.
Download figure:
Standard image High-resolution imageBy comparing the relative deformation of cell clusters of different sizes, Collinet et al [6] observed that 'tissue extension is spatially homogeneous and scale-independent'. That is to say, the strain is uniform throughout the tissue. To test for spatial homogeneity in our model tissue, we compare the relative length Lr of the three tissue clusters delineated in the inset of figure 5. The relative length agrees to within 4% at the end of the simulation among the three boxes. The earlier differences are mainly due to spatial variations of where a T1 happens first. Thus, our model has successfully recapitulated the spatial homogeneity that Collinet et al [6] demonstrated in vivo. Note further that the larger boxes show slightly larger elongation in figure 5, a feature that is also present in the experimental data (figure 1(e) of [6]). This may be related to the stretching along the AP axis due to midgut invagination, which, in our model at least, favors greater deformation of cells at the left and right edge of the tissue, as is evident from images near the end of movie 1. Interestingly, the effect of PMI on cell shape change is actually inhomogeneous in vivo [5]; cell deformation is more pronounced closer to the posterior tip of the embryo. As explained in section S4 of the SI, this feature is not included by our model.
3.2. Analysis of rosette formation and resolution
Now we allow both T1 and rosettes in the simulation. In this subsection, we examine closely the formation and resolution of the first rosette as a representative of all rosettes. The purpose is to discuss the various mechanisms that can affect the rosette formation and resolution, and explore its local features. The global features of the full simulation, with both T1 and rosettes appearing and resolving with spatial and temporal stochasticity, will be discussed in the next subsection.
At the end of the initial oscillation, t = 400 s, we start to select randomly AP edges to initiate PCP and contraction, as described in the previous subsection. In the representative simulation that we will describe now, the first rosette appears when two nearby AP edges in the middle of the tissue, edges 19–41 and 42–59 in figure 2, are selected at t = 499 s and 501 s for contraction, respectively. Thus, S is raised to 1.4 on them and to 0.625 on the shoulders connected to them on the outside. At t = 538 s, the sandwiched shoulder (41–42) is selected for rosette formation by a Poisson probability and S is raised to 1.4 on the shoulder as well. This causes contraction of the three connected edges, referred to as the linked AP edge following [9, 10] (t = 650 s in figure 6(a)). Note that when the two AP edges start to contract, the shoulder edge in-between is first elongated. With the development of its own Rok and myosin, however, it contracts as well until the linked AP edge shrinks down to the critical length of  at t = 1158 s. After rotating the linked AP edge into the horizontal direction and reconnecting the vertices according to figure S3, the three nascent edges elongate (figure 6(b)). Interestingly, it is the middle edge that elongates most rapidly. The two horizontal edges elongate more slowly, and DV elongation is complete when the shortest of the three reaches le = 4 μm at t = 1882 s. The forces driving and resisting the rosette transformation are the same ones as in T1 transition, but larger in magnitude (see section S7 and figure S6 of SI). Note that the topology of the cells after rosette resolution is identical to what would have resulted from two separate T1 transitions involving the two AP edges initially chosen to contract. The rosette formation and resolution are also shown in movie 2 in SI. During this process, the surrounding tissue undergoes stochastic T1 transition, and the second rosette has started at t = 550 s involving edges 34–51, 51–50, and 50–67.
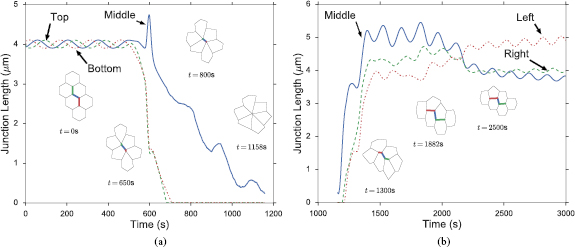
Figure 6. (a) Formation of the rosette, with the three segments of the linked AP edge shrinking in time and forming a vertex at t = 1158 s. The snapshots illustrate the configuration of the cluster at different times, in which the three segments are indicated by colors. (b) Resolution of the rosette, with the three segments lengthening in time.
Download figure:
Standard image High-resolution imageTo effect the remarkable contraction of the three linked edges into a vertex, our model has adopted the ad hoc device of raising the Shroom level on them. Experimental observations in vivo have identified several factors that may have contributed to this contraction. First, tension is known to suppress the detachment rate of myosin motors on actin filaments [10], and this amounts to a positive feedback between tension and myosin on a cell border. This factor has been incorporated into our model. Second, the protein Abl tends to intensify β-catenin turnover on AP edges, causing disassembly of cell junctions along the linked AP edge and facilitating its contraction [13]. This has been modeled via the resting length l0 of the linked AP edges, which decreases as Baz becomes depleted. Without this effect, AP contraction would not be able to proceed to the point of producing a T1 transition or a rosette. The third is the alignment of several cell borders into a linked edge oriented perpendicular to the AP axis [9, 10]. This aligns the contractile forces on the connected segments so as to reinforce each other's effect. Experimental images and videos suggest that the fluid-like deformation of the germband and the irregular shapes of the cells frequently bring the edges to near alignment. In our model tissue, however, the regular hexagonal shape is such that it is difficult to align the shoulder edge within  of the DV axis. As a result, this factor is not well represented in our model. Fourth and finally, recent experiments suggest that stretching of a cell edge to a large strain or strain rate may predispose the edge to a strong surge of myosin recruitment afterwards [10, 32, 33]. We have tested this factor in our model by making the rates of myosin attachment and retention functions of the strain or strain rate (see SI, section S8 for more details). This at most provides an initial boost for myosin that disappears later with the AP contraction, as the strain and strain rates both decline. In reality, the reaction of a stretched cell edge may possess a certain memory or relaxation time. This remains to be explored using more sophisticated mathematical formulations.
Is the rosette more effective than T1 at elongating the tissue in the AP direction? Zallen and Blakenship [11] reported that 'rosette formation amplifies the effects of neighbor exchange, producing a 5.5-fold average change in the AP:DV aspect ratio, compared to a 2.5-fold average change for T1 processes'. When Collinet et al [6] measured AP extension associated with T1 and rosettes, they 'did not find a significant difference (figures 1g, h)'. To probe this question using our model, we first note the different ways of measuring tissue elongation in the literature. Some researchers [9, 11, 24] use the change in the AP:DV aspect ratio, while others [6] use the relative length, as in figure 5 of this paper. As the extensional strain along the AP axis and the compressive strain along the DV axis have roughly the same magnitude [6, figure 1k], one can compare the relative length with the square root of the change in AP:DV aspect ratio. Besides, measuring the relative length from the outline of the cell cluster yields a smaller ratio than using the centroid of the outmost cells (see figure S1 of [6]), especially for smaller clusters. With these clarified, we can compare our model predictions with the experimental data.
Using the cell outlines, we have measured the evolving relative length Lr of four-cell clusters during T1 and six-cell clusters during rosette transformation. After shifting the start of such events to t = 0, we compute an average Lr for the T1's and for the rosettes, and compare them with the measurements of Collinet et al [6] in figure 7. On average, the T1 clusters achieve a relative length of  at the end, whereas the rosettes attains a somewhat stronger stretching at
  . The data of Collinet et al [6] show little difference between the two structures, both attaining a relative length of Lr = 1.44 (figure 1(h) therein). Thus, our model indicates a moderate advantage to the rosettes in terms of tissue elongation.

Figure 7. Temporal evolution of the relative lengths of rosettes (dotted line) and four-cell T1 clusters (dashed line), averaged over all such events in 10 simulations. Time has been shifted so t = 0 marks the onset of a T1 or rosette event. The error bars indicate the scatter among these simulations. In the end, the six-cell rosettes produce about 6% more stretching than the four-cell T1 clusters. The solid line represents in vivo data from figure 1(h) of Collinet et al [6] for both T1 and rosettes.
Download figure:
Standard image High-resolution imageHow to reconcile the above with the apparently conflicting trends in experimental observations? Blakenship et al [9] offered a clue when they noted 'a change in the AP/DV aspect ratio ... by a factor of 2.1 for rosettes of 6–7 cells (n = 74) and by a factor of 3.0 for rosettes of 8–10 cells (n = 9)'. The factor of 2.1 translates to a relative length of  , close to that of our six-cell rosette and that of Collinet et al [6], whose figure 1(g) shows rosettes of 6 cells. Therefore, it appears that rosettes involving a larger number of cells may produce significantly more stretching than T1's, while six-cell rosettes are only moderately more effective. Incidentally, the larger numbers reported by Zallen and Blakenship [11] are based on cell centroid positions, as opposed to the cell outlines. If one uses their figure 3 to estimate the conversion factor between these two measures, then their centroid-based data—5.5-fold for rosettes and 2.5-fold for T1—translate to 2.94 and 1.57, respectively, for the outline-based measure of change in aspect ratio. These are consistent with the data of Blakenship et al [9].
3.3. Full simulation with both T1 transitions and rosettes
Having analyzed the T1 transition and rosette transformation separately, we turn now to tissue-wide features of the simulation with both processes occurring. Again, we have carried out 10 realizations from identical initial conditions. Their outcome are qualitatively similar but quantitatively different thanks to the temporal and spatial stochasticity built into the model. We will average among the 10 runs to measure the various aspects of tissue elongation.
Movie 3 in the SI depicts a representative run of the full simulation, which lasts 3000 s with 41 T1 transitions and 4 rosettes during the simulation. On average, the AP contraction phase of a T1 transition takes 438 s, while the DV elongation phase 270 s. These are close to the times in the simulations of figure 4 with only T1 transitions. Rosette formation and resolution take considerably longer times (figure 8). The formation and resolution times of 643 s and 523 s compare with experimental values of 648 s and 600 s [9]. As noted earlier, the broad distributions of the contraction and resolution times reflect the stochastic disturbance from the neighboring cells that may delay or precipitate cell intercalation.
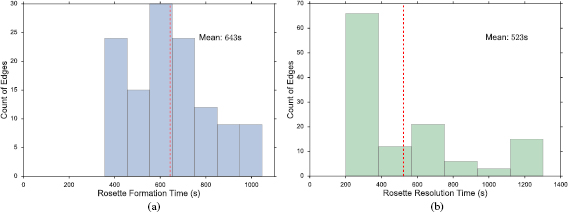
Figure 8. Histograms showing the distribution of times needed for (a) rosette formation through AP contraction and (b) rosette resolution through DV elongation. The data are collected from 10 runs, and the mean time of the distribution is marked with a red dashed line.
Download figure:
Standard image High-resolution imageDepending on how nearby AP edges are chosen randomly to form rosettes, the total numbers of rosettes and T1 transitions vary among our 10 simulations, the number of rosettes ranging from 4 to 6 while that of T1 from 37 to 41. These are much lower than those recorded in vivo [13, 31]; based on the more recent experimental data of [31] one would expect some 35 rosettes and 63 T1s for 52 cells. Furthermore, the final configuration is always the same in the simulation, with hexagonal cells in neat rows. Both features are symptomatic of the simple and regular configuration of our cells in the model tissue. The total numbers of T1 and rosettes are limited by the number of AP edges available. In vivo, cells exhibit considerable variations in shape, size and connectivity, and the germband flows and deforms in time to create new AP edges. Thus, the tissue undergoes multiple rounds of intercalation during germband extension [9]. This should be kept in mind when comparing our model predictions with experiments in the following.
Anisotropy in the distribution of Rok, Baz and Myo-II and the edge tension are tabulated in table 2, in comparison with experimental data in the literature. In the full simulation, the AP:DV ratios in T1 transitions are close to those in the T1-only simulations of table 1. What is of more interest here is the ratio between linked AP edges and DV edges in rosettes, computed by averaging the three linked edges. The Rok and Baz ratios are more strongly polarized than those in T1 transitions. They are also comparable with experimental data for AP:DV ratios, although the experimental sources [14, 18, 31] did not distinguish between T1 and rosettes, and probably contained both. In our model, the linked AP edges exhibit a Myo-II level more than twice that of isolated AP edges. Partly this is due to the elevated Shroom level on linked AP edges. Moreoever, Myo-II enjoys a positive feedback with tension [10]. The strong tension on the linked AP edges has given Myo-II an additional boost. Again, most experimental reports did not distinguish the linked and isolated AP edges. For example, Farrell et al [31] reported an AP:DV myosin ratio of 2.1 for both types of AP edges. Besides, this ratio includes edges within 15° of the vertical and horizontal axes. Considering these two factors, the real linked AP:DV ratio for myo-II in vivo is likely much higher than 2.1. The only experimental study that distinguishes myosin levels on linked and isolated AP edges gives the following ratios [10]: linked AP:AP:DV = 1.14:1.05:1. Though the ratios are lower than in the other reports [14, 18, 27, 31], the linked AP edge still exhibits a clear advantage over the isolated AP edge in terms of myosin enrichment relative to the DV edge. Note that the strain-activated myosin recruitment mechanism may have contributed to the myosin enrichment on linked AP edges in the experiments [33]. Finally, the model successfully captures the strong tension force on linked AP edges, relative to isolated AP edges, and the tension ratio is not far above data gathered from laser ablation experiments [10, 15].
Table 2. Anisotropy of various protein species and the edge force: comparison between model predictions and experimental measurements. The AP:DV ratio corresponds to edges in T1 transitions, while Linked AP:DV refers to edges in rosettes.
| Experiments AP:DV | Experiments Linked AP:DV | This model AP:DV | This model Linked AP:DV | |
|---|---|---|---|---|
| Rok | 1.5–1.9 [14] | (No data) |  |
 |
| Baz | 0.33–0.50 [14, 18, 31] | (No data) |  |
 |
| Myo-II | 1.05–2.1 [10, 14, 18, 27, 31] | 1.14 [10] |  |
 |
| Edge force | 1.7–2.55 [10, 30] | 2.9–3.1 [10, 15] |  |
 |
Figure 9 compares the model predictions of the tissue stretching for the T1 only simulations of section 3.1 and the full simulations of this section. The in vivo data of Collinet et al [6] are also shown for comparison. First, the inclusion of rosettes in our model leads to a slight increase in the germband extension, consistent with the observations in figure 7. The effect is weak because the simulation sees much fewer rosettes than T1's. Second, our model predictions of relative length fall some 15% below the in vivo data. In the end, our relative length Lr reaches about 1.7, whereas in vivo Lr rises above 2. The reason for this discrepancy, as alluded to already, lies in the fact that the simple geometry of our model tissue allows just one round of intercalation, after which no vertical AP edge remains and no further intercalation can occur. In vivo, on the other hand, the germband undergoes complex overall deformation that allows movement and rotation of cell edges and multiple rounds of T1 and rosette processes. This is clear from videos of germband extension in Blankenship et al [9]. Therefore, the simplicity of our model tissue has limited its ability to capture the true magnitude of germband extension.
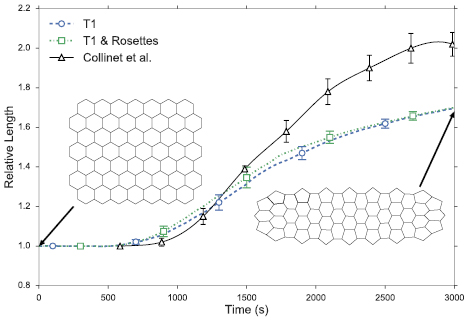
Figure 9. Comparison of the whole-tissue extension in terms of the relative length as a function of time. The dashed and dotted lines are from our simulations and the solid line represents the in vivo data of Collinet et al [6]. The two insets illustrate typical tissue shapes at the start and the end of simulation.
Download figure:
Standard image High-resolution imageTo test the spatial homogeneity of stretching, we again compare the strain (or relative length) of the 3 rectangular clusters depicted in figure 5. Results show that such homogeneity remains in the full simulation; the relative length agrees to about  among the 3 boxes. This is perhaps no surprise given that the T1 transitions alone incur uniform deformation throughout the tissue (figure 5), and that rosettes produce only slightly larger tissue strain than T1, and are relatively few in our model predictions.
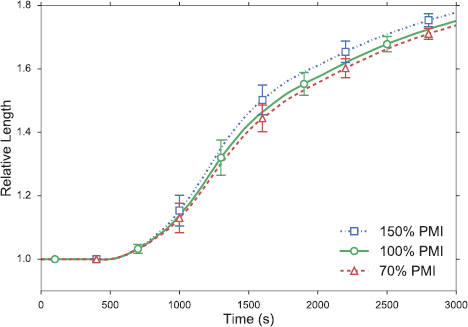
Finally, we discuss the effect of the 'extrinsic force' due to posterior midgut invagination (PMI) on germband extension [5, 6]. As explained in the SI (section S4), the PMI effect is imposed as a strain rate along the AP axis. If we use too low a strain rate in our model, the interior cells tend to develop concave shapes, possibly another symptom of the overly simple topological setup of the model tissue. This limits us to a relatively narrow range of variations for the PMI strain rate. Figure 10 shows that PMI contributes modestly to the total germband extension. With the PMI strain rate at 70% or 150% of the baseline value, the relative length at the end goes down by 0.8% or up by 1.5%, respectively. Thus, the model prediction is consistent with the consensus in the literature that germband extension is mostly due to cell intercalation, but tissue-level external forces also contribute to it [5, 6, 10].
Figure 10. Effect of the posterior midgut invagination (PMI) on germband extension. The legend shows variations in the PMI strain rate relative to the baseline rate (100%) given in section S4 of the SI.
Download figure:
Standard image High-resolution image
4. Conclusion
We present a mathematical model for cell intercalation during germband extension through two different mechanisms: T1 transition and rosette formation and resolution. Our model integrates the biochemistry of four protein species—Shroom, Rho-kinase, Bazooka and Myosin—with the mechanics of cell deformation and movement. It differs from prior vertex models for tissue deformation and morphogenesis in that we do not prescribe mechanical rules governing cell-cell interaction. Rather we predict the mechanical outcomes, e.g. cell deformation and rearrangement, from the polarization of signaling proteins and anisotropic contraction forces.
Thus, our model strives to integrate insights extracted from previous experimental observations to predict the various features of germband extension. In particular, we recapitulate the three stages of cell intercalation: stochastic polarization of Shroom leading to the development of PCP; anisotropy in myosin forces driving junctional contraction on the AP borders; and finally tissue-scale cell deformation and movement. Within the parameter ranges tested, the model predicts the following main results:
- (a)Planar cell polarity arises from a prescribed Shroom signal, with Rok and Myo-II localizing preferentially on AP edges and Baz on DV edges.
- (b)T1 transitions and six-cell rosettes take place stochastically, both in time and in space, throughout the simulation.
- (c)On average, a six-cell rosette transformation produces about 6% more tissue stretching than a four-cell T1 transition.
- (d)The germband tissue stretches in a spatially homogeneous fashion, with roughly uniform strain throughout the interior of the tissue.
- (e)Posterior midgut invagination makes cells at the anterior and posterior borders deform more than in the interior, but its overall contribution to tissue elongation is minor.
These model predictions are compared with experimental data. The degree of AP/DV polarity in forces and protein levels, the durations of AP contraction and DV elongation, and the amount of stretching for each T1 or rosette event are all in reasonable agreement with experimental observations.
However, the model under-predicts the total amount of tissue stretching by nearly 20%. This is because of the simplistic geometric setup of our model tissue. With a regular initial lattice of identical hexagonal cells, we pre-assign a limited number of AP edges, and cannot account for multiple rounds of T1 and rosette transformations as occur in vivo. Thus, the total number of T1 and rosette events are both much lower, on a per cell basis, than in vivo, and the total tissue stretching is too low.
We have noticed other symptoms of the geometric setup of the model tissue. With only 52 cells constrained by the forces posed on the edges, the cells are much more strongly coupled mechanically than in the real germband, which exhibits a good degree of fluidity in terms of the deformation and movement of the cells [34]. This artificial rigidity has several consequences. First, our cell edges do not rotate or align easily, and we cannot reproduce the aligned common edge as a precursor to rosettes, which is prevalent in vivo [9, 10], nor rosettes incorporating a larger number of cells. Instead, our six-cell rosettes are produced by an ad hoc scheme of elevating Shroom on nearby AP edges. Second, we cannot account for the progressive irregularization of the cell shapes as happens in reality [35]. Because of the regularity in the geometric setup, our cells typically return to perfect hexagons at the end. This tendency toward regularity also predisposes the cells to unrealistic shapes; they tend to become concave in the tissue interior, especially if the pre-tension is low. Third, the model does not allow neighboring or overlapping rosettes, as they frequently fail to resolve properly. A solution to this series of flaws requires a tissue with a much larger number of cells that are less strongly coupled mechanically and less constrained by the forces at the boundaries. In addition, we may need to account for the strain-induced myosin recruitment mechanism reported recently [10, 33] and also incorporate more realistic mechanics and rheology of the epithelium.
Finally, it is important to note that our model focuses on the action of junctional myosin, and models the medial myosin in a simplistic way. Biological evidence shows that medial myosin flow may be a key player in germband extension [36–38]. Besides, the model also neglects potential effects of the cephalic furrow formation, which may have exerted additional elongation along the AP axis, complementing the PMI. Nevertheless, by extending the model of Lan et al [24], we present an integrated biochemo-mechanical model that links mechanical deformation to the kinetics of signaling proteins. Although far from completeness and perfection, this continues the effort of coupling biochemistry and mechanics to understand and predict morphogenetic processes involving the deformation and movement of cells.
Acknowledgment
JJF and LCS acknowledge support from the Natural Sciences and Engineering Research Council of Canada (2014-05862). The research assistantship of LCS was also partially supported by the Work Learn Program at UBC. RF-G acknowledges support from the Natural Sciences and Engineering Research Council of Canada (418438-13), the Canada Foundation for Innovation (30279), the Ontario Ministry of Economic Development and Innovation (ER14-10-170), the Ted Rogers Centre for Heart Research TBEP Seed Program, and the Canada First Research Excellence Fund-University of Toronto Medicine by Design. RF-G is the Tier II Canada Research Chair in Quantitative Cell Biology and Morphogenesis.