


Abstract
Atom probe tomography (APT) has been increasingly used to investigate hydrogen embrittlement in metals due to its unique capacity for direct imaging of H atoms interacting with microstructural features. The quantitativeness of hydrogen measurements by APT is yet to be established in views of erroneous compositional measurements of bulk hydrides and the influence of spurious hydrogen, e.g. residual gas inside the analysis chamber. Here, we analyzed titanium deuteride (approx. 65.0 at%–66.6 at% D) in lieu of hydride to minimize the overlap with residual gas, both with laser pulsing and high-voltage (HV) pulsing. Strategies were deployed to prevent H pick-up during specimen fabrication, including preparing specimens at cryogenic temperature. The measured composition of deuterium by APT with laser pulsing decreases significantly with the applied laser pulse energy, which is interpreted with regards to the strength of the corresponding surface electrostatic field, as assessed by the evolution of charge-state ratio. In contrast, compositional analyses with HV pulsing are roughly independent of the applied experimental parameters, although approx. 15 at%–20 at% off the nominal composition. Aided by plotting paired mass-to-charge correlations, the mechanisms of composition bias in both pulsing modes are discussed. A special emphasis is placed on the local variations of the measured composition as a function of the local electric field across the specimen's surface, which is not uniform due to asymmetric heat distribution related to the localized laser absorption and the faceted nature of surface caused by the crystallographic structure. Our investigations demonstrate the challenges of quantitative analysis of solute deuterium by APT but nevertheless provide insight to achieving the best possible experimental protocol.
Export citation and abstract BibTeX RIS

Original content from this work may be used under the terms of the Creative Commons Attribution 3.0 licence. Any further distribution of this work must maintain attribution to the author(s) and the title of the work, journal citation and DOI.
1. Introduction
It is well documented that hydrogen has detrimental effects on a variety of metallic materials, including steels and nonferrous alloys, e.g. Ni, Al, Ti, Zr, Mg-based alloys. H either in solution, trapped at crystal defects [1, 2] or in the form of hydrides [3–5], has a distinct influence on mechanical properties of metals, such as ductility, strength, or toughness. Many mechanisms for hydrogen embrittlement such as HELP (Hydrogen-enhanced local plasticity), HEDE (Hydrogen-enhanced decohesion), AIDE (adsorption-induced dislocation-emission), HEVE (Hydrogen-enhanced vacancy embrittlement), hydride-induced cracking, etc, have been proposed [6]. However, precisely how H behaves within materials at the nanoscale remains mostly unresolved due to the experimental challenge in characterizing the H distribution within metals, in particular at specific microstructural features [7]. On the other hand, H is considered as a primary energy carrier and metal hydrides are promising candidates for hydrogen storage, where identification of the hydrides phases and quantification of H within hydrides are essential to estimate the hydrogen-storage capacity and investigate their thermodynamic stability [8–10]. Especially, for nanometer-sized hydride materials, which offer a potential path towards practical storage application, accurate characterization of the H composition and the structure of the hydride at the nanoscale is critical to determine the stability in terms of kinetics, thermodynamics, and capacity [11].
Atom probe tomography (APT), as a mass spectroscopy technique, has opened an access to characterize the H distribution within materials. APT is the only technique which can visualize the 3D distribution of the H at the sub-nanometer scale, in particular at microstructural features, e.g. precipitates [1, 2] or grain boundaries [5, 12]. However, the quantitativeness of H measurement by APT is yet to be established. Previous studies [5, 13] have shown that the measured hydrogen composition of hydrides, titanium hydride and zirconium hydride, differs from stoichiometry. This is a known issue in the APT analysis of many materials including carbides [14, 15], oxides [16–19], and nitrides [20, 21]. Besides, the H from the residual gas inside the analysis chamber brings additional challenges in quantifying the H originally within materials [22].
Stable stoichiometric hydrides can be used as reference phases to investigate the performance of APT towards quantitative analysis of solute hydrogen. The difficulty lies in distinguishing the actual solute hydrogen in the material from the residual hydrogen gas in the analysis chamber. Here, we used titanium deuteride produced by charging pure Ti with high purity deuterium gas D2, and applied strategies, including preparing specimens using cryogenic focused ion beam (cryo-FIB), to minimize H pick-up from environment during the specimen fabrication process. A systematic measurements of solute D composition in titanium deuteride was conducted in laser pulsing mode with laser pulsing energies (LPE) ranging from 5 pJ to 70 pJ, as well as in high-voltage (HV) pulsing mode with 10%–30% pulse fraction. The dependencies of D quantification with the various experimental conditions are interpreted with regards to the surface electrostatic field. We further discuss the mechanisms of the composition bias in both pulsing modes with respects to e.g. DC evaporation, dissociation producing neutral species, MCP detection efficiency. Special emphasis is placed on the local variation of the measured composition as a function of the local electric field across the specimen's surface, which varies significantly due to the inhomogeneity in the chemistry and structure of the specimen, the crystallographic structure on the specimen surface and the asymmetric distribution of the laser. Investigation of the composition bias under various experimental parameters offers useful references for the identification of hydride/deuteride by APT. More importantly, knowing the solute H/D evaporation behavior from the material under different electric field conditions globally as well as locally provides key information to investigate the hydrogen interaction with defects in metals, and better understand the different types of hydrogen embrittlement mechanisms.
2. Experimental
2.1. Materials
A stable deuteride was formed by gas charging on a grade 2 CP-Ti bulk samples, conducted in 0.5 MPa pure D2 atmosphere (purity 99.98%) at 600 °C for 6 h, followed by furnace cooling in D2 atmosphere. The phase components of the bulk sample after charging was examined by x-ray diffraction (XRD) on a Seifert Type ID3003 using a Co-Kα1 radiation (λ = 0.17890 nm), the result shown in figure 1. Titanium hydride/deuteride has been reported in forms of TiH (face-centered tetragonal, c/a > 1 [23]), TiH1.5-1.97 (face-centered cubic, c/a = 1 [24–26]), TiH1.92–1.99 (face-centered tetragonal, c/a < 1 [25, 27]), their diffraction patterns are shown as references in figure 1. The diffraction pattern of the deuteride agrees well with the face-centered tetragonal TiH1.92–1.99 (c/a < 1) reported by Yakel [25] and Crane et al [17], the lattice parameter is calculated as a = b = 4.463 nm; c = 4.36 nm, which suggests that the bulk CP Ti sample has transformed to TiD1.91–1.99 deuteride after charging, as also revealed by the phase map from EBSD measurement (the insets in figure 1).

Figure 1. XRD results of the deuteride formed by D2 gas charging method. The reference diffraction patterns of TiH (face-centered tetragonal, c/a > 1 [23]) in magenta, TiH1.5–1.97 (face-centered cubic, c/a = 1 [24–26]) in blue, TiH1.92–1.99 (face-centered tetragonal, c/a < 1 [25, 27]) in red are shown. The insets are the inverse pole figure (IPF) and phase map of the deuterided sample.
Download figure:
Standard image High-resolution image2.2. Strategies to control H pick-up from environment during specimen preparation
2.2.1. Lift-out from fresh fracture surfaces
We prepared the APT specimens by conducting the lift-out process on fresh fracture surfaces of the deuteride samples to avoid the possible H pick-up from water/acid solution used during mechanical grinding and polishing [28]. The lift-out process was carried out on a dual beam scanning electron microscope/focused ion beam (SEM/FIB) FEI Helios Plasma-FIB with a combination of voltage 30 kV and current 6–9 nA with the Xe plasma sources at ambient temperature.
2.2.2. Cryo-FIB preparation and cryo-transfer system
It has been reported that H could be easily introduced into Ti materials during conventional focused ion beam (FIB) milling conducted at room temperature [5, 28]. The possible sources of H inside the SEM/FIB could be the decomposition reactions of the hydrocarbon and moisture from the vacuum chamber, or of the organometallic precursor for Pt-chemical vapor deposition, stimulated by the energetic electron/ion beam. Our cryo-FIB technique has been proven to efficiently prevent undesired H pick-up into specimens during FIB milling by significantly decreasing H diffusivity [29]. Here, we thus applied the cryo-FIB technique for annular milling together with the cryogenic ultrahigh vacuum transfer system described in [30] for the subsequent sample transfer from the cryo-FIB to the atom probe instrument to avoid possible H/O ingress from air. Annular milling was conducted with 30KeV, 0.46 nA–24 pA Xenon plasma after the stage was cooled down to −135 °C. The final cleaning was done with 2 KeV, 24 pA Xe plasma at the same temperature.
2.3. Atom probe instrumentation
The composition of solute deuterium in titanium deuteride was measured on a Cameca LEAP 5000 XR and a LEAP 5000 XS atom probe systems, both with a 355 nm wavelength ultraviolet (UV) laser. As the Cameca LEAP 5000 XR system is equipped with a reflectron lens, which contains a field-defining mesh, the detection efficiency is around 50% and the flight path length is ∼382 mm. For the 5000 XS system, the straight flight path is fixed at 100 mm and the detection efficiency is approx. 80%. High voltage (HV) pulsing and laser pulsing were used for both systems. HV pulsing was conducted with various experimental parameters, pulse fractions ranging from 10%–30%, pulse rate 65–500 kHz, base temperature 25–50 K. Laser pulsing with various laser pulse energies (LPE) ranging from 5 pJ up to 70 pJ was carried out at a constant pulse rate, 200 kHz, and constant base temperature, 50 K. The detection rate in all experiments were held at 1 ions detected per 100 pulses and the pressure in the analysis chamber for either system was consistently below approximately 4 × 10⁻⁹ Pa.
2.4. Density-functional theory calculations
We employed density functional theory and coupled cluster theory calculations to obtain the ionization energies of some of the molecules and molecular ions observed in our analyses, as indeed, most of those values are not tabulated. The geometries of each molecule or molecular ion were optimized using B3LYP functionals. Then, using the ground state structure for each molecule, we calculated their ionization energies using the coupled cluster method with quadruple-zeta basis sets augmented with diffuse functions. All calculations were performed using the Gaussian09 software package [31].
3. Results
3.1. Mass spectra
To investigate the APT performance with regard to quantification, the first important aspect is to appropriately identify the peaks in the mass spectrum [32, 33]. Figure 2 shows three typical mass spectra, each containing 0.5–1 × 10⁶ identified ions, with (a) HV pulsing and (b) laser pulsing at 10 pJ and (c) 70 pJ, respectively, obtained from the same APT specimen. The mass resolution with laser pulsing is better than with HV pulsing. The signal-to-background levels at high laser pulse energy (70 pJ) appears much higher than with HV pulsing and at lower laser pulse energy (10 pJ).
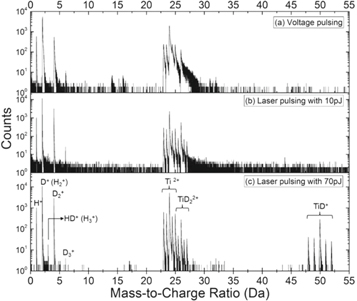
Figure 2. Mass spectra of 1–1.5 mill. ions obtained with (a) HV pulsing and (b) laser pulsing at 10 pJ and (c) 70 pJ from the same specimen.
Download figure:
Standard image High-resolution image3.1.1. H/D ions
Given that H ingress into the specimen was minimized (see section 2.2), the H+ ions at peak 1 Da are attributed mainly originating from the residual gas in the analysis chamber. The amount of H+ ion is more than one order of magnitude less than that of the total ions at 2 Da, which corresponds to the sum of D+ and H2+ ions. The proportion of H2+ ions at 2 Da, roughly calculated by simply assuming that the ratio of H+/H2+ is approximately equal to D+/D2+, is within a range of 1%–3% depending on experimental conditions. This may seem as a strong assumption as the strength of the electric field encountered by D and H2 can be different. The D clearly originates from the specimen surface, and so does a fraction of the H2 that is adsorbed on the surface, however likely less tightly bonded to the surface. Both encounter a similar range of electric fields. H2 could also be ionized at a distance above the specimen's surface, as described before for field ion microscopy [34, 35], and hence at a relatively lower electric field. Early work by Müller and co-workers suggested that most of the gaseous species detected during pulsed evaporation originate from the adsorbed atoms and molecules [36]. It implies that the detected D+/H+ and D2+/H2+ encounter a similar range of electric fields, thereby supports the above assumption. Considering the amplitude of the H peak, variations in the H+/H2+ ratio would be expected to have a small influence (less than 1 at%) on the quantification of D, since the overall composition of D is higher than 35 at% as revealed below.
A small peak at 3 Da, more obvious at 70 pJ laser pulsing, is ascribed as mainly HD+, not H3+, considering the very small amount of D3+ in the peak at 6 Da. The peak at 4 Da is considered to stem solely from D2+ and not from H4+, given that no quadruple ions D4+ occurs at peak 8 Da, and H4+ was never reported even under much high H-partial pressures [37].
3.1.2. Ti/TiHx/TiDx ion species
Peaks ranging from 23–27 Da in all the mass spectra shown in figure 2 are overlaps between Ti, TiHx and TiDx ions, except for 46Ti2+ at 23 Da and 50TiD22+ at 27 Da, if we consider that there are no impurity elements e.g. V and Cr in the base material. We implemented an automated peak decomposition procedure, using the natural isotopic abundances of Ti described in [38]. The background is subtracted prior to performing this procedure. A typical decomposition result for the peaks between 23–27 Da in the mass spectrum obtained from an analysis with 10 pJ is displayed in the form of a histogram shown in figure 3. The attribution to TiH22+ or TiD2+ only slightly changes the measured composition of H and D due to their low relative fraction, i.e. within 0.5–1.5 ion.%.

Figure 3. Typical decomposition result from the peaks ranging from 23–27 Da in the mass spectrum obtained at 10 pJ.
Download figure:
Standard image High-resolution image3.2. Overall composition
Chemical composition measurements of titanium deuteride were conducted with both HV pulsing and laser pulsing in both the Cameca LEAP 5000 XR and the LEAP 5000 XS atom probe systems. Specimens were kept under cryogenic conditions, below 135 K, in high vacuum in the SEM/FIB chamber during sample preparation and in the APT analysis chamber during measurement. Thereby, the potential loss of D in the deuteride during the entire process is neglected as titanium dideuteride is chemically stable in the range of 70–400 K [25].
3.2.1. High-voltage (HV) pulsing
Previous studies have shown that the measured H composition in titanium hydride by APT with HV pulsing was 10 at%–15 at% less than the value expected from the stoichiometry given by the bulk phase diagram [5, 13]. In an attempt to optimize the experimental parameters to obtain an average composition close to the stoichiometry of the compound, we conducted series of measurements with HV pulsing by varying experimental parameters, such as pulse frequency, base temperature, pulse fraction, etc, while other parameters were kept constant. Each measurement contained approx. 1.5 million ions. The experiments with varying pulse frequencies were conducted on both a Cameca LEAP 5000 XR and a LEAP 5000 XS atom probe. Figure 4 shows the measured compositions as functions of (a) pulse fraction; (b) pulse frequencies; and (c) base temperature. According to the stoichiometry of TiD1.91–1.99 deuteride, the nominal composition of D is 66 ± 0.5 at%, shown by light violet bands. The measured D fractions in all experiments are consistently within the range of 46 at%–50 at%, approx. 15 at%–20 at% lower than the theoretical stoichiometry. Changing experimental parameters does not affect the measured chemical composition in HV pulsing mode for the Cameca LEAP 5000 XR and the LEAP 5000 XS. The fraction of multiple hits with HV pulsing is in the range of 55%–65%, under all applied experimental parameters. The underlying mechanisms causing the loss of D with HV pulsing will be discussed below.

Figure 4. Measured composition of the Ti-deuteride compound with HV pulsing under different experimental parameters: (a) pulse fraction; (b) pulse frequencies; (c) base temperature. The detection rate is 10 ions per 1000 pulses. The range of the nominal D composition shown in light violet band (same for all composition profiles in below). Data obtained from the LEAP 5000XR are labeled in circles (●) and from the LEAP 5000XS in upper triangles (Δ).
Download figure:
Standard image High-resolution imageFor direct comparison between such series of measurements on different APT specimens and different instruments, the results are plotted as a function of the charge state ratio of Ti, Ti3+/Ti2+. The charge-state ratio reflects the surface electric field strength according to the post-ionization theory introduced by Kingham [39] and has been used to assess changes in experimental conditions in multiple studies [40–42]. As shown in figure 5, the measured composition of titanium deuteride with HV pulsing does not change with the surface field in this range. It is also evident that the surface field varies only in a small range under all the applied analysis conditions with HV pulsing while maintaining a satisfactory yield of successful runs.

Figure 5. Measured compositions from different experiments as a function of the ratio, Ti3+/Ti2+. Data obtained from the LEAP 5000XR are labeled in circles (●) and from the LEAP 5000XS in upper triangles (Δ).
Download figure:
Standard image High-resolution image3.2.2. Laser pulsing
The laser pulse energies (LPE) was repeatedly changed from 5 to 70 pJ, as shown in the inset in figure 6. We changed the experimental parameters each time after ∼1.5 million ions were detected. Measurement with HV pulsing on the same tip was performed for comparison. The measured D fractions with HV pulsing are within the range of 46–50 at%, same as the results shown in figure 5. However, the chemical compositions measured with laser pulsing varies significantly with the LPE, see in figure 6. The D composition is higher than the stoichiometry at lower LPE and lower at higher LPE.
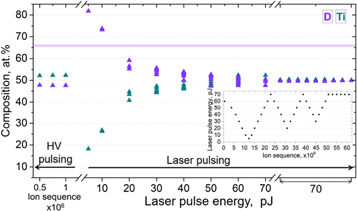
Figure 6. Chemical composition of the same specimen measured with both HV pulsing and laser pulsing at various laser pulse energies in the LEAP 5000XS.
Download figure:
Standard image High-resolution imageHowever, the LPE cannot be used as a reliable parameter to directly compare the measurements on different specimens and on different instruments as it is related to the standing voltage, specimen geometry and the conversion of the laser illumination into a thermal pulse [43, 44]. Instead, the surface field, reflected by the charge-state ratio of metallic elements, has often been used for direct comparison between experiments in the cases of compounds such as GaN, ZnO, etc [19, 20]. However, in our experiments, only one charge state of Ti, i.e. Ti 2+, appears at all applied LPE, as readily visible in the mass spectra shown in figure 2. Meanwhile, the relative amount of two molecular ions vary with the LPE, TiD22+ decreasing and TiD+ increasing with the increase of the LPE. In order to find a ratio that would reflect the variations of the electric field, we tried several combinations of atomic and molecular ions and charge-states that were typically detected in each dataset. We decided to use the ratio of (TiD22+ + Ti2+)/TiD+ to trace the magnitude of the electric field with rather high sensitivity and sufficient counting statistics to ensure accuracy.
To support our choice, we applied the theory, introduced by D R Kingham, to estimate the relative ionization probability of the different atomic and molecular ions observed here, in a similar approach to [21]. We assumed that the ionization energies of D were similar to those of hydrogen. We used a value of the work function of 3.9 eV for TiH2, reported by Fokin et al [45]. The values of the ionization energies for D, D2 and Ti are tabulated in [46]. For TiD and TiD2, the first and second ionization energies were calculated using coupled cluster theory, as listed in table 1.
Table 1. First and second ionization energies for TiH and TiH2 obtained from coupled cluster calculations.
| Species | 1st ionization energy | 2nd ionization energy |
|---|---|---|
| TiH | 7.63 eV | 15.33 eV |
| TiH2 | 8.91 eV | 16.39 eV |
These values are similar to those typically used in the literature to calculate post-ionisation probabilities [39] and correspond to ionization from the ground state, without accounting for the intense electrostatic field. This is expected to be valid to a first approximation, although the electronic states of the field evaporated ions are affected by the intense electrostatic field [47]. Following Kingham's approach [39], the probability for ionization and post-ionization were calculated as a function of the electric field, as plotted in figure 7(a). The probability of transition between the 0 and +1 charge states are indicted by disk symbols, that for +1 to +2 as diamonds, and the transition from +2 to +3 as squares. The lines serve only as guides to the eye. The color code for the different atomic or molecular ions is given in the legend. The probability that TiD+ post-ionizes into TiD2+ and TiD21+ into TiD22+ become significant at fields only slightly higher than the field necessary to start post-ionizing Ti1+ into Ti2+, approx. 12 V nm−1, 14 V nm−1 and 10 V nm−1, respectively. Considering these small differences, the selected ratio (TiD22+ + Ti2+)/TiD+ can be considered a good proxy for the charge-state ratio of Ti. Figure 7(b) shows the calculated ratio of (Ti2+ + TiD22+)/TiD+ as a function of the LPE. The ratio decreases as the LPE increases, and the trends hold for all the measurements in both the Cameca LEAP 5000 XR and LEAP 5000 XS instruments.
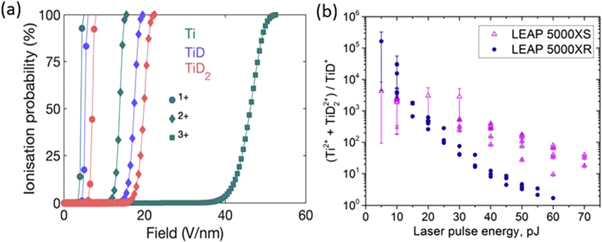
Figure 7. (a) Ionization probability as a function of the electric field for Ti, TiD and TiD2. Colors correspond to different species, symbols to the first, second and third ionization events, as reported in the legends. (b) The ratio, (Ti 2+ + TiD22+)/TiD+ as function of laser pulse energies. Data obtained from the LEAP 5000XR are labeled in circles (●) and from the LEAP 5000XS in upper triangles (Δ).
Download figure:
Standard image High-resolution imageFigure 8 shows the evolution of Ti and D composition as a function of the (Ti2+ + TiD22+)/TiD+ ratio measured in both instruments. Generally, the D composition tends to increase with increasing surface electric field, similarly to other compounds composed of metallic and non-metallic elements, where the compositions of the non-metallic elements increase with the increasing surface field [19, 20]. At low field (high LPE), the measured D compositions in both the LEAP 5000XR and the LEAP 5000XS atom probes are lower than the nominal value defined by the stoichiometry of TiD1.91–1.99 deuteride, and increase as the field increases in the same trend. Under high electrostatic field conditions, a significant difference between the chemical compositions measured in the two instruments can be observed. For the analysis in the LEAP 5000XR atom probe system, the D composition at high field (low LPE) is around 50 at%, still lower than the nominal value from the stoichiometry of TiD1.91–1.99 deuteride. However, the D composition measured in the LEAP 5000XS at high field (low LPE) reaches up to 80 at%, a value significantly exceeding the nominal value. It is critical to note that the background level of the measurements in the LEAP 5000XS dramatically increases at high field (low LPE) regime, as shown in figure 8(c). The possible mechanisms for such composition bias observed from the measurements with laser pulsing in the LEAP 5000XS system will be discussed below in view of the mass-to-charge correlations observed at different evaporation field conditions. The difference between the measurements in the two atom probe systems will be discussed as well.

Figure 8. Measured compositions of D and Ti, and the background level as a function of the ratio, (Ti 2+ + TiD2 2+)/TiD + for the measurements with laser pulsing mode. (a) Data obtained from the LEAP 5000XS labeled in upper triangles (▲), (b) from the LEAP 5000XR, labeled in circles (●), and (c) showing the fraction of backgrounds for both instruments.
Download figure:
Standard image High-resolution imageThese trends do not hold in some cases where the specimen's shape changes significantly during the measurements. As shown in figure 9, when the LPE was high (30–60 pJ), significant surface diffusion occurred, evidenced by the disappearance of crystallographic features on the detector maps, shown in case 1. When decreasing to low LPE values (10–20 pJ), the detector maps were inhomogeneous with less hits on the laser-oriented side and more hits on the shadow side, see case 2. The cases where neither surface diffusion nor inhomogeneous evaporation occurred, referred as valid measurements shown in black, follow the trends in figure 8(a), e.g. case 3 and case 4. Case 3 is the data obtained with high LPE/low field, while case 4 is obtained with low LPE/high field. Although the detector hit maps in case 1 and case 2 indicate an abnormal evaporation behavior during the measurements, the mass spectra appear similar to other valid measurements, e.g. cases 3 and 4, respectively. The resulting chemical compositions are highly biased from the nominal value of TiD1.91–1.99 deuteride as well. Therefore, adjusting the analysis parameters with laser pulsing by tracking the value of the charge state ratio, (Ti2+ + TiD22+)/TiD+, in order to obtain a global average stoichiometry may only work when combined with a careful examination of the detector hit map.

Figure 9. Situations of surface diffusion (case 1, the resulting D/Ti ratios in orange) and inhomogeneity evaporation (case 2, the resulting D/Ti ratios in pink) across the specimen surface with laser pulsing. The detector histograms and the corresponding mass spectra of the two abnormal situations (case 1 and case 2), as well as those of the valid dataset (case 3 and case 4, the resulting D/Ti ratios in black) with similar analysis parameters, are shown. The theoretical D/Ti ratio of TiD1.91–1.99 is labeled by the grey band. The color legends represent the total ion density, increasing from blue to red. All data were obtained in LEAP 5000XS under laser pulsing mode. Laser direction is from top left corner, label with (*).
Download figure:
Standard image High-resolution image3.3. Spatial detection resolution as a function of the local surface electric field
In cases of semiconductor compounds, e.g. GaSb [48], GaN [49], it has been pointed out that not only is the measured global composition highly dependent on the experimental parameters, but also the local composition may be inhomogeneous across the tip surface. It is related to the inhomogeneity in the chemistry and structure of the specimen, the crystallographic structure of the tip surface or the asymmetric distribution of the heat generated subsequent to the absorption of the laser light. Here, in order to establish a dependence of the locally measured composition of titanium deuteride on the local surface electric field, we conducted microscopic compositional analysis by sampling the detector projection into pixels in datasets obtained with both HV pulsing and laser pulsing (on the LEAP 5000 XS, LPE = 70 pJ). A certain number of ions within each pixel is required to obtain valid compositional statistics, hence datasets containing more than 10 million ions were used. The composition within each pixel is analyzed by applying the same deconvolution protocol as used for the global composition analysis, described in section 3.1. The local surface field is reflected by the local charge state ratio calculated for each pixel, (Ti 2+ + TiD22+)/TiD+ for laser pulsing and Ti3+/Ti2+ ratio for HV pulsing. In figure 10, we show that the distributions of the local field strength are non-uniform across the specimen surface, with a clear influence of the laser illumination direction and the crystallographic features, revealed by the 2D maps of the charge-state ratios in figure 10(a) with laser pulsing and figure 10(c) with HV pulsing.
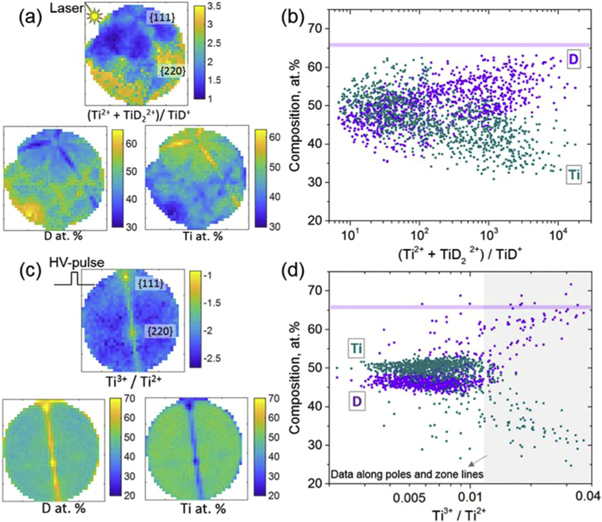
Figure 10. 2D spatial distribution of the local surface field and the local chemical composition measured with (a) laser pulsing at 70 pJ and (c) HV pulsing. The profiles of the local D and Ti atomic fractions as a function of the local field strength obtained with (b) laser pulsing at 70 pJ and (d) HV pulsing.
Download figure:
Standard image High-resolution imageFor laser pulsing, generally, the surface field is lower on the side where the laser beam hits the specimen (indicated by a yellow star symbol in figure 10(a)), referred to as laser side, and higher on the opposite shadow side. Slightly higher local field appears along the crystallographic pole associated with the {111} planes and the zone lines on the laser side. Meanwhile, the spatial distribution of the measured composition appears inhomogeneously related to the direction of the incident laser and the crystallographic features, as revealed by the 2D maps of the D and Ti composition in figure 10(a). The microscopic relationship between the locally measured composition and the local surface electric field with laser pulsing, as shown in figure 10(b), follows a similar trend as the overall composition with respect to the field strength revealed before in figure 8(b): the D composition increases as the local field strength increases, although with large fluctuation. Therefore, in laser pulsing mode, optimizing experimental parameters in order to achieve a composition corresponding to the stoichiometry of the compound is not recommended, since the local surface field is not uniformly distributed and the local composition is not homogeneous.
In HV pulsing mode, the local surface field and the local compositions measured are more homogeneous except at poles and along the zone lines, where the local D composition increases substantially associated with the locally enhanced field strength. The crystallographic directions, here [111] and [220], seem to have no significant influence on the distribution of the local surface field and the local composition measured in HV pulsing mode. The faceting in HV pulsing mode is not as pronounced as in laser pulsing mode, where a higher temperature likely increases differences in the field evaporation behaviour of different facets [50–53].
4. Discussion
Our results demonstrate that the measured D composition of titanium deuteride by APT is strongly influenced by experimental parameters. With HV pulsing, the measured D composition is approx. 15–20 at% lower than the nominal value, defined by the stoichiometry of TiD1.91–1.99 deuteride, over the entire range of analysis parameters tested here. With laser pulsing, the global composition of titanium deuteride varies significantly with the LPE and the enhanced faceting of the specimen causes significant variations in local composition across the field-of-view. It is generally recognized that non-metallic compounds exhibit a complex field evaporation behavior, e.g. dissociation of metastable molecular ions after field evaporation [54], neutral atoms or molecules generation [21], field-assisted or thermal diffusion [43, 55, 56], and preferential evaporation due to the different threshold fields of ionization for metallic and non-metallic elements[20, 57]. In the following, the mechanisms of quantification errors under different experimental conditions will be discussed with respect to the different field evaporation behaviors.
4.1. Mechanisms of composition bias with laser pulsing
The possible mechanisms of composition bias with laser pulsing at low field and high field will be discussed separately by plotting paired mass-to-charges of ions detected within the same pulse (multiple events). These are akin to the correlation histograms, except that each possible pair is plotted as a single point that is colored according to the spacing between the detector impacts, thereby adding some additional information to the technique introduced by Saxey [54].
4.1.1. Dissociation at low field/high laser pulse energy
Figure 11 shows parts of the correlation plots generated from a dataset with approx. 45 million ions obtained in the LEAP 5000XS at 70 pJ (high LPE, low field). The correlated evaporation of (Ti2+, H+), (Ti2+, D+), (Ti2+, D2+) pairs, shown in blue curved lines in figure 11(a), contribute to the background. The dissociation tracks involving H+, D+, D2+ ions are enlarged in figure 11(b), where the corresponding dissociation paths are labeled. Two dissociation tracks generating neutrals are observed in figure 11(c), corresponding to the following two dissociation pathways:


Figure 11. (a) The correlation plots of datasets acquired at low field (high LPE) in the LEAP 5000XS showing the tracks of dissociation reactions and DC evaporation, of which the blue curved lines correspond to the correlated evaporation of (Ti2+, H+), (Ti2+, D+), and (Ti2+, D2+) pairs, which contribute to the background. The color legend represents the distance between simultaneous impacts on the detector. The dissociation tracks involving H+, D+, D2+ ions are enlarged in (b), where the corresponding dissociation reactions are labeled. The dissociation reactions producing D2 neutrals are highlighted in (c).
Download figure:
Standard image High-resolution imageAs pointed out by Gault et al [21], when the surface field is low (high LPE), the neutral products generated from dissociation of molecular ions are unlikely to be further ionized. Therefore, being only accelerated during its flight as a part of the original parent ion, their kinetic energy may be insufficient to trigger the microchannel plates and hence be detected. Neutrals from dissociation are hence likely responsible for the significant D loss at low field. This also explains that the measurements conducted on reflectron-fitted instrument (LEAP 5000XR) produce even lower D composition at low field since neutrals cannot be 'reflected' and never reach the detector.
4.1.2. Significant DC evaporation at high field/low laser pulse energy
At low LPE (high field), significant DC evaporation is revealed by the blue curved lines in figure 12(a), including the continuous correlated evaporation of (Ti2+, H+), (Ti2+, D+), (Ti2+, D2+), (H+, D+), (Ti2+, Ti(H, D)x2+) pairs labeled, which cannot be identified in the mass spectrum. This explains the dramatic increase in the fraction of background as the surface field increases, as shown in figure 8(c). The significant loss of Ti at high field can be partly attributed to the DC evaporation of (Ti2+, H+) pair, more importantly, of (Ti2+, D+) pair as it affects the stoichiometry (Ti : D = 1 : 2). The dissociation of molecular ions generating H+, D+ and D2+ ions appears not significant at high field, as shown in figure 12(b), however, dissociation of TiD22+ ions producing neutrals, D2, is notable, as shown in figure 12(c), which indicates D is lost at high evaporation field as well.


Figure 12. Correlation plots of datasets acquired at high field (low LPE) in the LEAP 5000XS showing the tracks of dissociation reactions and significant DC evaporation of (Ti2+, H+), (Ti2+, D+), (Ti2+, D2+), (H+, D+), (Ti2+, Ti(H, D)x2+) pairs, as labeled in (a). The color legend represents the distance between simultaneous impacts on the detector. (b) Dissociation tracks generating Ti+, D+. (c) Indication of the dissociation of TiD22+ ions producing neutrals, D2.
Download figure:
Standard image High-resolution imageThe Ti composition at high field measured in the LEAP 5000XR is significantly higher than in the LEAP 5000XS. The reflectron in the former will enable correction of the time-of-flight of many Ti ions that appear off their actual time-of-flight because of possible losses of energy caused by a dissociation event [58]. The reflectron cannot correct for the delayed field evaporation that can be ascribed to different sources. First, the duration of the thermal pulse generated subsequent to absorption of the laser pulse is difficult to control, as it depends on the actual geometry of the specimen and its relative size with respect to the wavelength of the laser light [44, 59]. In addition, the temperature will rise on the illuminated side of the specimen first, and after a certain delay, homogenize across the specimen section before flowing down the shank of the specimen [60, 61]. As heat transfer is dependent on the heat gradient, an illumination with a lower intensity laser results in a relatively smaller increase in temperature, and hence likely the pulse duration is relatively longer, which could result in a wide spread of the time at which the ions are emitted from the specimen. Second, this will combine with a likely enhanced probability of correlated evaporation [62, 63]. Indeed, the atoms left on the surface of the specimen after one of their neighbors has been field evaporated are likely in an unstable and hence unfavorable state, which makes them more likely to field evaporate shortly afterwards, either within the same pulse or in the subsequent pulses [62]. The local rearrangements of the electrostatic field following a field evaporative event evidenced by field ion microscopy [63] may also play a significant role here, as they likely involve the displacement of charges that may not be fast or easy on covalently bonded compounds. This could also explain the long delays observed in the field evaporation of both Ti and D seen in figures 12(a) and (c). The relative importance of the delay decreases as the time of flight increases, making them less problematic on the reflectron-fitted instrument.
4.2. Mechanisms of composition bias with HV pulsing
The use of HV pulsing prevents issues related to the laser illumination that lead to strong faceting of the surface and hence an inhomogeneous distribution of the electric field, which causes composition biases across the field-of-view. However, the measured D composition in all experiments with HV pulsing over a wide range of experimental parameters, are approx. 15–20 at% below the expected stoichiometry. The fraction of ions from multiple events with HV pulsing is extremely high, 60%–65% for the LEAP 5000XR and 70%–75% for the LEAP 5000XS. The difference between instruments is likely caused by the lower fraction of the ions reaching the detector because of the grids along the flight path on the reflectron-fitted atom probe [64]. The major source of multiple hits is the correlated evaporation both in time and in space [62]. The typical correlation plot for datasets acquired with HV pulsing in the LEAP 5000XS are shown in figure 13, where no dissociation tracks were observed but only the horizontal/vertical lines and the slightly curved tails with positive slope. This indicates that the extremely high fraction of multiple hits mainly consists of the simultaneous evaporation of (Ti2+, H+), (Ti2+, D+), (Ti2+, D2+), (H+, D+), (H+, D2+) and (D+, D2+) pairs as labeled on the slightly curved lines in figure 13, and the evaporation of one ion, e.g. H+, D+, D2+or Ti2+, during the pulse, followed by the evaporation of a second ion at some time after the pulse, evidenced by the horizontal and vertical lines at 1 Da, 2 Da, 4 Da and 23–25 Da in figure 13.
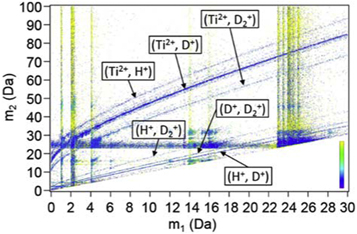
Figure 13. Typical correlation plots of datasets acquired with HV pulsing in the LEAP 5000XS. The color legend represents the distance between simultaneous impacts on the detector, same as figure 12.
Download figure:
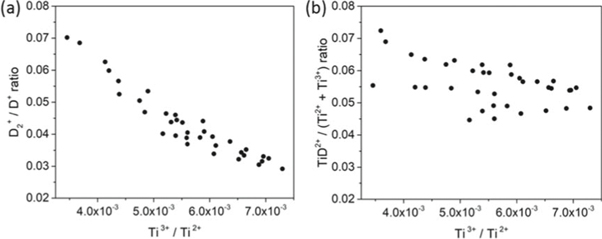
Standard image High-resolution imageD loss, approx. 15–20 at% below the expected stoichiometry, can be partly attributed to the delayed co-evaporation of (H+, D+), (H+, D2+), (D+, D2+) pairs. Although no dissociation tracks can be observed in the correlation plots, the decreasing D2+/D+ ratio and TiD2+/(Ti2+ + Ti3+) ratio with the surface field, as shown in figures 14(a) and (b), indicate the two possible reaction paths of the field-induced dissociation and post-ionization, which are listed as follows:


Figure 14. Measured (a) D2+/D+ ratio and (b) TiD2+/(Ti2+ + Ti3+) ratio as a function of surface field with HV pulsing (note that here the ratios are displayed in linear scale conversely to the other figures).
Download figure:
Standard image High-resolution image
It is highly possible that the dissociations of molecular ions, e.g. D2+ and TiD2+, happen very early during its flight due to the very high electric field close to the specimen surface, thus the daughter ions, e.g. D+ and Ti2+, will be nearly fully accelerated and finally arrive the detector with times-of-flight close to that expected for those ions originating from the specimen's surface. At high electric field, the two deuterium ions originating from the dissociation of D2+, or closely located on the specimen's surface and emitted on the same pulse may hit the detector too close in space and time to be detected both, and are registered as a single event due to the ion pile-up effects of the detector [58], causing the additional loss of D. Another important source responsible for the loss of D is the neutral products that do not get ionized, their trajectories might make them fall outside the field of view or their kinetic energy is likely insufficient to trigger the detector [21].
4.3. Influence of the local surface electric field on the local H/D composition variation --- General remarks on observing the local H/D distribution at microstructural features by APT technique
The local dependencies of the measured D composition with laser pulsing (in figures 10(a) and (b)) clearly reveal that the local variation of the surface electric field could artificially cause a significant variation of the measured local D composition. This artificial variation makes the qualification and quantification of the local H/D distribution by APT much more challenging. Near or at microstructural features, e.g. precipitates, interfaces, etc, the local field evaporation conditions may vary significantly due to the inhomogeneity of the local chemistry and structure. Hence the observed local changes in the H/D distribution might be induced by the variations of the local surface electric field, instead of the actual H-enrichment or depletion. Moreover, the spatial resolution can be significantly degraded by the severe surface diffusion and inhomogeneous evaporation associated with asymmetric laser absorption. Therefore, application of the APT technique with laser pulsing to investigate the interaction of H/D with crystalline defects at nano-scale will be highly challenging.
In contrast, the local D composition measured with HV pulsing is much more homogeneous, except along the crystallographic features in the detector hit maps, i.e. poles and zone lines, as shown in figures 10(c) and (d). The measured D composition with HV pulsing, although approx. 15–20 at% less than the nominal value, is independent of the global and local field evaporation conditions. Therefore, to investigate the hydrogen interaction with microstructural features by the APT technique and obtain reproducible results, HV pulsing mode is highly recommended.
5. Conclusions
We conducted a systematic investigation of the dependence of solute H, here D, quantification on the evaporation conditions with both laser pulsing and HV pulsing by using titanium deuteride produced by charging pure Ti with high purity deuterium gas D2.
- (1)With HV pulsing, the measured D compositions in both the LEAP 5000XS and LEAP 5000XR atom probe systems remain within a range of 46–50 at%, which is approx. 15 at% lower than the theoretical stoichiometry. Varying analysis parameters, such as pulse frequencies, base temperature, pulse fraction, etc, does not help to achieve a global average stoichiometry. D+ ion pile-up effect of the detector are probably the main causes for the D loss.
- (2)With laser pulsing, the measured compositions vary remarkably with the evaporation conditions in both atom probe systems. In the low field regime (high LPE), the D fractions are significantly lower than the nominal value in both instruments, and increase with the surface electric field in the same trend. In the high field regime (low LPE), the measured D compositions in the LEAP 5000XS increase dramatically and reach up to 80 at%, while the D compositions measured in the LEAP 5000XR remain below the stoichiometry. The above trends do not hold when the tip shape changes significantly and severe surface diffusion occurs during the measurements. Neutral generation and preferential evaporation of Ti are considered to be responsible for the D loss at low field regime (high LPE) and Ti loss at high field regime (low LPE), respectively.
- (3)The microscopic chemical composition analyzed with laser pulsing is inhomogeneous and varies greatly with the local surface field due to the asymmetric laser illumination and inhomogeneous crystallographic structure of the tip surface. But with HV pulsing, the locally measured composition is much more homogeneous across the tip surface except along the crystallographic features.
- (4)For future application in imaging the local H/D distribution within microstructural defects in metals by APT, HV pulsing is recommended since the composition measurement is independent of the analysis parameters and specimen geometry both globally and locally.
Theoretical efforts are required to investigate the different evaporation behavior between H/D and metallic elements under electric field and further understand the physical mechanisms leading to the erroneous composition measurements of metal hydride/deuteride.
Acknowledgments
Uwe Tezins & Andreas Sturm for their support to the FIB & APT facilities at MPIE. YC is grateful to the China Scholarship Council (CSC) for funding of PhD scholarship. LTS and BG acknowledge financial support from the ERC-CoG-SHINE-771602. IM, LTS, AS, BG acknowledge funding from the MPG & BMBF through the Laplace Project. MA is grateful for funding through the Big Max network of the Max Planck Society.