


Abstract
It is demonstrated how a many-body system far from thermal equilibrium can exhibit universal dynamics in passing a nonthermal fixed point. As an example, the process of Bose–Einstein (BE) condensation of a dilute cold gas is considered. If the particle flux into the low-energy modes, induced, for example by a cooling quench, is sufficiently strong, the Bose gas develops a characteristic power-law single-particle spectrum  , and critical slowing down in time occurs. The fixed point is shown to be marked by the creation and dilution of tangled vortex lines. Alternatively, for a weak cooling quench and particle flux, the condensation process runs quasi-adiabatically, passing by the fixed point in the far distance, and the signatures of critical scaling remain absent.
Export citation and abstract BibTeX RIS

Content from this work may be used under the terms of the Creative Commons Attribution 3.0 licence. Any further distribution of this work must maintain attribution to the author(s) and the title of the work, journal citation and DOI.
1. Introduction
Systems like a ferromagnet or a bosonic quantum gas can undergo a second-order phase transition in the Ehrenfest classification, at which their relevant physical properties become independent of microscopic details. This independence leads to the concept of universality, which has become extremely successful in classifying and characterizing matter in thermal equilibrium. Many different phenomena can be characterized in terms of a few classes governed by the same critical properties. Generalizing this concept to universal dynamics far away from thermal equilibrium requires us to develop an understanding of the structure of the space of possible nonthermal states. In addition to the well-known dynamics near thermal fixed-points [1], critical regions such as fixed points, critical lines, and surfaces can affect the evolution far from equilibrium. When a closed system approaches such critical configurations, memory about its particular initial state would be partially lost. Critical slowing down in the actual time evolution would be observed since the largest scales, not only in space but also in time, dominate the system dynamics. Thermal states are attractive, stable fixed points in this framework. Different systems would be related by means of the universality class that their dynamical evolution falls into. Predictions for the behavior of very different physical systems could be obtained on the basis of comparatively few exemplary measurements. When looking at fundamental science applications, this could link the dynamics observed in very different contexts.
Here we show that such universal time evolution is possible, using the example of a strongly shock-cooled three-dimensional normal-fluid Bose gas, which approaches a non-thermal fixed point [2, 3] before it eventually proceeds to a thermal distribution below the BE critical temperature. The cooling quench puts the system far out of equilibrium so that it can undergo an evolution passing the vicinity of a critical point, where it gets stuck for a long time due to the critically enhanced role of ultra-low-energy modes. Looking at the critical configuration in real space, we find it to be dominated by a dilute ensemble of quasi-topological vortex line defects, which only very slowly decay via interactions with sound.
The formation of a Bose–Einstein condensate (BEC) from a disordered state has been the subject of many studies [4–23]. Among other aspects, the role of superfluid turbulence in this process has been discussed [6–8, 17, 19]. BE condensation in a nonequilibrium undercooled gas can have the characteristics of a turbulent inverse cascade [6, 7, 17].
In this article, we demonstrate how the superfluid turbulence period is set into the context of universal dynamics. Depending on whether the condensation evolution passes close to or further away from a nonthermal fixed point, the process appears in qualitatively different forms (figure 1).

Figure 1. Depending on the strength, α, of an initial cooling quench, the gas can thermalize directly to a Bose–Einstein condensate, or it can first approach and critically slow down near a nonthermal fixed point (NTFP). Therefore, it is characterized by a self-similar particle spectrum,  , and a diluting ensemble of vortex rings that are growing in size.
Download figure:
Standard image High-resolution image2. The dynamics of Bose–Einstein condensation
2.1. Adiabatic versus turbulent condensation dynamics
Suppose we start with a cold, dilute, incoherent homogeneous gas in three dimensions, at a temperature above the BEC phase transition. Let us apply a cooling quench to this gas by removing particles from the high-momentum tail of the distribution and suppose that, appropriate collisions provided, the system re-equilibrates to thermal equilibrium. The final temperature is then given by the total energy after the quench, which we assume to be below the BEC critical temperature. We note that the question of whether a system can thermalize at all [24] can be addressed by exloring which types of stable attractors exist.
Two different scenarios are possible: If a sufficiently small amount of energy is removed, the subsequent scattering of particles into the low-energy modes builds up a thermal Rayleigh−Jeans distribution,  , in a quasi-adiabatic way. The chemical potential increases, and a fraction of particles is deposited in the lowest mode, forming a BEC. During this process, tangles of defect lines can be found in the Bose field by filtering out short-wavelength fluctuations [17].
In the second scenario, given a sufficiently strong cooling quench cutting away (e.g., all particles above a cutoff, kc), the remaining overpopulation of the modes just below kc results in a vigorous transport towards lower energies that has the form of a strong-wave-turbulence inverse cascade [25]. This cascade induces a long-lived, power-law single-particle spectrum,  , with an exponent,
  , that is distinctly larger than the exponent
  of the thermal Rayleigh–Jeans distribution. The emergence of the strong cascade can be explained by the dominance of vortical superfluid flow around line defects over compressible, longitudinal sound excitations and density fluctuations in the respective regime of wavelengths. The power law,
  , signals that the system evolves near a distinct non-thermal fixed point (NTFP) where the evolution critically slows down. This power law has been predicted by using a nonperturbative Greenʼs function as well as renormalization-group techniques [2, 26, 27]. This particular power can also be traced back to the flow pattern around the vortex lines [25], which now become visible without filtering out short-wavelength fluctuations. The two possible paths to BE condensation are shown schematically in figure 1. Whether the system, during the condensation dynamics, approaches the NTFP or moves in a direct way to thermal equilibrium depends, for a closed system, on the initial conditions (i.e., on the strength of the cooling quench). We refer to the condensation process which takes the 'detour' via the NTFP as hydrodynamic BE condensation because of the dynamical scale separation of incompressible and compressible components of the particle current.
2.2. Semiclassical simulations
To reveal these dynamics, we study a dilute Bose gas in the classical-wave limit, statistically sampling the classical equation of motion that has the form of the Gross–Pitaevskii equation (GPE) for the classical field,  (see appendix
  , is sampled from a distribution that allows its phase to be random, while
  has Gaussian fluctuations around a momentum distribution,
  , which is flat between
  and k ≃ k0, and falls off as
  for k ⪆ k0 (top left panel of figure 3).
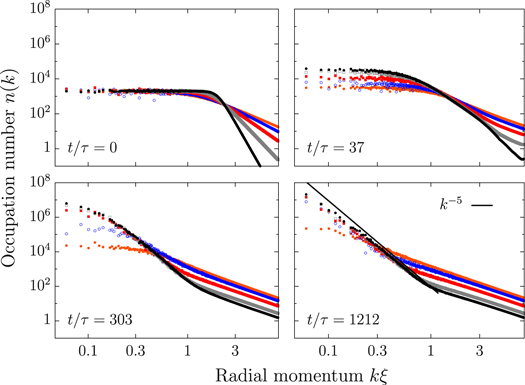
Figure 3. The particle momentum spectra are shown at four different evolution times, on a double-logarithmic scale, as functions of the radial momentum,  . The figure compares the evolution starting from five different initial states, quantified by
  (orange dots), 3.0 (blue), 4.0 (red), 6.0 (grey), and 10 (black). Momentum units are given by the inverse of the healing length, ξ. Time units are
  . Averages were taken over three to seven runs. The central result is that, for large
  (strong quench), a steep infrared power-law,
  , appears, while for small α, the spectrum remains close to thermal.
Download figure:
Standard image High-resolution image2.3. Results: evolution of the zero mode
We consider an initial power-law falloff of n(k) that is close to or steeper than that expected by a self-similar solution of the wave Boltzmann equation,  [10], corresponding to an inverse particle cascade in weak wave turbulence theory [6, 7].
  would correspond to a stable initial thermal distribution at finite chemical potential, and thus any
  is required to set off a re-equilibration to a lower temperature. In figure 2 we show the ensuing time evolution of the condensate occupation number,
  , for the different α. In each case, the evolution leads to a BEC characterized by a nonvanishing
  . As we chose the same
  and
and  for each α, the final condensate fraction,
  , of the total particle number N grows with α. This is because the larger α cuts off more high-momentum particles and leaves less energy to be thermally redistributed. Power-law growth
  , predicted in [6], and later ∼t3 [9], is seen for near-thermal
  , while for large α the late-time growth reduces to ∼t2. As a result, strong cooling quenches qualitatively modify the way the BEC grows, and a slowing down of this process is seen.
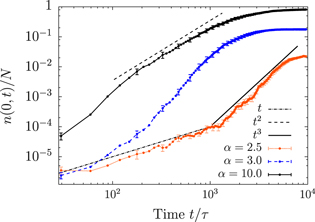
Figure 2. Buildup of the condensate fraction,  , of the total particle number N, with
  , for different strengths of the initial cooling quench, parametrized by α. Depending on α, different power-law behavior is seen. Standard averaging errors are shown.
Download figure:
Standard image High-resolution image2.4. Evolution of the single-particle momentum spectrum
Beyond the zero mode, the occupation spectrum of the nonzero momentum modes allows us to follow the dynamical process of strongly wave-turbulent particle transport to lower energies, and to identify a further smoking gun for the approach of the non thermal fixed point. In figure 3 we show the time evolution of the single-particle distribution,  , over the absolute momenta,
  , at four different times and for different α. During the initial evolution, (
 ), many particles gradually move to lower wave numbers, while at the same time relatively few particles deposit the surplus energy in the high-momentum modes, refilling them again. According to [10], a weak wave-turbulence inverse particle cascade with
  is expected within the range of the validity of kinetic theory. After a while, however, the spectra developing from the different initial α differ strongly. For
  , the distribution develops a bimodal structure, with
  in the infrared (IR) and
  in the (UV). At very long times, this bimodal structure decays towards a global
  (not shown). For
  , the distribution directly reaches a thermal Rayleigh–Jeans scaling,
  .
.
2.5. Hydrodynamic condensation
To interpret our results in the context of NTFPs, we decompose kinetic-energy spectra as in [28] (see the appendix for details) into contributions from incompressible and compressible flow and quantum pressure fluctuations. In figure 4(a), we show the evolution of the different components,  ,
,  , for the weak initial quench,
  : The incompressible component, ni, which accounts for vortical flow with a velocity vector changing transversally to its direction is roughly equal in size to the compressible component, nc, of the longitudinal density fluctuations (i.e., sound excitations). At the same time, the quantum pressure part, nq, is insignificant on all scales. For
  , due to the absence of phase coherence [25], the resulting spectra do not add up to the single-particle spectrum,
  . n(k) grows in the regime of low momenta, meaning that phase coherence is established and growing, and a condensate fraction appears (figure 2). For the case of the strongly nonthermal initial distribution,
  , the evolution is shown in figure 4(b). In contrast to figure 4(a), two macroscopic flows can be observed: one to the UV, and one to the IR. Conservation of particle and energy immediately imply that, when sent out from the regime of intermediate frequencies, energy is deposited in the UV, while particles are predominantly transferred to the IR. This leads to an inverse particle cascade with approximately k-independent radial particle flux,
  , and a corresponding direct energy cascade to the UV [25]. The inverse particle cascade reflects strong wave turbulence, characterized by
  [27]. The decomposition in figure 4(b) makes clear that this power law is caused by incompressible excitations alone [25, 29], establishing a dominantly ideal hydrodynamic (superfluid) BE condensation process. In the UV, the excitations follow a thermal
  and are dominated by nc and nq.
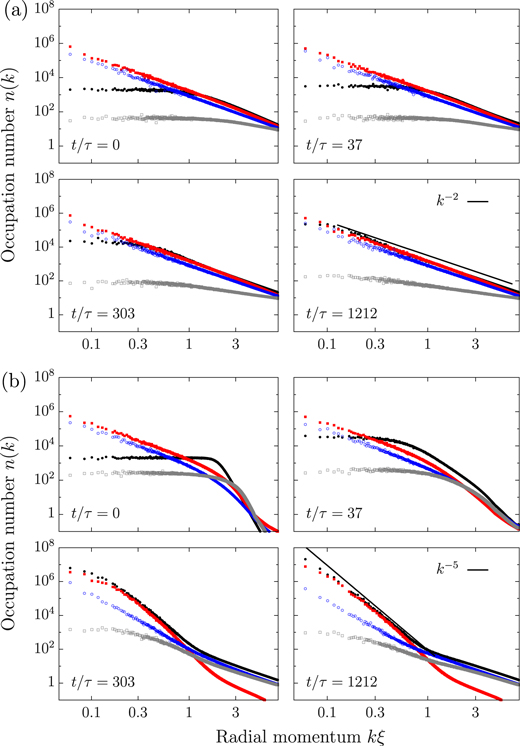
Figure 4. Decomposition of particle spectra n(k) (black points) into incompressible (red points), compressible (blue), and 'quantum-pressure' (grey) components; see text for definitions. Panels (a) show the time evolution after the weak cooling quench from an initial state with  . An average of the data over three runs is shown. Panels (b) show the evolution after the strong quench with
  , taking the average over seven runs. All spectra are shown on a double-log scale. Time units are given by
  .
.
Download figure:
Standard image High-resolution imageThe above results show that during the hydrodynamic condensation process, incompressible flow temporarily dominates in the IR regime at the expense of compressible excitations. The opposite occurs for the compressible excitations in the UV. This dynamical scale separation and bimodal power-law distribution is a signature of the system approaching the NTFP.
3. A flow picture of the approach of the nonthermal fixed point
3.1. Defect formation and dilution
In figure 5 we show, for intermediate times, the three-dimensional distribution of points where the density falls below  of the average density
  , for the systems quenched with
  and
and  . We filtered out modes with wavenumbers larger than
  , but in the hydrodynamic case the high-momentum fluctuations barely distort the figure. The vortex tangles corroborate the findings of [17] for both cases of α. However, a remarkable difference exists in the distribution of the phase angle,
  , of the Bose field, as can be inferred from figure 4. While after weak quenches, the circular flow has strong longitudinal (compressible) fluctuations, in the evolution passing the NTFP, macroscopic quantized vortical flow and distinct Vinen tangles [30] appear in the superfluid.
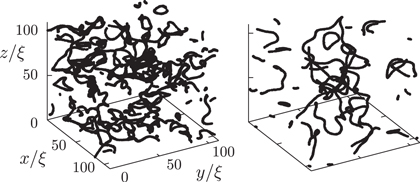
Figure 5. Vortex tangle structures emerging in the gas for the two different extremes of initial conditions:  at time
  (left), and
  at time
  (right). For both pictures we filtered out modes with wavenumbers larger than
  . In the case of
  (left panel), filtering was required to see vortices, but in the hydrodynamic case (right panel), the higher-momentum fluctuations barely distorted the vortex configurations.
Download figure:
Standard image High-resolution image3.2. Representation in a reduced phase space
The evolution of the vortex distribution, together with the phase coherence building up in the gas, which eventually leads to a fully coherent BEC on a low-temperature background, allows us to get a complementary understanding of the approach to and departure from the NTFP. In figure 6, we show the evolution of the system, again starting from the different initial quenches labelled by α, in a reduced phase space defined by two different characteristic length scales, in units of the healing length, ξ: The coherence length,  , is a measure for the mean spatial falloff of phase coherence in space. We define it as the integral over the angle-averaged first-order coherence function,
  (see appendix
  , measures the mean decay of vorticity in the proximity of the vortex line defects in the system. For an isolated circular vortex ring,
  is proportional to the diameter of the ring and thus has a similar relevance as the mean distance between vortices and antivortices in a two-dimensional superfluid. The trajectories of the quench-cooled Bose gas in the
  -plane clearly exhibit the NTFP. Lying in the lower left corner, it corresponds to a strongly coherent gas with a maximum mutual separation and minimum bending of the vortex filaments. The NTFP corresponds ideally to a single vortex ring of maximum extent within the volume, which is known to be a metastable configuration decaying only slowly via bending and sound generation [22, 31]. The marked time steps show the critical slowing down of the system approaching the NTFP, while colliding vortex rings are seen to reconnect and form larger rings. After a long period in the vicinity of the fixed point, the system eventually departs towards final thermal equilibrium. This process corresponds to the shrinking of the last remaining vortex ring by transferring energy to the incoherent sound excitations and particles to the condensate mode. The NTFP sits at the crossroads of attractive and repulsive directions in our reduced phase space.
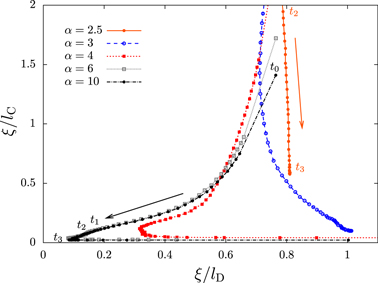
Figure 6. Trajectories of vortex states in the space of inverse coherence length,  , and inverse vortex-correlation length,
  , for five different initial conditions. Arrows are added to indicate the time direction. The symbols are equally spaced on a logarithmic time scale except the step after t0. Times
  ,
,  ,
,  , and
, and  are marked for
  , where
  .
.
Download figure:
Standard image High-resolution imageOur findings suggest that a transition occurs, from a direct evolution towards thermal equilibrium to an evolution that first approaches the nonthermal fixed point, at a value of α between 3 and 4. Each of the trajectories eventually reaches a thermal configuration in the phase with a condensate present. Hence, the transition is expected to occur smoothly. As seen in figure 3, for  the occupation number spectrum already indicates the formation of vortex excitations, while the relatively high occupation of the higher-energy modes prevents a clear separation of incompressible and compressible fractions. While a prediction of the transition value of α is beyond the scope of the present work, this value depends on the system parameters, and the total particle number and energy after the quench, which determine the final temperature and condensate fraction. Since nonlinear interactions are involved in the redistribution process, the transition value is also expected to depend on the particular nonequilibrium distribution of energy and particle numbers across the different momenta.
4. Conclusions
The process of Bose–Einstein condensation in a quench-cooled, dilute cold gas can show features of universal dynamics. Provided a sufficiently strong cooling quench, the condensing system passes by a partially attractive nonthermal fixed point (NTFP) where it is critically slowed down. The approach of the fixed point is marked by the appearance of incompressible flow around tangled vortex lines. In this regime, particles cannot be deposited quickly enough into the zero mode, so they form an excess population with a characteristic power-law falloff within the low-energy modes. In contrast, slow, near-adiabatic condensation can exhibit the appearance of vortical motion, which is, however, distorted by strong compressible sound excitations. The critical slowing down of the phase coherence length and vortex distance provide smoking guns for the detection of the universal dynamics in experiments. A complete characterization of NTFP, in terms of a full set of critical exponents and thus universality classes, including anomalous dimensions, is most desirable, because it would expand the theory of critical phenomena far away from equilibrium. Understanding the possible different paths to a BEC is of fundamental interest beyond the realm of ultracold gases, from the phenomenology of the solid state up to the highest energies (e.g., in heavy-ion collisions [32–36] or early-universe evolution [2, 26, 32, 37, 38]).
Acknowledgments
We thank N Berloff, J Berges, JP Blaizot, S Erne, M Karl, L McLerran, N Philipp, D Sexty, and B Svistunov for useful discussions. This work was supported by Deutsche Forschungsgemeinschaft (GA677/7,8), University of Heidelberg (FRONTIER), and Helmholtz Association (HA216/EMMI).
: Appendix
In the appendix, we provide details of our methodology as well as additional results supporting our approach and conclusions.
A.1. Semiclassical simulations
Since the dynamics we are interested in exclusively affects the low-momentum, strongly populated field modes, we employ the so-called classical field method, which yields, within numerical accuracy and the classical-wave approximation, exact results for the time-evolving observables [39, 40]. For this, initial field configurations,  , are sampled from Gaussian probability distributions and then propagated according to the classical equations of motion. At the end of the time evolution, correlation functions are obtained from ensemble averages over the set of sampled paths. We study the dynamics of a dilute Bose gas by statistically sampling the classical equation of motion
  ,
,

We consider a gas of N atoms in a box of size L3, with periodic boundary conditions and mean density  . Lengths are measured in units of the healing length
  and time in units of
  . Simulations were done on a cubic grid with 2563 points. We have explored the dependence on grid size in our previous work [25, 41]. There is no visible dependence of the power laws found in the IR if the chosen grid is sufficiently large, as it is here.
The initial field in momentum space,  , is parametrized in terms of a randomly chosen phase,
  , and a density,
  , with
  drawn from an exponential distribution,
  , for each
  . We choose the structure function,

for different values of α, with cutoff  and normalization
  . We compare results for a range of different cooling quenches defined by the power laws
  , varying the total number between
  (
( ) and
) and  (
( ).
).
A.2. Hydrodynamic decomposition
To interpret our results in the context of superfluid turbulence, we analyze kinetic-energy spectra as in [42]. Using the polar coordinate representation of the complex field  and the definition
  of the velocity field, the kinetic energy,
  , is split:
  , into the 'classical' component
  , with a 'quantum-pressure' component,
  . Radial particle spectra

in terms of the generalized velocities,  and
and  , are furthermore decomposed by
  into 'incompressible' (
 ) and 'compressible' (
 ) parts to distinguish the vortical superfluid and sound excitations of the gas, respectively. Note that the factor
  in
in  regularizes the velocity field in the UV [42]. The incompressible component reflects transverse motion (i.e., the flow which changes perpendicularly to its direction). It arises mainly from superfluid vortical flow. The compressible component accounts for the longitudinal flow corresponding to sound wave excitations.
The evolution of the integrated fraction,  , with
  , of compressible to incompressible occupations below a momentum scale,
  , is shown in figure A1
. Initially,
, is shown in figure A1
. Initially,  . Starting from
  , Δ stays approximately constant, while for
  , Δ decreases for
  towards zero before increasing again when thermal equilibrium is approached. The inset shows
  as a function of α in which one identifies a transition to a separation of the components, depending on the strength of the initial cooling quench.

Figure A1. Evolution of the fraction, Δ, of integrated compressible to incompressible components below a momentum scale,  , for different initial conditions. Note the semi-log scale. For
  ,
,  stays approximately constant. For
  ,
,  approaches zero at intermediate times, signaling the nonthermal fixed point and a superfluid hydrodynamic condensation process. Averages over one to seven runs. Inset:
  as a function of α.
Download figure:
Standard image High-resolution imageA.3. Definition of the reduced phase space in terms of  and
and


The coherence length,  , is defined as the integral of the angle-averaged first-order coherence function

which becomes independent of  in the ensemble average. In contrast to
  , our choice of the coherence length,
  , does not enlarge insignificant contributions at large r.
The vortex-correlation length is defined in terms of the vorticity. The curl of the velocity field,  , vanishes except at the positions of topological defects. At these phase defects, it yields the quantization and direction of the vortex line. Based on the vorticity,
  , we define angle-averaged correlations of the vorticity as

For small longitudinal distances, r, along the vortex filament, the vorticity,  , points in approximately the same direction as at
  , rendering
  positive. In general, however, the vorticity shrinks with growing r, and the first transverse zero,
  , marks the smallest distance, at which the vorticity points predominantly in the opposite direction due to the curving of the same vortex line or the proximity of other vortex lines. Therefore,
  has a meaning similar to the pair distance of anticirculating vortices in two-dimensional gases, and works equally well for vortex tangles and vortex rings.
  is defined as the average of the transitions through zero,

taking the normalization integral over all vortex lines, and with  . Accounting for the transition through zero for each
  has the advantage that, for small and large vortex rings, r0 is in effect calculated separately and averaged with a weight corresponding to the length of each ring. If one took the transition through zero of the averaged correlation function,
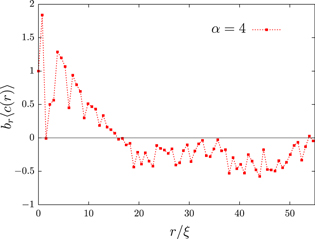
 ![$c(r)=[\int {{{\rm d}}^{3}}x\;C({\bf x},r)]/\int {{{\rm d}}^{3}}x\;|{\bf u}({\bf x}){{|}^{2}}$](https://content.cld.iop.org/journals/1367-2630/16/9/093052/revision1/njp501410ieqn140.gif) , the positive contribution of a large ring at some distance, r, could be of a similar order as the negative contributions of smaller rings (see figure A2
). If both contributions almost cancel each other, small fluctuations around zero could lead to discontinuous jumps of r0 with time.
, the positive contribution of a large ring at some distance, r, could be of a similar order as the negative contributions of smaller rings (see figure A2
). If both contributions almost cancel each other, small fluctuations around zero could lead to discontinuous jumps of r0 with time.
Figure A2. Ensemble averaged vortex correlations obtained from an initial state with  at
at  . The correlations have been multiplied with a binning factor, br, which is equal to the number of grid points contributing to the angle average, approaching
  in the continuum limit. This improves the visibility of the different transitions through zero. The transition through zero at
  is due to a large vortex ring. The transition through zero at
  and the minima at
  and
and  are caused by several smaller rings.
Download figure:
Standard image High-resolution image