

Abstract
Stress induced magnetic field changes in epoxy-based Terfenol-D composite materials offer a unique way for stress sensing by using a remote magnetic field sensor. The article presents a study of key factors that are crucial to the performance of stress sensors but have not been studied before. These include the sensitivity, reversibility, hysteresis and strain rate effects. Measurements of magnetic hysteresis curves revealed the enormous effect of the 180° domain switching on the amplitude of the magnetic field induced by the sample. Simultaneous measurements of the stress, strain and magnetic field exhibit no recognizable residual strain, high level of reversibility and small amount of hysteresis in the magnetic field versus stress curves. Comparison between calculated and measured curves demonstrated good agreement and strengthened the model assumptions. The results of this study indicate on the suitability of magnetostrictive composites for stress sensing applications.
Export citation and abstract BibTeX RIS
1. Introduction
Magnetostrictive materials change the magnetic field in their surrounding when subjected to mechanical loads. These changes can be measured by a remote magnetic field sensor and subsequently translated into the stress or strain in the material. This capability of magnetostrictive materials offers a unique method for stress and strain sensing [1].
The most commonly used magnetostrictive material is the alloy 
 [2], commercially known as Terfenol-D© (TD). TD is known to possess a high magnetostriction coefficient of
  [3], making it useful for transducer and sensor applications. TD is a brittle material and is difficult to form into different shapes. As a result, the shapes and mounting possibilities of force sensors that are based on monolithic TD are limited. This problem can be overcome by incorporating TD particles into a polymer matrix to produce a magnetostrictive composite material that can be formed in different shapes. For example, magnetostrictive composites can be used as a thin-layer load sensor in the form of a washer to measure the compressive forces in bolted joints.
The stress induced magnetic field changes in magnetostrictive composite materials have been studied by several research groups (e.g. [4–14]). In particular, Yoffe et al [11] presented a model for the magneto-mechanical response of magnetostrictive composite materials that is based on an assumed sequence of physical processes that occur during the sample preparation and testing (see section 2). The model demonstrated a good agreement with experimental results and provided several valuable insights important for force-sensing applications. Yet, part of the processes has not been demonstrated experimentally. Moreover, several key issues associated with the magneto-mechanical response, such as the reversibility, hysteresis and strain rate effects have not been explored. In this study, we examined these issues, which are crucial to the performance of magnetostrictive composite materials in stress- or strain-sensing applications.
In section 2, we briefly describe the model presented by Yoffe et al [11] and provide a summary of the main model results from an engineering perspective. Section 3 presents the experimental setups and methodologies. The experimental part of this study began with measurements of magnetic hysteresis curves of the composite materials (section 4.1). These measurements demonstrated the process of 180° domain switching (DS), which was assumed by Yoffe et al [11] to occur at the end of the sample preparation process but has not been demonstrated experimentally. The measured magnetic hysteresis curves provide a direct quantitative evaluation of the effect of this process on the amplitude of the magnetic field induced by the sample and in accordance on the sensitivity in stress sensing applications.
In section 4.2, we present magneto-mechanical measurements to reveal the effects of the strain rate, reversibility and hysteresis in the magneto-mechanical response of magnetostrictive composite samples subjected to uniaxial compression. Unlike all previous experimental studies [9, 11, 12], which have reported only magnetic field versus stress curves, we present simultaneous measurements of the stress, strain, and induced magnetic field. These tests provide much more comprehensive data that is essential for evaluation of stress/strain sensing capabilities. Finally, in section 5 we compare between measured and simulated magnetic field versus stress curves. This comparison indicates on the presence of 'impaired' particles that do not experience magnetization switching.
2. Physically based model for stress sensing using magnetostrictive composites
The magnetic field B induced by the composite sample is proportional to the average magnetization of all TD particles  and the volume fraction v of TD in the composite sample. The calculation of
  is based on an assumed sequence of physical processes that occur during sample preparation and loading. The processes that occur during the sample preparation are illustrated in stages (a) and (b) of figure 1. During the curing of the epoxy (figure 1(a)), the mixture of liquid epoxy and TD particles is exposed to an external magnetic field. The epoxy remains liquid for a long enough time (few hours) that allows the TD particles to rotate, move, and undergo magnetostrictive strain changes without inducing residual internal stresses. Consequently, under a sufficiently strong poling field, the magnetization in all TD particles is aligned along a crystallographic easy axis (one of the 〈111〉 directions), which coincide with the direction of the external magnetic field (denoted as the z-axis in figure 1(a)). At this stage, the average magnetization of the TD particles reaches a saturation value of
  where
where  is the spontaneous magnetization of TD.
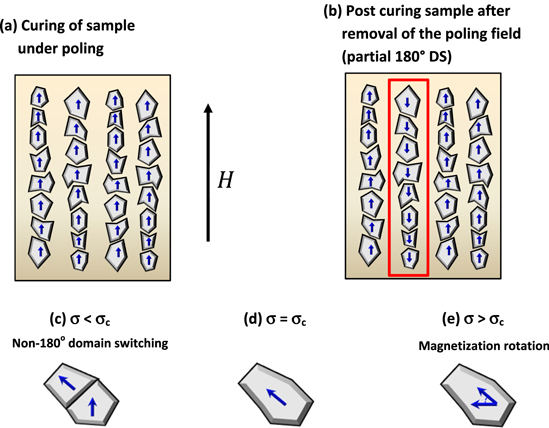
Figure 1. Modeled sequence of magneto-mechanical processes.
Download figure:
Standard image High-resolution imageWhen the external magnetic field is removed, the demagnetization energy associated with the magnetic field induced by the sample acts to reduce the average magnetization of the sample (figure 1(b)). At this stage, the epoxy is fully cured and the strain compatibility between the TD particles and the epoxy matrix prevents magnetization changes that are associated with strain changes. One of the assumptions of the model of Yoffe et al [11] was that in a portion of the TD particles, the magnetization undergoes 180° DS that is not associated with a strain change (see figure 1(b)). Yoffe et al [11] defined the parameter  (0 ≤
(0 ≤  ≤ 1), which quantifies the extent of the 180° DS process, such that after removal of the external field the average magnetization of all TD particles is

A value of γ = 1 indicates that no 180o DS occurred, and a value of γ = 0 indicates that 50% of the TD volume underwent 180o DS. Yoffe et al estimated that γ < 0.1 [11]. Nevertheless, no direct experimental evidence that supports this assumption has been presented.
The processes that occur under uniaxial compression are illustrated in stages (c)–(e) of figure 1. Upon loading, the TD particles first experience non-180° DS (see figure 1(c)). During this stage, the average magnetization of TD particles is determined by the volume fraction x of regions in which non-180° DS has occurred. The stress-induced DS process continues until a critical load is reached, at which x = 1 and the DS process is completed (figure 1(d)). Above that critical load, the magnetization can further rotate off the easy axes (see figure 1(e)) through a process called magnetization rotation (MR). During this stage, the average magnetization of TD particles is determined by the direction cosines  between the compression axis and the local magnetization.
Yoffe et al (2015) predicted that upon unloading, the sequence of DS and MR processes is reversed (stages (c)–(e) of figure 1), and nearly reversible behavior can be obtained. Yet, certain amounts of hysteresis and irreversibility are expected to appear due to the viscoelastic behavior of the epoxy and the energy barrier for non-180o (DS). However, these aspects have not been studied experimentally. In addition, the effect of loading rate on the hysteresis and irreversibility has also been unknown.
The model calculations begin with the expression of all variables of the problem as a function of the degrees of freedom, i.e., x in the non-180° DS stage and  in the MR stage. The values of the degrees of freedom are then calculated by expressing and minimizing the total energy of the system.
Yoffe et al [11] showed that under uniaxial compression, the demagnetization energy is negligible with respect to the mechanical energy of the system. In addition, they showed that the contribution of the stresses and strains in the transverse plane to the overall energy is negligible with respect to other energy terms that are related to the axial stress and strains. Thus, to a very good approximation, the values of the degrees of freedom are determined only by the axial stress and strain. Under these approximations, the solution of the problem for the non-180° DS regime provides the analytic expression

Here B0 is the initial magnetic field induced by the sample before loading, σ is the applied stress,  is the magnetostriction coefficient,
  is the Young's modulus of the epoxy, and v is the volume fraction of TD in the composite material.
For the MR regime, the energy minimization with respect to  was performed numerically using an active-set algorithm in MATLAB® (The MathWorks, Inc.). This procedure provides the equilibrium values of
  as a function of the stress
  Note that this procedure is applied only for stress values larger than the critical stress σc at which the non-180° DS process is completed.
To explain differences between calculated and measured magnetic field versus stress curves, Yoffe et al [11] assumed that part of the TD particles are 'impaired', i.e., they do not experience magnetization switching and behave as a stiff elastic material that increase the effective Young's modulus of the matrix. In this case, the term  in equation (2) is replaced by an effective stiffness of the matrix and equation (2) is replaced with
where v* is the volume fraction of impaired particles out of all TD particles.
One possible reason why the particles are impaired is that these particles contain several grains with different orientations. In each grain, the crystallographic easy axes point along different directions; therefore, the poling effect is less effective. Moreover, the strain compatibility between grains hinders or even prevents magnetization changes. Another possible reason is related to the preparation of the TD powder by spark erosion, which induces strong heating of the particle surfaces. The heating may affect the materials properties, especially in small particles that have a small volume-to-surface ratio. The assumption regarding the presence and role of the impaired particles must be validated by gathering more experimental evidence.
The sensitivity S in force sensing applications is determined by the slope of the magnetic field versus stress curve. According to equation (3), in the non-180° DS regime the sensitivity is constant, maximal, and equal to

The MR process requires considerably higher energy and thus a considerably higher load [11]. Consequently, the slope of the magnetic field versus stress curve during MR becomes much smaller, and the magnetic field approaches zero at high stress values. This means that the preferred operation range for stress sensing applications is in the non-180° DS regime, i.e. at stress values smaller than the critical stress σc, at which x = 1 and the non-180° DS process is completed. This critical stress is given by [11]

The volume fraction of the impaired particles v* increases the operation range (according to equation (5)), but it also decreases the sensitivity (according to equation (4)). An important insight is that all parameters that affect the sensitivity are material properties that can hardly be changed, except for B0. The latter is determined by the volume fraction v of TD particles and the parameter  defined in equation (1).
3. Experimental setup and methodology
3.1. Sample preparation
The tested samples had a cylindrical shape with a length of 12.7 mm and a diameter of 6.35 mm, in accordance with the ASTM D-695 standard for compressive testing. The procedure for sample preparation was the same as that reported by Yoffe et al [11]. Magnetostrictive samples were prepared using TD powder manufactured by Etrema Products, USA. The powder was prepared from bulk material by spark erosion and was sieved for particle size smaller than 38 μm. The polymer matrix used was an Epon 8280-type epoxy resin, based on the diglycidyl ether of bisphenol-A, with an Epikure 3140-type polyamide curing agent manufactured by Hexion, USA. The mixing ratio was 2:1, and curing occurred for 7 d at room temperature. This resin system is commonly used for adhesive bonding and the encapsulation of electrical components. Epon 8280 is a specially modified product designed for high filler contents. The material provides good resistance against the settling of conventional fillers, such as light-weight oxides or mineral powders. In the case of denser TD particles, the settling problem is overcome using a sufficiently strong magnetic field. Epikure 3140 was found highly suitable for adhesion to metals and offers a cured polymer that is relatively flexible and tough, which helps maintain the fairly brittle TD particles intact while still transferring stress to them. This curing agent also provides exceptional corrosion and water resistance, which is essential in the case of TD.
The TD powder was mixed with the epoxy resin at volumetric concentrations of 10.4% and 18% to form composite samples. The mixture was then degassed under medium vacuum conditions (2 mbar) to remove bubbles and dissolved air from the resin and to fill any voids on the surface of the TD particles. The degassed mixture was then poured and sealed in a cylindrical mold made of Teflon. The sealed mold was then placed in an external magnetic field of ![$160\,[{\rm{kA}}\text{}{{\rm{m}}}^{-1}]$](https://content.cld.iop.org/journals/0964-1726/26/6/065007/revision1/smsaa6b81ieqn19.gif) (measured using a Gaussmeter manufactures by AlphaLAb Inc., USA) for 7 d, until the end of the curing period. A magnetic field was applied using two permanent magnets on both sides of the mold. The lateral dimensions of the permanent magnets were considerably larger than the length of the sample; thus, they provided a fairly uniform magnetic field.
(measured using a Gaussmeter manufactures by AlphaLAb Inc., USA) for 7 d, until the end of the curing period. A magnetic field was applied using two permanent magnets on both sides of the mold. The lateral dimensions of the permanent magnets were considerably larger than the length of the sample; thus, they provided a fairly uniform magnetic field.
3.2. Setup for measuring magnetic hysteresis curves
The 180o (DS) process, which is expected to occur after the poling magnetic field is removed at the end of sample preparation, was characterized by measuring magnetic hysteresis curves under zero external mechanical loads. In these tests, the sample was mounted at the center of an electromagnet (Ploytronic Corporation, model HEM 75 connected to a bipolar power supply model BCS 75) and was subjected to a low-frequency (0.83 mHz) cyclic magnetic field with amplitude of 1.2 Tesla. During the test, the magnetic field was measured by a GM-2 Gaussmeter manufactured by Alphalab, Inc., USA. The Hall probe sensor was placed on the surface of the sample to maximize the reading of the magnetic field emitted from the sample. The magnetic field B induced by the sample was calculated using the relation  where
where  is the overall magnetic field measured in tests in which the sample is mounted inside the electromagnet and
  is the magnetic field produced by the electromagnet alone, measured in tests without a sample. In this calculation,
  and
and  were measured at the same current i.
3.3. Magneto-mechanical test setup
Compression tests were performed at a constant displacement rate using an MTS hydraulic mechanical testing machine. The hydraulic machine was chosen to avoid magnetic noise and distortions emitted from the electric motor of an electromechanical machine. The force applied to the specimen was measured using a load cell model 31/1432-08 made by Sensotec, USA. The average strain in the sample was determined by measuring the distance between two light reflecting strips, which were taped approximately 1 mm from the sample ends, using a laser extensometer system model LE-05, made by EIR, USA.
A uniaxial magnetosresistive magnetic field sensor (HMC1021S, Honeywell International Inc., USA) was used to measure the magnetic field emitted from the sample. Magnetoresistive sensors provide better sensitivity than the commonly used Hall effect sensors and a resolution on the order of 10 ![$[\mu {\rm{G}}{\rm{a}}{\rm{u}}{\rm{s}}{\rm{s}}].$](https://content.cld.iop.org/journals/0964-1726/26/6/065007/revision1/smsaa6b81ieqn25.gif) In addition, the HMC1021S sensor is particularly suitable for our tests because of its small dimensions, allowing for the placement of the sensor close to the sample. The sensor was positioned at the height of the sample's center and at a radial distance of approximately 10 mm from the sample (see figure 2).
In addition, the HMC1021S sensor is particularly suitable for our tests because of its small dimensions, allowing for the placement of the sensor close to the sample. The sensor was positioned at the height of the sample's center and at a radial distance of approximately 10 mm from the sample (see figure 2).
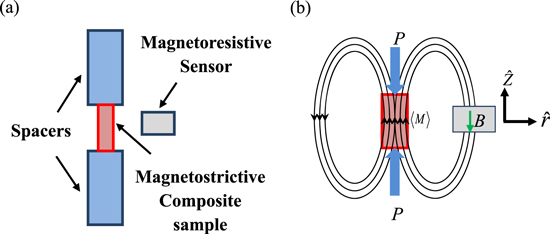
Figure 2. Schematic illustration of experimental setup: (a) illustration of mechanical setup, (b) illustration of magnetic measurement.
Download figure:
Standard image High-resolution image4. Experimental results
4.1. Magnetic hysteresis curves
Measurements of magnetic hysteresis curves for samples with TD volume fractions of 10.4% (blue curve) and 18% (green curve) are presented in figure 3. The hysteresis curves demonstrate very sharp changes in the magnetization at small magnetic fields close to the coercive field. The values of the coercive field are approximately the same for the two samples (approximately 100 Gauss) and are comparable to the value of the coercive field for 180o (DS) in bulk TD [10].
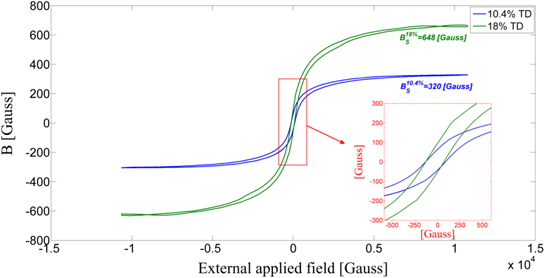
Figure 3. Magnetic hysteresis curves for samples with TD volume fractions of 10.4% and 18%.
Download figure:
Standard image High-resolution imageAccording to figure 3, the magnetic field induced by the two samples reached a saturation value BS under sufficiently strong external fields. The saturation field represents a state at which  and is approximately the field induced by the sample under the strong poling magnetic field (stage (a) in figure 1). Therefore, the parameter γ defined in equation (1) can be expressed by

where  is the magnetic field induced by the sample in the absence of an external magnetic field. The values of
  for the samples shown in figure 3 were 14 and 25 Gauss for the samples with TD volume fractions of 10.4% and 18%, respectively. These values indicate a ratio of γ = 0.043 in the sample with 10.4% TD and a ratio of γ = 0.038 in the sample with 18% TD. These small values are in agreement with the theoretical estimations provided by Yoffe et al [11] and indicate that most of the TD volume experiences 180o (DS).
4.2. Magneto-mechanical response of magnetostrictive composites at different strain rates
Figure 4 presents the magneto-mechanical response of a composite sample containing 18 vol% TD particles. The sample was loaded up to a strain of 1.2% at different strain rates, as indicated in the legend of the figure. The stress–strain relation (figure 4(a)) is not linear, especially at small strains. For example, the slope (local Young's modulus) of the loading curve varies between 1.5 GPa at small strains to 2.7 GPa at large strains. This behavior is probably related to changes in the contact area. Under small loads, contact between the sample and the loading frame occurs only in surface asperities, and the stress is not distributed uniformly inside a sample [15]. As the load increases, the surface asperities flatten, the contact area and the contact stiffness increase, and the stress is distributed more uniformly [15].

Figure 4. (a) Stress–strain, (b) magnetic field versus strain and (c) magnetic field versus stress curves measured at the strain rates indicated in the legends.
Download figure:
Standard image High-resolution imageThe stress–strain curves shown in figure 4(a) exhibit no recognizable residual strain, which indicates an irreversible process. High levels of reversibility are also shown in figures 4(b) and (c), demonstrating the magnetic field as a function of the strain and stress, respectively. Specifically, upon unloading to zero stress, the magnetic field returns approximately to the same initial value. Thus, the sequence of non-180o DS and MR magneto-mechanical processes is reversible, as predicted by Yoffe et al [11].
Figure 4(c) demonstrates the distinction between the non-180° DS and MR processes, as discussed in section 2. Non-180o DS occurs at small stress values, up to a critical stress of  and is associated with a linear magnetic field versus stress response, in accordance with equation (3). The MR process occurs at higher stress values and is associated with a nonlinear response, at which the magnetic field approaches zero at high stress values.
The stress–strain curves presented in figure 4(a) exhibit hysteresis that is typical of epoxy materials [16, 17]. A comparison of figures 4(b) and (c) shows that the magnetic field versus strain curves have significantly larger hysteresis than the curves of magnetic field versus stress. The width of the hysteresis in the magnetic field versus stress curves is smaller than 1.5 MPa, which is 4% of the maximal value (full scale) of the stress. Figures 4(a)–(c) demonstrate that all curves measured at different strain rates nearly coincide. This observation indicates that the magneto-mechanical response of the magnetostrictive composite sample is not affected by the strain rate over the studied range.
5. Comparison between measurements and simulations
Figure 5 presents a comparison between measured and simulated magnetic field versus stress curves. The input parameters for the simulation are given in table 1. It should be emphasized that the only unknown material parameter used in the simulations is the volume fraction v* of impaired particles. All other input parameters are known values for material properties taken from the literature. The simulation with v* = 0 is far from fitting the measured curve. In particular, the slope of this curve in the non-180° DS regime (see equation (4)) does not fit the slope of the measured curve. On the other hand, the simulation with v* = 0.5 fits well with the measured curve in both the non-180° DS and the MR regimes, as well as in the transition between them.

Figure 5. Comparison between measured and simulated magnetic field versus stress curves. The measured curve was taken from the sample containing 18 vol% TD particles under a strain rate of  (red curve in figure 4(c)).
Download figure:
Standard image High-resolution image
Table 1. Input material properties used in the calculated curves shown in figure 5.
| Property | Value | Reference |
|---|---|---|
Magnetostriction coefficient 
|

|
[3] |
TD's Young's modulus 
|
30 GPa | Eterma Terfenol-D® |
| Data sheet [18] | ||
Epoxy's Young's modulus 
|
1.5 GPa | EPIKURE™ curing agent 3140 data sheet [19] |
| Magnetocrystalline anisotropy coefficient K1 | −0.6 × 10⁵ J m−3 | [3] |
| Volume fraction v* of impaired particles out of all TD volume fraction | 0% (green curve) 50% (red curve) |
6. Conclusions
Magnetic hysteresis curves (section 4.1) provide direct evidence for the 180° (DS) that occur when the poling magnetic field is removed at the end of the sample preparation procedure. Further analysis shows that this process reduces the magnetic field induced by the sample by a factor of γ ≈ 0.04 and therefore has an enormous effect on the sensitivity of the stress sensor.
Measured stress–strain-magnetic field curves (section 4.2) exhibit no recognizable residual strain and a high level of reversibility in the magnetic field versus stress curves. These observations indicate that the sequence of non-180o DS and MR magneto-mechanical processes is reversible. In addition, the stress–strain-magnetic field curves shown in figure 4 demonstrate that the magneto-mechanical response of the samples is not affected by the strain rate over the studied range of up to  which corresponds to full loading within 40 s. All curves presented in figure 4 demonstrated hysteresis, but the amount of hysteresis in the magnetic field versus stress curves is much smaller than in the magnetic field versus strain curves. The magnetic field versus stress measurements can be used as calibration curves in stress sensing applications. In this case, the curves presented in figure 4(c) demonstrate a hysteresis error smaller than 4% of the full scale.
Comparisons of calculated and measured curves showed that the simulation that do not account for the impaired particles do not fit the experimental results. On the other hand, the simulation with an assumed fraction of 50% impaired particles demonstrated good agreement with the measured curve in all regimes of the magneto-mechanical response. These results strengthen the assumption made in Yoffe et al [11] on the presence of impaired particles in the manufactured TD composite samples.
Acknowledgments
The study was supported by the Professor A Pazy IAEC-UPBC joint research foundation.