

Abstract
Pulsed inductively coupled plasmas (ICPs) are widely deployed in the fabrication of semiconductor devices. Pulse repetition frequencies of up to tens of kHz are commonly used during plasma etching for the high power densities they generate during the pulse-on period, and for their unique chemistries during the pulse-off period. The use of highly attaching halogen gases produces low electron densities during the pulse-off period, and these low densities can result in instabilities, E–H transitions and ignition delays when applying power on the next pulse. To mitigate these possibilities, a low-level power environment could be maintained during 'pulse-off' to moderate the minimum plasma density, therefore reducing ignition delays and enhancing plasma stability. In this work, ICPs sustained by 5 kHz pulsed power using Ar/Cl2 mixtures at 20 mTorr were computationally investigated using a high-power, low-power format. For these conditions, the computed electron temperature (Te) reaches a quasi-steady state during both the high- and low-power excitation. The model predicts that within the electromagnetic skin-depth, Te spikes to a high value during a low-to-high power transition, and to a low value during a high-to-low power transition. At the same time, a few cm above the substrate, there is little modulation in Te, as electron power convected from the skin depth disperses in traversing the reactor. The positive and negative spikes, and convection of transients across the reactors, are functions of power ramping time and gas mixtures.
Export citation and abstract BibTeX RIS
1. Introduction
Inductively coupled plasmas (ICPs) represent a critical technology for plasma etching for semiconductor fabrication, particularly for conductors and compound materials, and for atomic layer etching [1–5]. Typical operating conditions include rare gas-halogen gas mixtures and pressures of a few to tens of mTorr. Power deposition is up to a few kW in chambers accommodating 300 mm diameter wafers. As the critical dimension of semiconductor devices continue to decrease and more exotic materials are used, finer control over the plasma produced reactive fluxes to the wafer is required.
An increasingly applied method to control reactive fluxes to the wafer is using pulsed-power. Typical pulse repetition frequencies (PRFs) are up to 5–10 kHz and duty cycles (DCs, the fraction of the pulse period power is on) are typically tens of percent. Pulse power enables high peak power during the power-on portion of the cycle, while leveraging unique plasma chemical reactions during the power-off portion of the period [6–8]. When combined with continuous or pulsed biases on the substrate to accelerate ions onto the wafer, unique combinations of reactant fluxes and ion energies onto the wafer can be produced [9, 10].
Pulsed ICPs have been particularly effective in minimizing damage. For example, Ishikawa found that in an SiO2 etching process carried out in an Ar ICP, there was less UV damage when using pulsed power compared to continuous wave (CW) due to the lower UV dose during the power-off period [11]. Petit-Etienne et al studied silicon recesses during plasma etching with both CW and pulsed-power using HBr/O2/Ar plasmas [12]. They found that when using synchronous pulsed-power, the recess loss of Si could be better controlled due to a decreased ion flux while maintaining neutral fluxes. They also concluded that using pulsed-power may also minimize chamber wall sputtering due to the lower ion flux, which then reduced contamination of the substrate [13]. Bodart et al investigated the consequences of PRF and DC on radical densities in Cl2/HBr plasmas [14]. They found that in the high PRF regime, changing DC could effectively control the fragmentation of the feedstock gases, whereas in the low frequency regime the effect of DC on the plasma chemistry was small.
Pulsed ICPs have also been extensively investigated through modeling. In an early work, Ramamurthi and Economou developed a two-dimensional (2D) continuum model to study pulsed ICPs sustained in Cl2 [15]. A highly electronegative ion–ion plasma core with an electropositive edge was observed in the afterglow of the discharge. A spike in Te was observed at the beginning of the power pulse, which agreed well with experiments. The authors concluded that some plasma properties, such as negative ion density, strongly depend on the spatial distribution of the plasma core, also noting the need to control electric probe positions in experiments to obtain a complete perspective of these complex processes. Due to the strong spatial dependence of plasma properties in an electronegative discharge, the separation of the electronegative core and electropositive periphery was accounted for in a volume-averaged model developed by Kim et al [16]. That model predicted a decreased ratio of neutral-to-ion flux as the aspect ratio of the discharge increases in an O2 plasma, further demonstrating the importance of geometry and the spatial conditions in electronegative plasmas. To better understand the transient behavior of a pulsed-power driven electronegative plasma, Thorsteinsson and Gudmundsson performed a computational investigation of an Ar/Cl2 plasma using a global model [17]. They concluded that improvements in etch selectivity when using a pulsed-power Cl2 plasma results from the increase of the radical to ion ratio compared to CW operation. This control can be further refined by varying mole fractions in Ar/Cl2 mixtures, a practice that provides some limited ability to tune the electron temperature.
A commonly observed behavior of Te in a pulsed ICPs is that at the beginning of the power pulse Te spikes to a value above that in the quasi-steady. For example, in the modeling by Ramamurthi and Economou, this spike in Te was observed in a pulsed Cl2 ICP [15]. Te had a peak to 5 eV at the beginning of the pulse and then a rapid decrease to the quasi-steady value of 2 eV in about 10 μs. This phenomenon was observed in early experiments performed by Ashida et al [18]. In a pulsed ICP sustained in Ar at 5 mTorr, Langmuir probe measurements indicated a peak in Te at the leading of the pulsed period up to 7 eV, with the quasi-steady state temperature being 3.5 eV. Darnon et al noted that in their experiments the overshoot of Te at the beginning of the pulse is more significant when the pulse repetition PRF is low [19]. A low PRF provides a longer afterglow, and thus a lower electron density, ne, at the beginning of the next pulse. This lower ne then produces the overshoot of Te. With the spike of Te in a pulsed plasma being well documented, its behavior is used as a test of the accuracy of experimental measurements [20]. However, the spatial dependence of the spike of Te is not often documented.
Although there are several advantages of using pulsed-power for electronegative ICPs, there are also several challenges. Due to the low electron density at the end of the afterglow and at the beginning of power pulse, E–H (capacitive-to-inductive) transitions can occur at the beginning of each pulse. At the beginning of the pulse when the electron density is low, the electromagnetic skin depth can be larger than the dimensions of the reactor, and electromagnetic coupling is inefficient. Power is electrostatically and capacitively coupled to the plasma through the voltage drop from the coil to the plasma bulk. This is the E-mode. As the electron density ne increases, the skin depth decreases and power becomes coupled to the plasma inductively through the electromagnetic field. This is the H-mode. During the onset of the E-mode, large oscillations can occur in the plasma potential and plasma density, and electrostatic waves can be launched from beneath the antenna. When operating close to the transition between the E- and H-modes, ionization instabilities may occur which produces periodic maxima in the plasma density [21]
The E–H transition in ICPs was experimentally investigated by Cunge et al [22] who observed a hysteresis in the mode transition as a function of power. It was observed that the power absorbed by the plasma has a nonlinear dependence on the electron density. In a later work, Chabert et al investigated this instability in SF6 and Ar/SF6 plasmas with a combination of experimental and modeling work [21]. They concluded that multistep ionization plays an important role in ionization balance, induces nonlinearity in the plasma and produces hysteresis behavior during the E–H mode transition.
One of the origins of the E–H transition in electronegative ICPs and its associated instabilities is the need to reignite the plasma at the beginning of each period in pulsed plasmas. One strategy to circumvent the E–H transition while also modulating power is to use a high-low power scheme [23]. Using this method, the pulsed power format consists of a high power portion of the pulsed period followed by a low power portion of the pulsed period—that is, non-zero power. The intent of the non-zero power is to maintain the plasma conductivity at a high enough value so that the system remains in H-mode throughout the pulsed period. However, even high-low power pulsing may have instabilities. List et al found that in high-low power modulated Cl2 ICPs, the plasma may extinguish at the beginning of the low-power period and then reignite after tens of microseconds to a few ms [23]. They called this phenomenon 'ignition delay', the cause of which is believed to be related to the ability of the supply to deliver power to the time varying impedance of the plasma.
In this paper, we discuss results from a computational investigation of high-low pulse power formats for ICPs sustained in Ar/Cl2 gas mixtures. We found that in high-low pulsed plasmas, Te undergoes a transient during both power transitions. For long enough high- and low-power periods, Te, is essentially constant during the pulse. However, Te, has a momentary maximum when power transitions from low-to-high, similar to the leading edge of conventional pulsed ICP. Te, also has a momentary minimum when power transitions from high-to-low. This response of Te to power transitions highly depends on location with respect to the electromagnetic skin-depth and the fractional dissociation in the Cl2-containing plasma. Within the skin-depth, the transients in plasma properties (Te and ne) are distinctly observed during power transitions. With increasing distance from the skin-depth, the transients disperse in space and dissipate in magnitude. These responses of the plasma to the pulsed power can be controlled through gas mixture and pulsed power format. Decreasing the Cl2 mole fraction, lengthening the power ramp time, and increasing the low-power diminish the transients and produce a more spatially uniform plasma.
The model used in this investigation is discussed in section 2. Plasma properties as a function of high-low power format and gas mixture are discussed in section 3. Concluding remarks are provided in section 4.
2. Description of the model
Our computational investigation was performed using the HPEM (Hybrid Plasma Equipment Model). The HPEM is a 2D plasma hydrodynamics model designed for investigation of low temperature plasma systems using both kinetic and fluid approaches. Details of this model are discussed in reference [24], while a brief description focused on the options used in this study follows.
HPEM resolves plasma phenomena in a time-slicing approach. Different classes of plasma phenomena are addressed in separate modules while transferring plasma properties between modules on time scales appropriate to resolve those phenomena. In this work, the modules employed are the Electromagnetics Module (EMM), Fluid Kinetics Module (FKM), and electron Monte Carlo Simulation (eMCS) within the Electron Energy Transport Module. The inductively coupled electric field is produced in the EMM from a frequency domain solution of Maxwell's equations with antenna currents selected to deliver a specified power to the plasma. The densities, fluxes and temperatures of the heavy particles (neutrals and ions) and densities of electrons are produced in the FKM by integrating in time the continuity, momentum and energy equations. The electrostatic potential is also produced in the FKM by semi-implicitly solving Poisson's equation using volumetric and surface charge densities. The electromagnetic fields from the EMM; and electrostatic fields and species densities from the FKM are transferred to eMCS.
In the eMCS, a kinetic solution of Boltzmann's equation for the electron energy distributions (EEDs) throughout the reactor is performed using a Monte Carlo simulation. Electron trajectories in the time and spatially varying electric and magnetic fields are computed while including electron collisions. Transport of both bulk and secondary electrons from surfaces is addressed. Electron–electron collisions are included such that the Maxwellian nature of the EEDs in regions of high electron density is captured. Using the spatially dependent EEDs, electron impact source functions, conductivities and transport coefficients are computed and transferred back to the EMM and FKM. A detailed description of the eMCS can be found in reference [25].
Secondary electron emission from surfaces is addressed using the same Monte Carlo simulation [24]. This treatment of secondary electrons is used in order to capture the kinetic transport of the sheath accelerated electrons. Given the flux of ions and excited states to surfaces, and their secondary electron emission coefficients, a flux of electron pseduoparticles is released from surface sites and their trajectories are tracked using the eMCS. Secondary electrons whose energy falls below the threshold energy of the lowest electronic state are transferred to the bulk electrons. The EEDs of the secondary electrons are separately computed to generate electron impact source functions.
3. Plasma characteristics of high-low pulsed power ICPs
The geometry of the ICP reactor used in this investigation is shown in figure 1(a). The system is a conventional ICP reactor with a stovetop 4-turn coil located at 0.4 cm above a dielectric window. The cylindrical reactor radius is 7.6 cm and the chamber height is 15.6 cm. A wafer with a radius of 3.7 cm is positioned on a grounded substrate 13 cm below the dielectric Al2O3 window. A 1.8 cm wide Al2O3 focus ring surrounds the substrate. The dielectric constants of the alumina is 9.8 and that of the wafer is 11.8. The dielectric has a negligible conductivity while the wafer has a conductivity of 10−3/Ω cm. In this work, the substrate supporting the wafer is not powered so that any modulation of the plasma can be attributed to power changes from the coil. The gas inlet is in the sidewall at 0.4 cm below the dielectric window and the annular pump is at the bottom of the reactor with a 2.1 cm width. The feedstock gas enters the chamber at ambient temperature (300 K). A pressure sensor is embedded in the sidewall at 3.9 cm above the substrate to monitor the local pressure, and that measurement is used to throttle the output flow rate to maintain the specified pressure. The inner wall of the reactor is coated with the dielectric yttria (Y2O3) to decrease the sticking coefficient of radicals, thus increasing the precursor densities in the plasma bulk. The dielectric constant of yttria is about 13. The actual thickness of the yttria coating, a few microns, cannot be resolved by the mesh, and so the dielectric constant of the yttria used in the model was increased to 104 so that the capacitance (F cm−2) of the yttria material would be the same as the thin film. The reactor is surrounded by air with electrical ground planes situated at large enough distances so that the electromagnetic waves produced by the coil are not perturbed by the surrounding ground planes.

Figure 1. Geometry and power profile used in the model. (a) The geometry is an inductively coupled plasma having a 4-turn antenna. The dots (with dimensions) indicate where plasma properties are discussed later in the paper. (b) Pulse power profile for the base case.
Download figure:
Standard image High-resolution imageThe secondary electron emission coefficients of both the alumina window and the Y2O3 sidewall coating were 0.05 for ions and 0.01 for excited state species having energy greater than the work function of the material. (Photoelectron emission was not included.) A parametric study of varying the secondary electron emission coefficient from one third to three times of these base case values was conducted. There was little impact on the plasma density or spatial distribution of the plasma. The rate of ionization by secondary electrons is 1–2 orders of magnitudes smaller than the ionization by bulk electrons.
The applied power profile, shown in figure 1(b), is a high-low pulsed format that modulates the 13.56 MHz radio frequency current applied to the antenna. In this model, all the applied power is inductively coupled to the plasma. That is, we did not include capacitive coupling from the coils and so assumed H-mode power deposition. This assumption was validated by performing limited simulations with full electrostatic coupling from the antenna. In the base case, the high-power is 160 W and the low-power is 96 W. (With high power, the power density, W cm−3, is similar to industrial reactors used for microelectronics fabrication.) The PRF is 5 kHz and the DC is 50%. Note that the power takes 10 μs to ramp from low-to-high or from high-to-low power. The ramp-up and ramp-down times are evenly split between the high- and low-power periods so a 50% DC is strictly enforced. For the base case, the feedstock gas used is an Ar/Cl2 = 5/95 mixture with a flow rate of 22 sccm. The pressure is held constant at 20 mTorr. The reaction mechanism used for the Ar/Cl2 plasma investigated here is the same as in reference [26]. The recombination coefficient on surfaces for ground state Cl to recombine to form Cl2 was 0.05. Excited states of Cl and Ar quenched on surfaces to form their ground states with unity probability. Cl2(v) quenched on all surfaces to form ground state Cl2 with 0.5 probability. All charged species recombine on surfaces with no reflection, depositing charge on dielectric surfaces.
The 2D profiles of the electron density (ne), electron temperature (Te) and ionization source by bulk electrons (Se) are shown in figure 2. The figures are at the end of the high- and low-power periods, corresponding to the times of 100 μs and 0 μs (equivalent to 200 μs) shown in figure 1(b). In the base case, the position with the highest power deposition is at mid-radius of the reactor at 1 cm below the dielectric window. As the power changes from 96 W to 160 W, the maximum power density increases from 0.8 to 1.4 W cm−3, leading to an increase in the maximum electron density from 6.3 × 1010 cm−3 to 1.3 × 1011 cm−3. Using these values of ne and the momentum transfer collision frequency (νm) of 2 to 4 × 10⁷ s−1, the skin depth (δ) of the EM wave in the plasma is 1.5 to 2.0 cm, which is much smaller than the height of the reactor (13 cm). Consequently, the pulsed power has little direct impact on the plasma dynamics in the several cm above the wafer.

Figure 2. Plasma properties for the base case (Ar/Cl2 = 5/95, 20 mTorr, 96 W–160 W) at 0 μs (end of the low-power) and 100 μs (end of the high power) during the power pulse. (a) Electron density, (b) electron temperature and (c) ionization source by collisions of bulk electrons. Maximum value, range of values plotted and units for contour labels are indicated in each image.
Download figure:
Standard image High-resolution imageFor example, the ionization source by bulk electrons (Se) decreases by a factor of 100 within 5.0 cm from the dielectric window, indicating the plasma density above the substrate is not directly sustained by the pulsed power but rather results from transport of charged species from the top of the reactor. The plasma near the substrate can at best be sustained by power that is convected from the top of the reactor by non-local electron transport and by electron thermal conduction, or by Penning ionization due to metastable species that transport from the top of the reactor.
The dominant positive and negative ions in the base case are Cl2+ and Cl−. Their densities and the gas temperature (Tgas) are shown in figure 3 at the end of the low- and high-power portions of the pulsed cycle. The axial densities of electrons and Cl− at mid-radius of the wafer are shown in figure 4 at the end of the low- and high-power periods. The maximum Cl2+ density has only a small increase, 1.6 × 1011 cm−3 to 1.8 × 1011 cm−3, as the input power transitions from low (96 W) to high (160 W). The increase in the negative ion density is also small, 1.5 × 1011 cm−3 to 1.6 × 1011 cm−3. The electronegativity of the plasma, the ratio of the negative ion density to electron density, decreases from 2.4 at low power to 1.2 at high power. The Cl− density is relatively stable through one period due to the high dissociative attachment rate of Cl2 by thermal electrons which can occur throughout the reactor. Losses of Cl− are dominated by ion–ion recombination since the negative ion is trapped in the plasma by there being a positive plasma potential throughout the pulsed period. The peak plasma potential is 13 V during low power and 14 V during high power. Unlike pulsed systems where the power is turned off, the plasma potential does not dissipate during the low-power period which would then allow negative ions to diffuse out of the plasmas. With the Cl2+ density also fairly stable through the period, the loss term of the Cl− is also fairly constant.
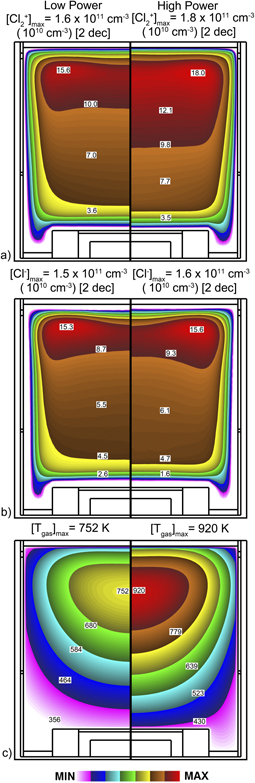
Figure 3. Plasma properties for the base case (Ar/Cl2 = 5/95, 20 mTorr, 96 W–160 W) at 0 μs (end of the low-power) and 100 μs (end of the high power) during the power pulse. (a) Cl2+ density, (b) Cl− density and (c) gas temperature. Maximum value, range of values plotted and units for contour labels are indicated in each image.
Download figure:
Standard image High-resolution image
Figure 4. Axial distribution of electron and Cl− densities at mid-radius of wafer at (a) end of the low-power pulse (0 μs) and (b) end of the high-power pulse (100 μs).
Download figure:
Standard image High-resolution imageThe maximum gas temperature is modulated during the pulsed cycle by about 170 K (752 K during low power and 920 K during high power.) Heating is nearly instantaneous with the application of power while the dominant gas cooling is by thermal conduction to the walls. (There are smaller contributions due to injection of cool gas and pumping of hot gas.) These thermal heating and cooling time scales are short compared to the gas convective time scale, and so there is less modulation in the gas density. As a result, there are pressure oscillations during the pulsed period [27].
The aspect ratio of the ICP reactor has important implications on the local densities of charged particles. In this work, the reactor has a fairly large aspect ratio (height divided by radius) with the power deposition and electron impact ionization being limited to a few cm at the top of the reactor within the electromagnetic skin depth. Transport processes then convect power and density from the skin depth to the lower portion of the reactor. For example, ne and Te are shown at mid-radius of the wafer as a function of time for different heights in figure 5. Within the electromagnetic skin depth (height = 11 cm), ne is fairly constant during the high- and low-power periods with a change in density commensurate with the change in power. At locations further from the skin depth, the electron density is smaller while the relative modulation in ne is also smaller. Moving further from the source, there is an increasing positive slope in ne as a function of time during the high-power pulse and an increasingly more negative slope in ne as a function of time during the low-power pulse. These trends result from the finite transport time for the excess electron density produced during the high-power to translate to the bottom of the reactor. The time for transport of the electrons from the top to the bottom of the reactor is commensurate with the pulsed period. Therefore, the increase and decrease in plasma density that is experienced in real-time with power modulation at the top of the reactor is averaged over the cycle at the bottom of the reactor.
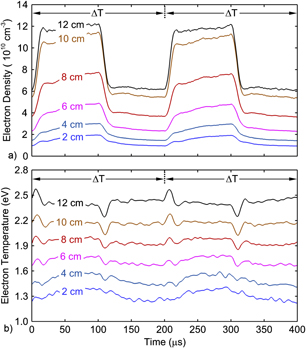
Figure 5. Time dependence of (a) electron density and (b) electron temperature at different heights above the substrate and mid-radius over 2 pulse periods (Ar/Cl2 = 5/95, 20 mTorr, 96 W–160 W). These heights are noted in figure 1. The results for electron temperature have been numerically smoothed.
Download figure:
Standard image High-resolution imageThe high- and low-power periods are long enough, 100 μs, that the plasma in the skin depth comes into a quasi-steady state during both the high- and low-power periods. For quasi-steady state conditions, the electron temperature Te is determined by a balance between sources by electron impact ionization and Penning reactions, and losses by attachment, recombination and transport out of the skin depth. In the skin depth, the fractional dissociation, 47%, is nearly constant during the high- and low-power, and the change in gas rarefaction between the high- and low-power, 15%, is not large. As a result, Te during the low- and high-power periods is similar—the value at which sources and losses balance each other. The power deposition is, to first order, nekL(Te)Ng, where kL(Te) is the rate coefficient for power loss (which increases with increasing Te) and Ng is the gas density. With Te and Ng being similar during the low- and high-power, then a change in power requires a change in ne. The change in ne is downwards when going from high-to-low power and upwards when going from low-to-high-power. These transitions in turn require that Te momentarily decrease below the self-sustaining value in transitioning from high-to-low power to lower the electron density. Similarly, Te must momentarily increase above the self-sustaining value when transition from low-to-high power to increase electron density.
A similar interpretation of the need for spikes (up or down) in Te, comes from the perspective of power dissipation. With an instantaneous, step-function increase in power deposition, there is not sufficient time for the electron density to increase to accommodate the increase in power. To enable the increase in power deposition, Te must increase, which usually also increases the rate of power dissipation per electron. Similarly, if there is an instantaneous decrease in power, there is insufficient time for the electron density to decrease to accommodate the decrease in power. To enable the decrease in power deposition, Te must decrease, which usually also decreases the rate of power dissipation per electron. The duration of the spikes in Te (up or down) is then the time required for the electron density to change from the low-to-high values (or vice-versa).
These spikes in Te are shown in figure 5, and occur dominantly in the skin depth where power deposition is maximum—positive spike for low-to-high power and negative spike for high-to-low power. When translating lower in the reactor and further from the skin depth, Te decreases due to collisional power losses. The local heating sources are superelastic collisions (a small contribution), thermal conduction by bulk electrons or non-local transport in the tail of the EED. The spikes in Te also dissipate and broaden in time, as thermal conductivity and convection translate the pulse of hotter electrons (low-to-high power) or cooler electrons (high-to-low power) to lower heights. The end result is that Te appears to have periodic waves close to the wafer.
The EEDs at the end of the high- and low-power periods are shown in figure 6. At the top of the reactor, the EEDs are almost Maxwellian due to the high e–e collision frequency and higher Te. Moving away from the power source, the EEDs gradually shift to a bi-Maxwellian with a lower temperature bulk (1.0 eV) and higher temperature tail (1.9 eV). The bulk Te decreases in translating lower in the reactor due to the lower frequency of e–e collisions and collisional power loss. The tail Te is relatively constant (or decreases less than the bulk Te) as the tail is sustained by non-local transport of high energy electrons that are accelerated in the skin depth and have longer mean free paths. There are no significant differences between the EEDs at the end of the low- and high-power periods. First, the Te is essentially the same in the skin depth at the end of the low- and high-power periods, and so the power deposition-per-electron is the same. As a result, the EED in the skin depth is essentially the same. Lower in the reactor, the tail of the EED has a higher temperature at the end of the high-power period compared to the low-power period. This is likely a result of the higher thermal conductivity afforded by the higher electron density.

Figure 6. EEDs at different heights above the substrate at mid-radius of the wafer at the (a) end of the high-power pulse (100 μs) and (b) end of the low power pulse (0 μs). (Ar/Cl2 = 5/95, 20 mTorr, 96 W–160 W.) These heights are noted in figure 1. The EEDs have been numerically smoothed.
Download figure:
Standard image High-resolution image3.1. Gas mixture
In a pure rare gas mixture at low pressure (without dimer ions), loss of electrons and ions is dominated by diffusion to surfaces where they recombine. If in a pulsed system, the period is shorter than the time for ions to diffuse to surfaces, then the plasma source is effectively averaged over the pulse period. The plasma density will then not directly track the variation in power deposition. When increasing the Cl2 mole fraction in an Ar/Cl2 gas mixture, the rate of electron loss by dissociative attachment increases and the electron density is more modulated during the pulsed period. This increased rate of modulation of the plasma density then requires a larger modulation in Te.
The Cl2 mole fraction in the Ar/Cl2 gas mixture was varied from 20% to 80%, and the resulting electron densities are shown in figure 7 at the end of the high-power part of the cycle. The electron densities and temperatures at heights of 11 cm and 2 cm above the substrate are shown in figures 8 and 9 during the pulsed cycle. The PRF (5 kHz), DC (50%) and low/high power (96 W/160 W) are the same as in the base case.
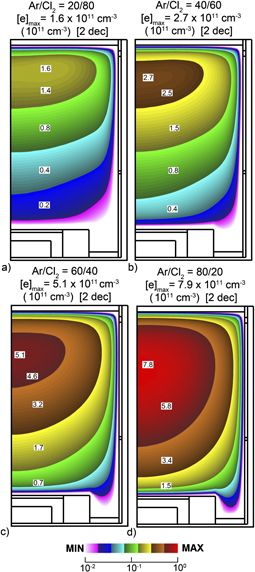
Figure 7. Electron density at the end of the high-power pulse (100 μs) for gas mixtures of Ar/Cl2 = (a) 20/80, (b) 40/60, (c) 60/40 and (d) 80/20. (20 mTorr, 96 W–160 W.) The contours are plotted on a 2-decade log scale with the maximum value in each frame noted. Contour labels have units of 1011 cm−3.
Download figure:
Standard image High-resolution image
Figure 8. Electron density as a function of time for different values of the Cl2 mole fraction at (a) 11 cm above the substrate and (b) 2 cm above the substrate. (20 mTorr, 96 W–160 W.)
Download figure:
Standard image High-resolution image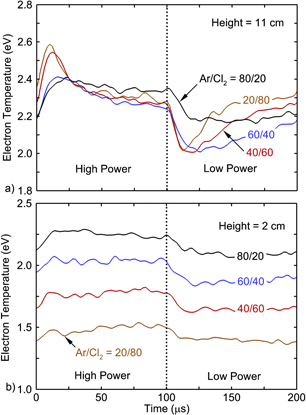
Figure 9. Electron temperature as a function of time for different values of the Cl2 mole fraction at (a) 11 cm above the substrate and (b) 2 cm above the substrate. (20 mTorr, 96 W–160 W.) The values for Te have been numerically smoothed.
Download figure:
Standard image High-resolution imageWith the increase in Cl2 mole fraction, the power deposition per electron increases and so on this basis alone, for a given power density, the electron density decreases. We see this trend in the electromagnetic skin depth where power deposition is maximum—ne increases from 1.6 × 1011 cm−3 for an Ar/Cl2 = 20/80 mixture to 7.9 × 1011 cm−3 for an Ar/Cl2 = 80/20. As electrons diffuse out of the power deposition region, the Te of these electrons decrease more rapidly with increasing Cl2 mole fraction. For Cl2, which is a thermally attaching gas, the rate of dissociative attachment increases with decreasing Te, which lowers the average electron density even further. As a result, there is a more severe gradient in electron density between the top and bottom of the reactor with large Cl2 mole fraction. For the Ar/Cl2 = 80/20 mixture, ne decreases by a factor of 2.2 from the top to the bottom of the reactor. For the Ar/Cl2 = 20/80 mixture, this decrease is by a factor of 7.5.
The electron density at the top of the reactor (height = 11 cm) is essentially in phase during the pulse-period—increasing when the power is high and decreasing when the power is low. With the power deposition being limited to the skin depth, there is a time-delay (phase offset) for the increase in plasma density to propagate from the top of the reactor to the bottom of the reactor. This delay is 10–15 μs for the Ar/Cl2 = 80/20 mixture and decreases with increasing Cl2 mole fraction. At the same time, the degree of modulation in the plasma density decreases from the top of the reactor to the bottom of the reactor. In the skin depth, the electron density is modulated by a factor of 2. Above the substrate, the modulation is a factor of 1.5. The phase delay and decrease in modulation in plasma density are both a consequence of the finite propagation time for the pulse of higher electron density during the high-power period to propagate across the reactor.
In transitioning from low-to-high power, which requires an increase in plasma density, Te must at least momentarily increase above the quasi-state self sustaining values. In transitioning from high-to-low power, which requires a decrease in plasma density, Te must at least momentarily decrease below the quasi-state self sustaining values. The magnitudes of these momentary increases and decreases in Te get larger with increasing Cl2 mole fraction. Te in the skin depth (height = 11 cm) as a function of Cl2 mole fraction is shown in figure 9(a). The leading positive spike of Te (low-to-high power) increases by about 0.2 eV between a mole fraction of 20% and 80%. This increase is required to offset the additional electron losses by dissociative attachment.
The initial positive spike in Te produces excess ionization that persists during the high-power pulse. Based on the additional losses inherent to the more chlorine rich Ar/Cl2 = 20/80 mixture, one would expect Te to be higher during the pulse in than in more dilute mixtures. This is not the case, as Te is marginally lower for the chlorine rich mixtures during the pulse. The excess ionization produced by the positive leading spike in Te enables a lower Te in the chlorine rich mixtures during the high-power pulse. During the low-power period, Te is higher for higher Cl2 mole fractions. In transitioning from high-to-low power, there is no ionization excess and so Te is higher in the more chlorine rich mixtures to offset the additional electron losses.
Te for different Cl2 mole fractions 2 cm above the substrate is shown in figure 9(b). The electron transport time from top-to-bottom of the reactor is 10–20 μs, which is also about the duration of the leading spikes and decreases in Te in the skin depth. As a result, these spikes and decreases in Te are dissipated and averaged over the high- and low-power periods by the time the transients reach the substrate. The end result is that there are imperceptible spikes (positive or negative) in Te above the substrate. However, the low-to-high power positive spike in Te, and the high-to-low power negative spike in Te in the skin depth, when convected to the substrate, produces a temperature that is 0.1 to 0.2 eV higher during the high-power than during the low-power.
With there being increasing collisional losses with increasing Cl2 mole fraction while the electrons transport from the source region to the substrate, Te above the substrate decreases by 0.7 eV with increasing mole fraction (20%–80%). A portion of this decrease can be attributed to the lower electron thermal conductivity due to the lower electron density with a large Cl2 mole fraction. The lower thermal conductivity reduces the diffusion of thermal energy from the source region to the substrate.
3.2. Power ramp-down time
For the pressures and gas mixtures investigated here, the time for the system to respond to step function changes in power deposition is the response time τR = 10–30 μs. If the change in power is over times longer than τR, then the plasma will track the change in power in a quasi-steady state manner. That is, the electron density and temperature will be nearly in equilibrium with the instantaneous power. When ramping down in power, there must still be a decrease in Te below the self-sustaining value to enable a decrease in plasma density; and there must be increases in Te above self-sustaining when ramping up in power. However, for long enough ramp times these changes may be imperceptible. If the power ramping time, τ, is commensurate or shorter than τR, then the Te must undergo significant excursions in order to increase power dissipation while increasing electron density (ramp up) or decrease power dissipation while decreasing electron density (ramp down).
The power ramp-down time, τ, was varied from 10 μs to 80 μs while the ramp-up time remained at 10 μs. The corresponding Te at heights of 11 and 2 cm are shown in figure 10, and the corresponding ne are in figure 11. The low- and high-power periods are long enough that the quasi-steady state electron densities are nearly the same, independent of ramp time τ. Having said that, larger values of τ result in higher average power deposition. (Between a ramp time of 10 and 80 μs, the average power increases from 128 W to 139 W.) As a result, there is proportionately more dissociation of the Cl2 and more gas heating, which results in the electron density being about 10% higher with the longest ramp time. That aside, the conditions for low-to-high power are nearly the same for all ramp times. As a result, the initial spikes in Te in the skin depth (height = 11 cm) are also nearly independent of τ.
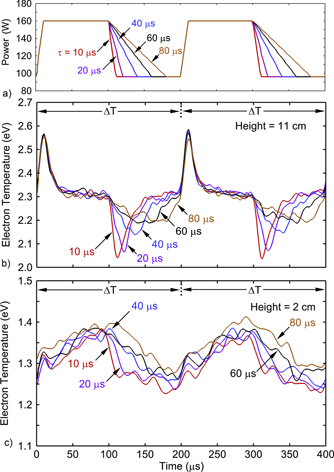
Figure 10. Electron temperature while varying the power ramp-down time. (a) Power profiles for ramp-down times from 10 to 80 μs. Electron temperature for different ramp-down times at (b) 11 cm above the substrate and (c) 2 cm above the substrate. (Ar/Cl2 = 5/95, 20 mTorr, 96 W–160 W.) These values of Te have been numerically smoothed.
Download figure:
Standard image High-resolution image
Figure 11. Electron density while varying the power ramp-down time. (a) Power profiles for ramp-down times from 10 to 80 μs. Electron density for different ramp-down times at (b) 11 cm above the substrate and (c) 2 cm above the substrate. (Ar/Cl2 = 5/95, 20 mTorr, 96 W–160 W.)
Download figure:
Standard image High-resolution imageAs τ increases from 10 to 80 μs, the length of power-down period begins to exceed the plasma response time τR. In doing so, the downward spike in Te becomes less severe—0.3 eV for τ = 10 μs to less than 0.1 eV for τ = 80 μs. If we extend τ to 100 μs, the change in Te is within the statistical noise of the simulation. Above the substrate, Te shows the transit time delay and smoothing of the initial spike for the low-to-high power transition (discussed above). During the low power period, Te is higher for τ = 80 μs compared to shorter ramp times due to the lack of the downward spike in Te. However, all of these variations are within 0.15 eV.
With the exception of the aforementioned increase in ne due to the higher average power for large τ, ne in the skin depth closely tracks the ramping down of the power. At 2 cm above the substrate, the averaging of power deposition over the electron transit time of 10–30 μs from the skin depth makes the electron density less well correlated with the ramp-down time.
3.3. Magnitude of low power
For otherwise the same conditions, if the length of the low- and-high-power periods are long enough to achieve the steady state, Te should be independent of the magnitude of power during the low- and high-power periods. That value of Te is given by ionization sources being balanced by losses. In practice, there are average power effects that must be considered. For example, consider keeping the high-power constant and varying the low-power. Increasing low-power increases the average power deposition, which results in more dissociation of Cl2, more gas heating and higher average plasma density. More dissociation of Cl2 reduces the rate of electron loss by dissociative attachment. More gas heating produces rarefaction which increases loss by diffusion and reduces ion–ion neutralization rate coefficients. Higher plasma densities increase the rates of dissociative recombination and ion–ion neutralization. The end effect on Te becomes case specific.
Electron temperatures at heights of 11 cm (in the skin depth) and 2 cm (above the wafer) are shown in figure 12 while varying the low-power (PL) from 32 W (20% of the high-power) to 160 W (equal to the high power). The electron densities for these conditions are shown in figure 13. When increasing PL from 32 W to 160 W, the average power deposition increases from 96 W to 160 W, the fractional dissociation of Cl2 increases from 38% to 44%, and the gas temperature increases from 568 to 573 K. The increase in fractional dissociation of Cl2 largely enables the quasi-steady state value of Te in the skin depth to decrease by 0.13 eV when PL increases from 32 W to 160 W. With this increase in fraction dissociation of Cl2, the electron density during the constant high-power 160 W increases from 9.4 × 1010 cm−3 for PL = 32 W to 1.4 × 1011 cm−3 for PL = 160 W.
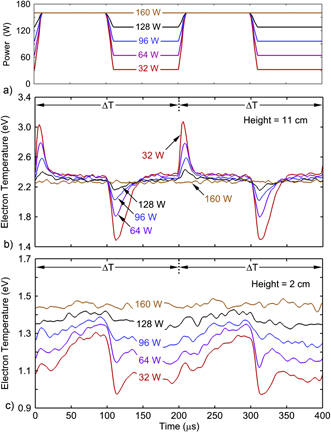
Figure 12. Electron temperature while varying the low power during the cycle. (a) Power profiles for low powers of 32 W–160 W. Electron temperature for different low powers at (b) 11 cm above the substrate and (c) 2 cm above the substrate. (Ar/Cl2 = 5/95, 20 mTorr, 160 W high power.) These values of Te have been numerically smoothed.
Download figure:
Standard image High-resolution image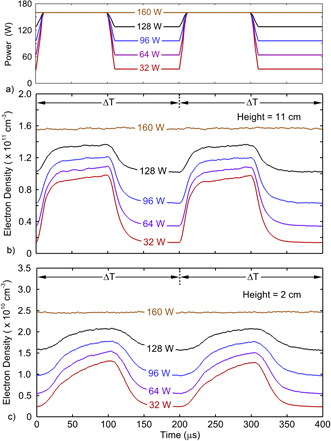
Figure 13. Electron density while varying the low power during the cycle. (a) Power profiles for low powers of 32 W–160 W. Electron density for different low powers at (b) 11 cm above the substrate and (c) 2 cm above the substrate. (Ar/Cl2 = 5/95, 20 mTorr, 160 W high power.)
Download figure:
Standard image High-resolution imageThe low- to high-power spike in Te increases from zero for PL = 160 W, as this is a continuous plasma, to 0.85 eV for PL = 32 W. This increasing overshoot in Te with decreasing PL is required to avalanche the plasma from progressively lower plasma density to that for the high-power. For example, for PL = 32 W, the electron density increases by factor of 6.9 from low- to high-power. The magnitude of the high- to low-power decrease in Te increases with PL decreasing from 160 to 32 W. Reducing PL requires a larger change in ne which is produced by a larger negative excursion of Te below the steady state. The high- to low-power decrease in Te is 0.9 eV for PL = 32 W and 0.26 eV for PL = 96 W.
Te has a small decrease in its steady state value in the skin depth (height = 11 cm) during the high- and low-power periods. There is a 0.13 eV decrease in Te from PL = 160 W to PL = 32 W. This change is largely a result of the higher average power with PL = 160 W producing more dissociation of Cl2 and so fewer attachment losses. However, above the substrate (height = 2 cm) there is significant variation of Te for different PL. For example, at the end of the high-power period, Te is 0.1 eV lower for PL = 32 W compared to PL = 160 W. This is the opposite trend compared to the skin depth (height = 11 cm) where PL = 160 W has the lower Te. The net change in Te from the skin depth to the wafer (from high to low PL) is a decrease of 0.23 eV. With PL = 32 W, the average power is lower, the dissociation of Cl2 is lower, the Cl2 density is higher and the electron density is lower. As a result, there are more collisional losses and less thermal conduction from the skin depth as electrons transport down toward the substrate. The end result is a lower Te.
During the low-power period above the substrate, the decrease in Te (PL = 32 W compared to PL = 160 W) is 0.35 eV whereas in the skin depth, Te for PL = 160 W is lower by 0.13 eV. The net change in Te is 0.5 eV from the skin depth to the wafer, about twice the change as during the high-power period. Since the fractional dissociation is essentially the same during the high- and low-power periods, the larger decrease in Te can be attributed to the lower thermal conductivity due to the lower electron density with PL = 32 W. This lower thermal conductivity is likely also responsible for the slow increase in Te during the high-power portion of the pulse.
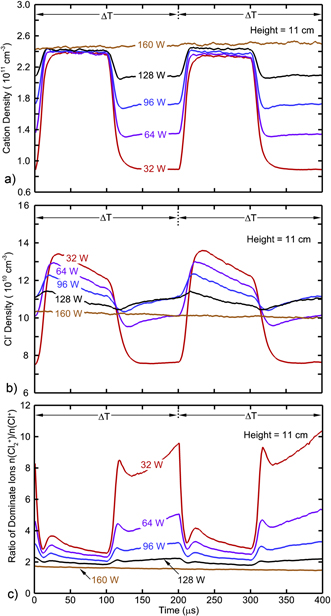
The densities of all the cations (Cl2+, Cl+, Ar+, and Ar2+), density of Cl− and the ratio of the densities of the dominant cation Cl2+ and Cl+ (α = [Cl2+]/[Cl+] in the skin depth (height = 11 cm) are shown in figure 14 for different values of PL. Among the cations, the dominant species are Cl2+ and Cl+, which have densities 2–3 orders of magnitude higher than the densities of Ar+ and Ar2+. During the high-power part of the cycle, the cation density is nearly constant whereas the Cl− density increases by 30% from PL = 160 W to PL = 32 W. The decrease in Cl− density with increasing PL is partly due to the increase in fractional dissociation of Cl2 (53%–73%) with increasing power—low Cl2 density translates to lower rates of dissociative attachment—and increased rarefaction in the skin depth at the higher power. α = [Cl2+]/[Cl+] is particularly sensitive to the PL and increases with decreasing PL. Again, this is in part explained by the lower fractional dissociation at low PL. The lower fractional dissociation not only reduces the rate of ionization of atomic Cl but also increases the rate of charge exchange of Cl+ with Cl2 to form Cl2+.
Figure 14. Plasma properties 11 cm above the substrate while varying the low power during the cycle. (Ar/Cl2 = 5/95, 20 mTorr, 160 W high power.) (a) Total cation density, (b) Cl− density and (c) ratio α =  .
.
Download figure:
Standard image High-resolution image
4. Concluding remarks
In this paper, an inductively coupled plasma driven by a low-high pulsed power sustained in Ar/Cl2 mixtures at 20 mTorr was computationally investigated. Similar to an on-off pulsed plasma, the electron temperature Te spikes in the electromagnetic skin depth at the beginning of the high-power portion of the cycle. A downward spike of Te occurs in the skin depth during power transition from high-to-low power, while Te is nearly the same value (and constant) during the low- and high-power periods. Te is largely determined by a balance between electron heating by the electric field and power losses, which in the skin depth includes both collisions and advection out of the skin depth. With the gas density nearly constant during the pulsed cycle the increase in Te above the steady-state value is required at the leading edge of the low-to-high power to increase the ionization rate to reach a higher plasma density required to sustain the high-power portion. Analogously, a decrease in Te below the steady-state value is required at the leading edge of the high-to-low power to decrease the rate of ionization and increase the rate of attachment. As the low-to-high (and high-to-low) power ramping time increases and exceeds the energy relaxation time, the leading edge transients in Te become less severe. For long ramping times, the transients become nearly indistinguishable.
The response of the plasma to the low-high and high-low power changes is highly spatially dependent. For example, the spikes of Te are distinct in the skin depth while being elongated transients near the substrate. Similarly, the modulation in electron density in the skin depth closely tracks power deposition while ne is dispersed in time near the substrate. Both transients in Te and ne are delayed near the substrate relative to the skin depth. The electron transport time across the reactor, (10–30 μs) is commensurate with the time of the power transition, and so produces a delay in the transients in the skin depth. During this transport in density and temperature across the reactor, power is collisionally dissipated while thermal conduction disperses the heat pulse. As a result, the spikes (positive and negative) in electron temperature and steps in electron density originating in the skin depth are dispersed in time and in space upon reaching the substrate.
For pulse repetition rates in ICPs that are high enough that the gas density and mole fractions do not significantly change during the pulses, spikes of Te (positive or negative) should be expected during power transitions. However, these spikes are strictly only required in the skin depth where power deposition occurs. The magnitude, duration and phase of the transients in Te and ne are first functions of distance from the skin-depth, and second are functions of the absolute plasma density that controls the thermal conduction of electron power from the skin depth. A third consideration is the non-local transport of electrons in the tail of the energy distribution function which have a longer mean-free-path than the electrons in the bulk of the distribution. For conditions where non-local effects dominate, the convection of electron power from the skin depth to lower in the reactor will be more rapid and efficient.
Acknowledgments
The authors thank Priyanka Arora and Vincent M Donnelly of the University of Houston for valuable discussions. This work was supported by Samsung Electronics Co. Ltd. and Lam Research Inc. This material was also based upon work supported by the U.S. Department of Energy, Office of Science, Office of Fusion Energy Sciences under award number DE-SC0020232.