
Abstract
The required heating power,  , to access the high confinement regime (H-mode) in tritium containing plasmas is investigated in JET with ITER-like wall at a toroidal magnetic field of
  T and a plasma current of
  MA.
MA.  , also referred to as the L-H power threshold, is determined in plasmas of pure tritium as well as mixtures of hydrogen with tritium (H-T) and mixtures of deuterium with tritium (D-T), and is compared to the L-H power threshold in plasmas of pure hydrogen and pure deuterium. It is found that, for otherwise constant parameters,
  is not the same in plasmas with the same effective isotope mass,
  , when they differ in their isotope composition. Thus,
  is not sufficient to describe the isotope effect of
  in a consistent manner for all considered isotopes and isotope mixtures. The electron temperature profiles measured at the L-H transition in the outer half of the radius are very similar for all isotopes and isotope mixtures, despite the fact that the L-H power threshold varies by a factor of about six. This finding, together with the observation of an offset linear relation between the L-H power threshold,
  , and an effective heat diffusivity,
  , indicates that the composition-dependent heat transport in the low confinement mode (L-mode) determines, how much power is needed to reach the necessary electron temperatures at the edge, and hence
  .
.
Export citation and abstract BibTeX RIS

Original content from this work may be used under the terms of the Creative Commons Attribution 4.0 license. Any further distribution of this work must maintain attribution to the author(s) and the title of the work, journal citation and DOI.
1. Introduction
Tokamak fusion reactors with a magnetic configuration similar to ITER [1], are foreseen to be operated in the high confinement regime (H-mode) in order to reach the required confinement properties [2]. The H-mode can be accessed in a plasma of low confinement (L-mode) by exceeding a certain threshold of injected heating power, the L-H power threshold,  . A regression of an ITPA multi-machine data base
17
of deuterium plasmas resulted in a scaling law of the L-H power threshold [3]:
. A regression of an ITPA multi-machine data base
17
of deuterium plasmas resulted in a scaling law of the L-H power threshold [3]:

which identified the line-averaged core electron density,  , the toroidal magnetic field, Bt
, and the surface of the plasma, S, as some of the main parameters determining the L-H power threshold. Please note that this scaling applies only for the high-density branch, i.e. for densities above
, the toroidal magnetic field, Bt
, and the surface of the plasma, S, as some of the main parameters determining the L-H power threshold. Please note that this scaling applies only for the high-density branch, i.e. for densities above  , which indicates the density where
  is minimum in the typically U-shaped curve of
  . Several more parameters were identified to additionally impact
  like plasma shape, wall material, impurity concentrations, and toroidal rotation [4–12]. However, the relatively simple parameter dependencies of the ITPA scaling have already proven to strongly impact the design of a future tokamak reactor [13], and more complex dependencies could further restrict the reactor operational point. Therefore, for a reliable and robust tokamak reactor design it is required to predict and understand the L-H power threshold as accurately as possible.
The ITPA scaling  , which is also used to assess
  in the nuclear and non-nuclear operation phase of ITER [14], only applies to deuterium plasmas. Thus, for the reactor relevant fuel mixture of deuterium-tritium or other isotopes or isotope compositions, the isotope dependence of
  has to be assessed and equation (1) correspondingly extended. The most common and simplest approach to factor in isotope dependences of
  is to introduce an effective isotope mass,
  , which can be determined from the densities of the different isotopes of the plasma as:
with the densities nH , nD , and nT of hydrogen (H), deuterium (D) and tritium (T), respectively. Data of comparative studies in hydrogen and deuterium plasmas [15–18] suggest an inversely proportional dependence on the effective isotope mass:

A similar dependence on  was found in tritium containing plasmas in JET with plasma facing components (PFCs) made of carbon [19]. Based on these findings, we assume in the following, that the scaling:

is a reasonable and data based parametrization of  in the high-density branch, which describes the main dependences including isotope effects properly, and serves as a reference for the data discussed in the following. Please note that the prefactor of the scaling
  differs from equation (1) by a factor of two in order to make both scalings consistent for deuterium corresponding to
  .
.
Similar as done in [20], we contrast data from JET with ITER-like wall (ILW) at a toroidal magnetic field of  T and a plasma current of
  MA collected during the tritium campaign 2020/2021 with
  in order to identify main differences and similarities of the new data in metallic wall conditions with existing scaling laws. The data set at hand includes two data points of the reactor-relevant fuel mixture of D-T, and it contains a T concentration scan of H-T mixed plasmas allowing for a fine variation of
  . This enables a direct comparison of
  in plasmas with the same
  but different isotope compositions. It is shown below, that
  is not sufficient to describe the isotope dependence of
  consistently for the considered isotopes and isotope mixtures. The data rather points to the heat transport in L-mode as a key player determining
  by defining the relevant loss channel, which counteracts the input heating power to reach the edge temperatures required for the L-H transition.
In the remainder, we introduce in section 2 the data set of tritium containing plasmas in JET with ILW, and the L-H power threshold as well as the radiation fraction is presented for different isotope mixtures. In section 3 we contrast the data with equation (4) revealing that  cannot describe the isotope effect of the L-H transition consistently. The profiles at the L-H transition and the possible crucial role of transport is discussed in section 4 before a summary and conclusion is given in section 5.
2. The power threshold in tritium containing plasmas
In order to investigate the effect of the effective isotope mass,  , and heat transport on the L-H power threshold
  , we consider a data set acquired in the tritium campaign 2020/2021 at JET with ILW similar to the data presented in [20]. The data was taken at a toroidal magnetic field of
  T and a plasma current of
  MA. The geometry of the divertor is called MkII-HD (see [4]), the PFC material was tungsten in the divertor and beryllium at the main chamber wall, and the plasma configuration (favorable configuration with the ion
  -drift direction towards the active X-point) was a lower single null plasma with the outer strikeline on the horizontal target of the divertor referred to as HT configuration as in [8]. The new data differs in the following three main aspects from the data discussed in [20]: (i) it contains only data with proper phasing of the ion cyclotron heating (ICRH) antenna, (ii) it contains not only two different concentration levels, but in total seven steps of tritium concentration in mixtures of H-T plasmas, and (iii) it contains two data points of a 50%/50% mixture of D-T. Apart from these differences, the data was taken in the same way from discharges with slow heating ramps and averaging the relevant quantities 70 ms prior to the L-H transition. The L-H transition is identified in diagnostic data by a sudden drop of the Dα
signal indicating lowered edge transport, and a simultaneous and sudden increase of the edge temperature, edge density and the energy content of the plasma indicating improved confinement. Examples of diagnostic time traces of L-H transitions are given in [20].
-drift direction towards the active X-point) was a lower single null plasma with the outer strikeline on the horizontal target of the divertor referred to as HT configuration as in [8]. The new data differs in the following three main aspects from the data discussed in [20]: (i) it contains only data with proper phasing of the ion cyclotron heating (ICRH) antenna, (ii) it contains not only two different concentration levels, but in total seven steps of tritium concentration in mixtures of H-T plasmas, and (iii) it contains two data points of a 50%/50% mixture of D-T. Apart from these differences, the data was taken in the same way from discharges with slow heating ramps and averaging the relevant quantities 70 ms prior to the L-H transition. The L-H transition is identified in diagnostic data by a sudden drop of the Dα
signal indicating lowered edge transport, and a simultaneous and sudden increase of the edge temperature, edge density and the energy content of the plasma indicating improved confinement. Examples of diagnostic time traces of L-H transitions are given in [20].
A few of the pure T plasmas in the data set were heated with neutral beam injection (NBI) using a T heating beam, while most of the plasmas were heated with ICRH. H plasmas or H-T mixed plasmas with a tritium concentration of up to 95%, were heated with ICRH at a frequency of 51.4 MHz corresponding to the second harmonic ( ) in hydrogen. For tritium concentrations above 95% in H-T mixtures as well as for D-T plasmas, hydrogen minority heating at the fundamental frequency (
 ) was employed corresponding to a wave frequency of f = 32.2 MHz. Since we consider only plasmas heated with low power T-NBI and ICRH, the data set at hand contains only plasmas with low torque input. The concentrations of hydrogenic species were measured with an optical penning gauge in the subdivertor [21, 22]. For more details about the experimental approach the reader is referred to [20].
As usual, we use the total loss power:
with the Ohmic heating power  , any other auxiliary heating power
  and the time derivative of the plasma energy content
  as estimation of
  , which was likewise used for the ITPA multi-machine data base [3]. All quantities are averaged over 70 ms prior to the L-H transition, which takes place at time
  . Because of the typically strong rise of the (diamagnetic) energy content
  at the time point of the L-H transition, we do not take
  at
at  , but 100 ms earlier than
  in order that
  is not affected by the L-H transition induced changes. Due to the relatively high radiation levels at the L-H transitions in JET, it turned out that the data is more consistent if the bulk radiated power
  , i.e. the radiated power inside the magnetic separatrix, is subtracted. The resulting power is the kinetically transported power through the separatrix:

 of the tritium containing plasmas is shown in figure 1, left. Starting at pure hydrogen plasmas (red circles), which exhibit the highest L-H power thresholds, a stepwise increase of the T content in H-T mixed plasmas (open red diamonds, T concentration given next to the respective symbol in percent) reduced the
  consecutively. The observation of lower
  with increasing T concentration, and hence increasing
  , is qualitatively in agreement with equation (3).
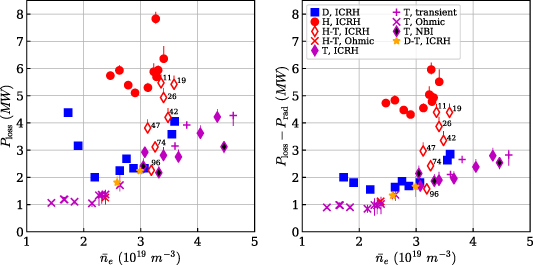
Figure 1.
 (left) and
  (right) against line-averaged core density
  for different main ion plasma isotopes and isotope mixtures heated with different heating schemes. The data points labeled as 'transient' are dithering L-H transitions and were heated with ICRH. The numbers next to the symbols of the H-T mixed plasmas indicate the tritium concentration in percent.
Download figure:
Standard image High-resolution image
 determined in pure T plasmas (magenta symbols) cover a wide density range and show in general the lowest L-H power thresholds for low and high densities. Pure means in this context a T concentration greater than 95% with respect to other hydrogenic species, which is believed to be sufficient for the plasma dynamics to be dominated by T. The T concentration cannot be much further increased, since a small amount of H must always be present for the applied minority heating scheme with ICRH. T plasmas heated with NBI (black filled symbols), have a lower
  than ICRH plasmas (magenta filled diamonds). The lowest values of
  are found for transitions in Ohmically heated phases (x-symbols), which are a peculiarity of T plasmas at this field and current at JET, since other isotopes could not access the H-mode with Ohmic heating on a regular basis. The possibility to access H-mode with Ohmic heating only [23] indicates that the requirements to reach H-mode in T are facilitated compared to the other isotopes similar to Ohmic H-modes found at other devices in other type of low-threshold conditions (typically low magnetic field) [24–26]. In contrast to H and D (blue squares) data, the T data does not show a clear minimum of
  . But the fact that an increase in density let the plasma transition to H-mode resembles the dynamics of transitions in the low-density branch [20], so that the Ohmic transitions in T can be considered as the low-density branch of the T data.
Both pure tritium plasmas and H-T mixed plasmas with T concentrations above 75% and heated with ICRH often transitioned into a dithering L-H transition phase (plus signs) instead of a sustained H-mode as described in [20]. Dithering transitions are likewise observed in other isotopes, however less frequent, and in contrast to T containing plasmas, a sustained H-mode was easier to achieve in plasmas without T by further increasing the heating power. This points to an unfavorable influence of impurity-induced radiation losses on H-mode robustness, which is obviously more severe in T similar as found in He plasmas [27]. This might be related to its enhanced ability to sputter beryllium (Be) more effectively than H or D [28]. The increased Be concentrations could lead to enhanced sputtering of tungsten and, thus, could increase the bulk radiation.
The two data points of D-T plasmas had a T concentration of about 50% (golden stars) and are within the error bars in the same range as data points of pure D and pure T in the same density range.
If the bulk radiation is subtracted from  , the resulting
  shown in figure 1, right, exhibit the same trends as discussed for
  in figure 1, left. There is however one main difference: The data points of pure T plasmas heated with ICRH possess the same
  as NBI-heated pure T plasmas. In other words, the radiation is higher in ICRH plasmas than in NBI-heated plasmas, so that the radiated power compensated the difference of
  between these two differently heated plasma types. Hence,
  in tritium plasmas at 1.8 T does not depend on the torque input. This is a difference to the other isotopes, since
  in D exhibits a very small [27] and in H a very large dependence on the heating method [8].
As shown in figure 2, the radiation fraction at the L-H transition estimated as the ratio between bulk radiation  and input heating power
  is highest for ICRH T plasmas (about 35%) and low density D plasmas (up to 50%). The fact, that NBI-heated T plasmas show very low radiation fractions, reveals, that the presence of T alone is not responsible for high radiation levels. It is rather the combination of high tritium concentrations together with ICRH that produces the highest radiation levels, probably related to ICRH-induced electric fields in the scrape-off layer [29].
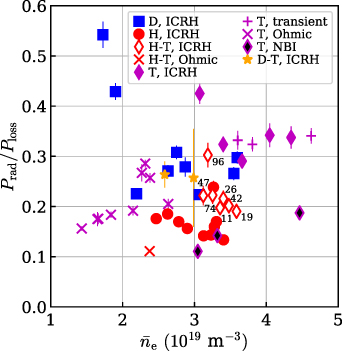
Figure 2. Radiation fraction estimated by the ratio between bulk radiation,  , and input heating power,
  , for different isotopes and heating schemes.
Download figure:
Standard image High-resolution imageD-T plasmas suffer less from high radiation fractions than pure T plasmas and show radiation fractions in the same range as D plasmas. H-T plasmas with T concentrations of 19%–75% exhibit radiation levels of about 20%, which is slightly higher than the pure H plasmas clustering around 15%.
3. The role of  for
for


The data of  and
and  introduced above is now compared to the reference scaling
  as given by equation (4). Figure 3, left, shows the measured
  divided by the scaling
  on the y-axis and the effective isotope mass on the x-axis. Only data from the high density branch is shown, i.e. data for densities higher than the density,
  , where the respective minimum of
  appears, since the scaling only holds for the high density branch [3].
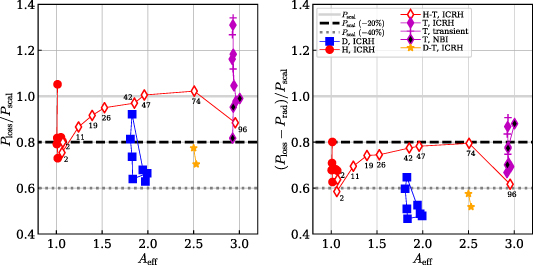
Figure 3.
 (left) and
  (right) normalized to the scaling
  (equation (4)) against effective isotope mass,
  . Only data from the high density branch is shown. The power threshold can vary significantly for the same
  indicating that the isotope effect of
  is not well described by the effective isotope mass.
Download figure:
Standard image High-resolution imageAll data points, except for the pure T heated with ICRH, are around 1.0 or mostly lower. This indicates that the measured values of  are lower than the reference scaling. Plasmas of pure H, pure D, and D-T mixtures are around 20% lower than the scaling. This is a well-known effect of the ILW [4] and most probably related to the fact, that the L-H power threshold is lower in metallic wall conditions than in a carbon wall environment as also found in ASDEX Upgrade [30].
The pure T plasmas heated with ICRH exhibit relatively high normalized power levels  due to the high radiation fraction. This is obvious from figure 3, right, which shows
  , i.e. the normalized power threshold, but corrected from radiation effects: The data for NBI and ICRH plasmas do not differ anymore within the pure T, and
  ranges from about 60% to 90%.
In general, there is a quite remarkable scatter of  within each isotope mass i.e. for a constant value of
  , although the dependence of the density
  is taken into account by the normalization to the scaling (Bt
and S are constant in this data set). This means, that the scaling with its density dependence
is taken into account by the normalization to the scaling (Bt
and S are constant in this data set). This means, that the scaling with its density dependence  does not reflect the experimental density dependence at JET very well. If the scaling would perfectly describe our data, there would be no scatter along the ordinate, since the normalization to the scaling would compensate the density dependence, which is obviously not the case.
For the pure isotopes H, D and T, the quantity  does not show a monotonic behavior: it is lowest for D, highest for T, and H is in between. This means that this data set disagrees with any approach, which tries to describe the isotope effect of the L-H power threshold in the form of
  with any real number α.
 of the H-T mixture with 47% of T concentration corresponding to
  is 65% higher than the data point of the corresponding D plasma at the same density and likewise
  . Similarly, the two D-T data points are much lower than the value of
  of the corresponding H-T mixture with 74% T concentration, although all plasmas had an effective isotope mass of about
  . This clearly shows, that the effective isotope mass is not a good parameter to describe the isotope effect of
  in a sufficient and consistent way. Thus, the actual isotope composition and not the effective isotope mass matters for
  . This means, that any theoretical approach or scaling law aiming at a description of the isotope dependence of
  solely by means of an effective isotope mass
  , will not be able to describe our data sufficiently well.
The ion heating contribution estimated from PION [31] including pitch angle effects [32] for the ICRH and using PENCIL for NBI heated discharges [33] for this data set reveal the same trends as discussed in [20]: For increasing ion mass the ion heating decreases linearly with the T content when starting from pure H towards pure T plasmas during the concentration scan of the H-T mixes plasmas. This seems to be in line with the idea of a critical ion heat flux inversely proportional to  as discussed in [20]. However, the absolute ion heating as well as the ion heating fraction relative to the total heating for pure D plasmas is significantly lower than the H-T counterpart with 47% T concentration. Likewise the ion heating fraction of the D-T plasma is lower than in the H-T mixture with 74% T concentration. In addition, the D-T mixture exhibits the same ion heating fraction as pure D plasmas although they differ in terms of
  . Thus, the isotope dependence of the ion heating contribution, interpreted as a proxy for the edge ion heat flux, behaves similarly as the power threshold itself and cannot consistently be described solely with
  for all isotope mixtures.
4. The role of transport for

As shown before, plasmas of the same  can exhibit different
  when the isotope composition differs. One might expect, that the kinetic profiles at the time of the L-H transition in such cases, e.g. profiles of a D plasma compared with profiles of an H-T mixed plasma with 50% T concentration (both have
  ), are very different, since
  , and hence the input heating power, is very different. However, it turns out, that the electron density profiles and the electron temperature profiles are very similar (even identical within the errors), when the central line-averaged density is matched sufficiently well in these cases.
It is found that the profiles at the L-H transition are similar even for different  , as long as the line-averaged density is the same. This is shown in figure 4, which displays Thomson scattering profiles of the electron density (top left) and the electron temperature (top right) averaged over 200 ms in the L-mode phase prior to the L-H transition for a density range of
  m−3 to
  m−3. These include effective isotope masses
  from 1 to 3 and values of
  ranging from 2.03 to 5.15 MW. The density profiles are very similar, and they exhibit only a relative deviation of 10% with respect to the density profile of the H-T mixed plasma with 50% T content (JPN100102) serving as a reference profile. This small deviation is similar to the measurement error (see figure 4, bottom left) indicating good agreement between these density profiles. Similarly, the electron temperature profiles, especially in the region from half the minor radius (R = 3.4 m) to the edge (R = 3.72 m), agree within 25% relative errors. This is only marginally larger than the measurement error of the diagnostic (see figure 4, bottom right). Thus, both density profiles and electron temperature profiles measured at the L-H transition agree very well for these very different isotope compositions. The energy contents in this set of discharges are likewise very similar (about 0.7 MJ) indicating that the ion temperature profiles cannot be much different from the electron temperature profiles shown here.

Figure 4. Profiles of electron density (top left) and electron temperature (top right) and their relative deviations (bottom) from the profiles of the H-T mixed plasma with 50% T content (JPN100102) from the Thomson scattering diagnostic prior to the L-H transition for different isotope compositions in a density range of  m−3 to
  m−3 (input powers and JET Pulse numbers, JPN, given in the legend).
Download figure:
Standard image High-resolution imageThus, for the same central line-averaged density, the electron temperature and density profiles at the L-H transition are very similar despite the different  and
and  . The finding of similar kinetic profiles at the L-H transition for different isotopes and isotope mixtures is not new and was already described in [8, 34]. But it is impressive to see this effect also present in T containing plasmas and over a now extended range of
  and
and  .
.
For other densities than shown in figure 4, the electron density profiles are, naturally, not the same, since the operation of the plasma was on purpose aiming at different line-averaged densities. However, the electron temperatures at the L-H transition are again very similar for all the different densities and isotope masses of the considered data set. This is shown in figure 5. The left panel shows the total averaged temperature  estimated as
  with V the volume of the plasma. This approach assumes that the electron and ion temperature profiles are the same throughout the plasma, which is a good approximation for higher densities, but fails at lowest densities. Furthermore it assumes that the energy content of the plasma,
  , is not affected by the fast ion pressure and only determined by the thermal bulk of the plasma.
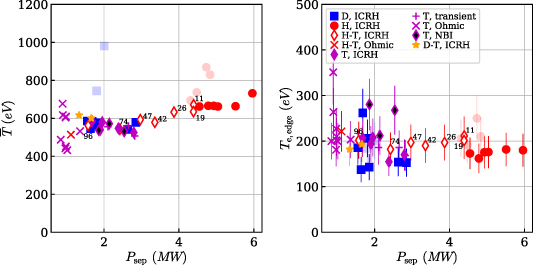
Figure 5. Average temperature,  (left), and edge electron temperature from the ECE diagnostic,
  (right), taken 9.95 cm inside the separatrix. The semi-transparent symbols indicate data from the low density branch.
Download figure:
Standard image High-resolution imageDespite the input power, and hence  , varies by a factor of six, the average temperature
  is quite similar for most of the cases and ranges between 500 eV and 700 eV with a slight upward trend for higher heating power. The semi-transparent symbols correspond to data points from the low-density branch, i.e. plasmas with densities below
  of the respective isotope. They deviate from the main group of the data, which could be related to finite ICRH-induced fast ion contributions to
  at low densities or a mismatch of electron and ion temperatures, so that
  is not a meaningful quantity to draw conclusions about thermal temperature profiles. But for data from the high-density branch,
  is very well aligned for all isotope masses and over a wide range of densities.
Figure 5, right, shows the electron temperature  measured with the electron-cyclotron emission (ECE) diagnostics at the plasma edge at R = 3.725 m, i.e. 9.95 cm inside the separatrix corresponding to a normalized poloidal flux coordinate of
  . The data is quite scattered, but the main part of the data clusters around 200 eV despite the large variation of heating power. In this case, the data of the low-density branch (semi-transparent symbols) is within the errors of the other data points indicating that the temperatures of the thermal plasma are very similar for the whole density and power range.
The data of  and
and  as depicted in figure 5 suggests that the edge temperature at the L-H transition is very similar for a very broad range of input powers and isotope masses as found above for the profiles at the same density (figure 4). However, the data of
  and
and  extends this result to the whole range of densities, so that we can conclude that the mechanism of the L-H transition requires or causes very similar electron temperatures at the edge. Comparably similar electron temperatures at the L-H transition in JET were already reported in [4, 5] for deuterium plasmas. Obviously, this holds likewise for other isotope masses including tritium and is valid for a wide range of input power and densities. This agrees also with results from ASDEX Upgrade, where similar edge temperatures at the L-H transition were found for a wide range of densities [35] and different isotopes [16], and a regression for the edge electron temperature at the L-H transition [36] predicts 200 eV–300 eV for the present conditions, which is in good agreement with our data.
The fact that the electron temperature profiles are very similar at the L-H transition despite the large variation of heating power implies that the plasma transport must be very different for the different isotopes and densities. Otherwise the global power balance  with an effective heat diffusivity
  assuming a single fluid with
  and a constant gradient across the radius would be violated. We can estimate
  directly from our data set due to the relation:
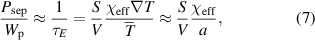
with minor plasma radius a. The first approximation in equation (7) is due to the fact, that the bulk radiation is normally not subtracted in the definition of the energy confinement time τE . The last approximation makes use of the fact that the temperature fall of length is relatively constant for JET L-mode plasmas over large parts of the radius, i.e. outside of R = 3.2 m representing the major part of the plasma volume (see figure 4). With these approximations, we estimate the effective heat diffusivity:

from macroscopic quantities only.  is determined according to equation (6), and all other parameters are taken from the equilibrium reconstruction.
The relation between the L-H transition power estimated as  and the effective heat diffusivity
  is shown in figure 6 for the whole considered data set, i.e. all densities including the low-density branch and all isotope mixtures. The data aligns well with a linear offset fit curve
  , which is only valid for the present plasma shape, toroidal magnetic field of 1.8 T and plasma current of 1.7 MA. The offset linear relation unifies data from the low-density branch (semi-transparent symbols) with data from plasmas with higher densities, and likewise aligns data with a variation of
  from below 1 MW for Ohmic T plasmas to maximum 6 MW of ICRH H plasmas. This indicates that the L-H power threshold is strongly linked to the effective heat transport in the L-mode phase prior to the L-H transition. Thus, the isotope effect of L-mode transport [34, 37, 38] indirectly determines the L-H power threshold, since the transport determines the heating power,
  , needed to reach the necessary temperature profiles at the edge, which are required to let the plasma transition into H-mode.

Figure 6. Relation between L-H power threshold estimated as  and the effective one fluid heat diffusivity
  . The offset linear relation suggests that the L-H power threshold is strongly linked to the transport in L-mode prior to the transition. Semi-transparent symbols indicate data from the low-density branch.
Download figure:
Standard image High-resolution imageThe linear offset relation between  and
and  explains why the L-H power threshold for the pure deuterium plasma was lower than in the corresponding H-T mixture with 47% T content (both have
  ): The transport in the pure deuterium plasma (
 m2 s−1) is lower than the transport in the H-T mixture (
 m2 s−1), and thus
  is lower. The same relation holds for the comparison between the D-T plasma (
 m2 s−1) and the H-T mixture with 74% T content (
 m2 s−1), which both have
  . This data clearly demonstrates, that the heat transport quantified by
  can be very different for the same effective isotope mass
  , and consequently the L-H power threshold is very different. This implies that
  is not a good parameter to describe the isotope effect of transport consistently, similarly as concluded for the isotope effect of
  .
.
5. Summary and conclusion
For JET plasmas in ILW in HT plasma configuration at a magnetic field of  T and a plasma current of
  MA we estimated the L-H power threshold,
  , for an unprecedented variety of hydrogenic isotope compositions including tritium containing plasmas like H-T and D-T mixtures. This allowed for scanning the isotope mass and hence
  in a wide range for otherwise identical parameters. The main results of the investigation of this data set are the following:
-
can differ significantly for plasmas with the same and otherwise constant parameters, when the isotope composition is different.
- The (edge) electron temperatures are very similar for a very wide range of densities, isotope masses and input powers.
- There is a linear offset relation between and the effective heat diffusivity in the L-mode prior to the L-H transition.


This observations suggest that the L-mode transport eventually determines  , since it is the transport, that defines how much input power is needed to reach the edge temperatures required for the L-H transition. Due to this, the isotope dependencies of L-mode transport directly pass into the isotope dependencies of
  . Consequently,
  is different for the same
  and otherwise constant parameters due to the L-mode transport, which obviously differed in the considered cases with different isotope composition.
It is important to understand the isotope dependence of the L-H power threshold, in order to correctly extrapolate  from data of existing devices mostly operated with hydrogen or deuterium plasmas to future tokamak fusion reactors, which most probably will operate in H-mode with a D-T fuel mixture. Existing approaches for extrapolations or predictions sometimes employ the effective isotope mass,
  , in scaling laws [19] or for fluid simulations in order take into account isotope effects of
  . As we demonstrated with our data set of
  , the approach to rely only on
  for factoring in isotope effects will fail to accurately predict
  , especially when isotope mixtures like H-T and D-T are compared with their pure or mixed counterparts with the same effective isotope mass. Our data suggests that
  is not only insufficient to describe the isotope effect of
  consistently, but it also fails to correctly describe the isotope effect of transport, since different isotope compositions with the same
  showed different
  .
.
Based on our findings, we conclude that for a quantitative prediction of  it is necessary to (i) understand why the L-H transition is associated with critical temperature profiles, which are very similar for a large variation of densities and isotope masses, (ii) investigate whether and how the critical temperature profiles vary with magnetic field, plasma current, plasma shape and other parameters, and (iii) quantitatively predict the L-mode transport under these conditions.
Edge turbulence codes might be best suited to provide this information, since they deliver the relevant anomalous transport levels at the edge, and intrinsically contain the physics of the turbulence suppression, which correlates with the confinement improvement at the L-H transition [39]. Recent developments of turbulence codes like XGC [40], GRILLIX [41] and GENE-X [42] raise hope, that a comprehensive understanding of the isotope effect of the L-H transition might be available in the near future. They self-consistently provide the density and temperature profiles at the edge including the radial electric field profile due to their global nature, are able to cope with the complex edge geometry including the X-point and open field lines in the SOL, and include neoclassical effects.
For plasmas of mixed isotopes, the interplay of the different ion species must be taken into account by representing them in separate isotope fluids (instead of just considering a single ion fluid with an effective isotope mass  ), which might increase the demand for computational power of turbulence simulations, but seems to be essential for correct predictions of the edge transport and, thus, the L-H power threshold. A simulation code being able to reliably provide realistic transport levels at the edge for different isotope composition would not only advance the understanding of L-H transition physics, but would likewise be of great value for the understanding of the isotope effect of transport and, hence, the prediction of burning fusion plasmas in tokamaks.
Acknowledgments
This work has been carried out within the framework of the EUROfusion Consortium, funded by the European Union via the Euratom Research and Training Programme (Grant Agreement No. 101052200—EUROfusion). Views and opinions expressed are however those of the author(s) only and do not necessarily reflect those of the European Union or the European Commission. Neither the European Union nor the European Commission can be held responsible for them. G Birkenmeier received funding from the Helmholtz Association under Grant No. VH-NG-1350
Data availability statement
The data cannot be made publicly available upon publication due to legal restrictions preventing unrestricted public distribution. The data that support the findings of this study are available upon reasonable request from the authors.
Footnotes
- 17
ASDEX Upgrade and JET, the two of the largest tokamaks contributing to the multi-machine data base, provided only data of plasmas operated in a carbon wall at the time when the scaling was derived, although both devices are equipped with a metallic wall in the meantime.