

Abstract
Sustained operation of high-performance, ITER-baseline scenario plasmas at the high levels of input power ( ) required to achieve ∼15 MW of D-T fusion power in JET-ILW requires careful optimisation of the fuelling to avoid an unacceptable disruption rate due to excessive radiation, primarily from W impurities, which are sputtered by edge-localised modes (ELMs) from the divertor targets. By using a train of ELM-pacing pellets from a high-frequency pellet injector to promote regular ELMs, which flush W and other impurities from the confined plasma, such high-performance plasmas can be sustained (for ∼5 s) while maintaining a high normalised confinement factor H98,y2 ∼ 1, which would otherwise be degraded by reducing the pedestal confinement if a higher rate of D2 gas fuelling were used instead of the pellets to mitigate the W contamination. The causes underlying the improved performance and energy confinement obtained using this combined, gas and pellet fuelling scheme is investigated here in some detail.
Export citation and abstract BibTeX RIS

Original content from this work may be used under the terms of the Creative Commons Attribution 4.0 license. Any further distribution of this work must maintain attribution to the author(s) and the title of the work, journal citation and DOI.
1. Introduction
High-performance plasma scenarios are being prepared for the achievement of high levels of fusion power  sustained for ∼5 s in a future D-T campaign on JET-ILW. Two different ELMy H-mode scenarios are under preparation: the ITER-baseline scenario operating at βN
∼ 1.8–2 and low edge safety factor q95 ∼ 3 and the hybrid scenario with βN
∼ 2–3 and high q95 ∼ 4 [1]. High input powers of
sustained for ∼5 s in a future D-T campaign on JET-ILW. Two different ELMy H-mode scenarios are under preparation: the ITER-baseline scenario operating at βN
∼ 1.8–2 and low edge safety factor q95 ∼ 3 and the hybrid scenario with βN
∼ 2–3 and high q95 ∼ 4 [1]. High input powers of  , primarily from neutral beam injection (NBI) heating are required to achieve such a level of fusion power. Hence, one of the key-performance indicators (KPI) for the current C38 experimental campaign is to achieve a D-D neutron rate
  (equivalent to PDT
∼ 15 MW) sustained for 5 s in either scenario.
(equivalent to PDT
∼ 15 MW) sustained for 5 s in either scenario.
Early experience with high-Z (Mo or W) target materials, e.g. low-density experiments on the PLT tokamak with Mo limiters, showed that core accumulation of only small concentrations ( ) of such impurities could cause radiative collapse of the plasma [2]. It was later realized that tritium retention by co-deposition onto graphite plasma-facing components (PFCs) would pose an unacceptable hazard in ITER or a reactor, so the use of high-Z PFCs was again revisited, with trials of W as a target material in ASDEX-U [3], leading later to successful demonstration of high-density divertor operation of H-mode plasmas with a full metal wall.
At the ∼40 MW power levels required to demonstrate this KPI in JET-ILW with the all-metal (Be and W) wall, a high fraction of the input power  is typically radiated, primarily by W impurities in the confined plasma, which are sputtered from the divertor targets by ELMs. Due to the very high emissivity of partially ionized W impurities at electron temperatures in the range 1–10 keV, which is
  that of any of the other elements in typical plasma facing materials [4], only tiny concentrations of W
  are able to radiate this level of power.
Hence, it is essential to take mitigating measures to avoid excessive W impurity erosion from the targets and to prevent accumulation of the W and other high-Z impurities (Ni, Cu and Fe) into the plasma core, where it can result in hollowing of the electron temperature Te profile and radiation induced disruption of the plasma due to the triggering of tearing modes [5]. Possible mitigation measures, aimed at reducing the W impurity influx by reducing the temperature at the targets, include: sweeping of the strike-point location; increasing the gas fuelling rate and seeding with a low-Z impurity gas, e.g. Ne or N2. Ion-cyclotron-resonance heating (ICRH) is also used to heat the core plasma to mitigate high-Z impurity accumulation [6].
In the baseline scenarios discussed here [1], the strike point location on the outer target is swept radially by ΔR ∼ 3 cm at 4 Hz, which is sufficient to prevent excessive local heating of the W coated, graphite tile (T6) and hence avoid melting and vaporisation of the W coating of the carbon-fibre-reinforced graphite (CFC) tiles.
A relatively high level of D2 gas puffing into the main chamber (ΓD2 ∼ 2– ) increases the ELM frequency to typically fELM
∼ 20–50 Hz and hence the rate of W flushing from the confined plasma. Also, the higher particle flux along the scrape-off layer (SOL) increases D0 recycling in the divertor, reducing Ti
at the target and thereby the inter-ELM sputtered W influx.
) increases the ELM frequency to typically fELM
∼ 20–50 Hz and hence the rate of W flushing from the confined plasma. Also, the higher particle flux along the scrape-off layer (SOL) increases D0 recycling in the divertor, reducing Ti
at the target and thereby the inter-ELM sputtered W influx.
A deleterious effect of using a higher D2 puffing rate is to reduce the pedestal temperature [7] by increasing the conducted power across the pedestal between the ELMs [8, 9], which reduces the pedestal pressure [10] and thereby the overall confinement. Increasing the fuelling rate increases the density at the separatrix ne,sep
relative to that at the pedestal top ne,ped
[11]. This flattens the ne
gradient across the pedestal, thereby increasing the parameter  (where e.g.
  and
and  ), which provides the drive for turbulent heat transport [12–14]. Also, if the pedestal heat transport is 'stiff', i.e. clamped at a threshold ηe
required to destabilise turbulent transport, a consequence is that an increased ratio of separatrix to pedestal density
), which provides the drive for turbulent heat transport [12–14]. Also, if the pedestal heat transport is 'stiff', i.e. clamped at a threshold ηe
required to destabilise turbulent transport, a consequence is that an increased ratio of separatrix to pedestal density  would also result in a lower temperature Te,ped
at the pedestal top [8].
would also result in a lower temperature Te,ped
at the pedestal top [8].
ICRH also has to be used in high-power H-mode JET-ILW discharges, both to avoid core impurity accumulation, particularly during the plasma termination, and to promote an early L/H transition [6, 15]. By using distributed main-chamber fuelling to optimize antenna-plasma coupling, an RF power PRF ∼ 4–6 MW can be routinely coupled into the plasma, minimizing the RF-induced plasma-wall interactions due to sheath-rectification effects.
Central ICRH power deposition and low concentrations of the H+ minority ions give the best results for core electron heating, achieving absorption efficiencies up to ∼90%. In these conditions, peaked temperature profiles, together with relatively flat density profiles, allow efficient high-Z impurity screening to be achieved with  .
.
In spite of these mitigation measures, excessive W radiation can still hamper the achievement of steady, ELMy H-mode operation at high power. Unstable plasma conditions caused by runaway radiation 'events', result in an unacceptably high rate of disruptions, which are particularly dangerous to the device at the high plasma currents (Ip ∼ 3–4.5 MA) typical of the ITER-baseline scenario pulses.
The role of W radiation cooling in the termination of ITER-baseline pulses in JET-ILW has been investigated statistically [5]. Depending on whether the W radiates from the plasma core or periphery, the resulting broadening or shrinking of the current profile, increases the probability of destabilising 2/1 tearing modes, which can induce disruptions. This analysis is used to develop disruption alerts based on Te -profile shape parameters. Here, we investigate the underlying mechanism of these processes in terms of the behaviour of the W impurities.
The W content of the plasma, and hence the level of radiation, is governed by a balance between the ingress of W impurities from the SOL by inward neo-classical convection across the pedestal and their removal aka 'flushing' from the plasma by ELMs. Too high a fraction of W radiation can dominate the plasma power balance, reducing the ELM frequency, allowing a further increase of the W content. This 'vicious circle' can either trigger an H/L-transition and subsequent W accumulation or cause radiative cooling and MHD-induced collapse from the plasma edge.
Fortuitously, the relatively high plasma current Ip ∼ 3–4.5 MA of baseline-scenario pulses compared to that of hybrid pulses ∼2.2–2.3 MA results in a high pedestal density ne,ped and, consequently, a rather flat core density profile, which favours outward neo-classical impurity convection aka 'screening', localising the impurities to the peripheral 'mantle' region of the plasma, which corresponds approximately to the outer third of the plasma radius, inside the pedestal top (see figure 2 and associated discussion for the definition of these regions). This screening is not so effective in hybrid scenario pulses, which typically have more peaked density profile.
In hybrid pulses, accumulation of high-Z impurities, triggered by low-n neo-classical tearing modes (NTMs) [16], which are destabilised by the higher poloidal-β, βp
∼ 1.0 of these plasmas compared to that of baseline pulses (βp
∼ 0.6), has hampered sustained, high-performance operation. By optimising the gas fuelling during the initial current ramp phase, it has recently been demonstrated that, with sufficient heating power, it is possible to achieve a hot, low collisionality pedestal, resulting in sufficiently strong  at the pedestal to screen out the W from the confined plasma, thereby effectively mitigating this problem [17].
Such unstable, radiative conditions can be avoided by triggering regular ELMs by the injection of a train of small, cryogenic D2 'ELM-pacing' pellets, thereby maintaining the rate of W flushing from the confined plasma. For this purpose, a high-frequency pellet injector is available on JET-ILW for injection of both ELM-pacing and fuelling pellets [18, 19]. The small ( ) pacing pellets can be injected at frequencies fPel
∼ 10–45 Hz from a flight line located at the upper high-field side (HFS) of the main vessel.
) pacing pellets can be injected at frequencies fPel
∼ 10–45 Hz from a flight line located at the upper high-field side (HFS) of the main vessel.
Partially replacing some of the gas fuelling by injection of such ELM-pacing pellets, typically resulting in a lower total fuelling rate, is found both to extend the duration of the ELMy H-mode phase and to enhance the overall confinement compared to that achieved with gas fuelling alone [1]. Here, we investigate the underlying causes of both the improved confinement and extended duration of the high-performance phase of high-power, baseline-scenario pulses obtained using a combination of D2 gas fuelling and ELM-pacing pellets.
In order to illustrate the effect of the level of gas fuelling on the performance of high-power, ITER-baseline scenario, H-mode pulses in JET-ILW, in section 2, we compare the evolution of three similar 3.5 MA pulses with injected heating power Pin
∼ 29–33 MW, two with low and high rates of gas fuelling (ΓD2 ∼ 1.5 and  ) and a third with ELM pacing pellets (at a requested repetition frequency of fPel
∼ 45 Hz) with a total fuelling rate from gas puffing and pellets matching that of the pulse with the higher fuelling rate.
) and a third with ELM pacing pellets (at a requested repetition frequency of fPel
∼ 45 Hz) with a total fuelling rate from gas puffing and pellets matching that of the pulse with the higher fuelling rate.
In section 2.1, kinetic profiles are shown for two of the pulses discussed in section 2 to compare the core and pedestal confinement achieved with either gas-fuelling alone or pellet + gas fuelling. Detailed results on the ion and electron power balances and the momentum balance, which are obtained from an interpretive transport analysis using TRANSP, are presented in section 2.2 and the effect of the fuelling on the core heat and momentum transport is investigated in section 2.3.
In section 2.4, the effect of the ELM flushing on the W content and the evolution of the total radiation is investigated. Firstly, in section 2.5, the method used to quantify the W flushing by the ELMs, based on an analysis of fast bolometric measurements of the radiated power, is explained. Results from application of this analysis to a high-power, gas-fuelled 3 MA pulse #92 432, which also exhibits a core W accumulation 'event', are presented in section 2.6. In section 2.7 results of the ELM-flushing analysis from the pulses discussed in section 2 are then compared.
By classifying the ELMs as either 'pellet-triggered' or spontaneous, 'natural' events, we can investigate the influence of the ELM type on the their efficiency at flushing the W impurities. In section 2.8, a statistical analysis of the ELM flushing and inter-ELM ingress of W, is presented, classifying the data by ELM type.
As the ELM-sputtered, 'intra-ELM' W impurity source dominates that during the inter-ELM periods, in section 2.9 we compare relative intra-ELM Be and W impurity fluences ΦBe,W , i.e. the influxes integrated over the ELM duration, for the different ELM types. These are evaluated from visible Be II and W I line intensities from a multi-channel spectrometer viewing the divertor targets.
In order to determine whether any of the improvements in plasma performance caused by modification of the W behaviour is induced by the pellets, the effect of the pacing pellets on the inter-ELM evolution of the kinetic profiles (and associated gradient parameters) in the pedestal and mantle regions is investigated in section 2.10.
In the discussion section 3, a mechanism is proposed in section 3.1 for the interaction of fuelling, ELMs and W impurities in high-power, ITER-baseline pulses, which is then applied to understanding the radiation event in pulse #92 432 in section 3.2. The possible influence of fuelling on the retention of sputtered impurities in the divertor is discussed in section 3.3.
Finally in section 4, we present the main conclusions of this study and an outlook to future work.
2. Comparison of high-power, 3.5 MA pulses with different fuelling sources
To illustrate the importance of optimising the particle fuelling in achieving maximal energy confinement (and hence fusion yield) and pulse duration at high-performance, in this section, the evolution of three, 3.5 MA ITER-baseline (BL) scenario pulses with 29-33 MW of additional heating power are compared. Two of these, #94 915 and #94 980 have low and high rates of D2 gas fuelling during the sustained H-mode phase of ΓD2 ∼ 1.5 and  respectively from gas-inlet modules at octants #1, 6 and 8) in the main chamber. The other pulse #96 713 has both D2 gas fuelling at a low rate of
  and D2 ELM-pacing pellets. The key parameters of these three pulses are given in table 1 and a comparison of their evolution is shown in figure 1.

Figure 1. Comparison of evolution of 3.5 MA/3.3 T ITER-baseline scenario pulses with different fuelling sources #94 915 (red), #94 980 (black) and #96 713 (blue) with the key parameters given in table 1 showing: (a) total injected heating power Pin
and radiated power fraction  ; (b) fuelling rates ΓD2 (e s−1) from D2 gas ΓD2,gas
(dot-dashed), pacing pellets ΓD2,pel
(smoothed, τsm
= 0.25 s) (dashed) and total fuelling rate
; (b) fuelling rates ΓD2 (e s−1) from D2 gas ΓD2,gas
(dot-dashed), pacing pellets ΓD2,pel
(smoothed, τsm
= 0.25 s) (dashed) and total fuelling rate  (solid); (c) total MHD stored energy Wth
(solid) and H-mode confinement enhancement factor H98,y2 (dashed); (d) total D-D neutron rate Γn,DD
; (e)–(g) the ELM behaviour from a visible Be II line viewing the outer divertor target, where the smoothed (τsm
= 0.25 s), intra-ELM integrated signal
(solid); (c) total MHD stored energy Wth
(solid) and H-mode confinement enhancement factor H98,y2 (dashed); (d) total D-D neutron rate Γn,DD
; (e)–(g) the ELM behaviour from a visible Be II line viewing the outer divertor target, where the smoothed (τsm
= 0.25 s), intra-ELM integrated signal  is also shown (cyan, × 10) and the ELM peaks are marked by the vertical lines (natural ELMs (dashed/green) and pellet triggered ELMs (red/dot-dashed)).
Download figure:
Standard image High-resolution image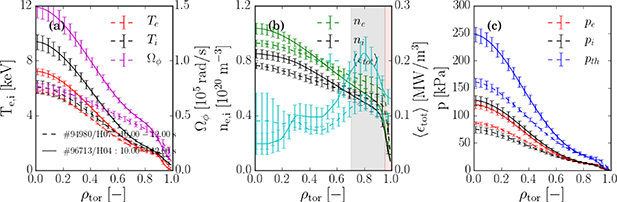
Figure 2. Comparison of fitted, time-averaged kinetic profiles for two of the three pulses shown in figure 1 #94 980 (high gas fuelling rate) and #96 713 (pellet and gas fuelling, with total rate matched to that for #94 980) showing radial profiles vs ρtor
of: (a) ion and electron temperatures Ti,e
and toroidal rotation  rates; (b) ion and electron densities ni,e
and flux-surface averaged total emissivity
rates; (b) ion and electron densities ni,e
and flux-surface averaged total emissivity  ; (c) ion, electron pi,e
and total thermal pth
pressures. The radial coordinate
; (c) ion, electron pi,e
and total thermal pth
pressures. The radial coordinate  , where ΦN
is the normalised toroidal magnetic flux. The radial extents of the mantle and pedestal regions are indicated by the shaded bars in (b).
, where ΦN
is the normalised toroidal magnetic flux. The radial extents of the mantle and pedestal regions are indicated by the shaded bars in (b).
Download figure:
Standard image High-resolution imageTable 1. Parameters of analysed 3.5 MA/3.3 T ITER-baseline scenario pulses, showing: total heating power Pin ; fuelling rates ΓD2 from gas puffing, pacing pellets and total; the requested ELM-pacing pellet frequency fPel ; peak plasma stored energy Wpl,max ; peak D-D neutron rate Γn,DD ; duration of 80% peak-performance, ELMy H-mode phase ΔtHP ; and the concentrations Cmin of H and 3He minority ions for the ICRH.
| Pulse | Pin |
| fPel | Wth,max | Γn,DD | ΔtHP | Cmin | |||
|---|---|---|---|---|---|---|---|---|---|---|
| # | (MW) | Gas | Pellet | Total | (Hz) | (MJ) |

| (s) | H (%) | 3He (%) |
| 94 915 | 28 | 1.5 | — | 1.5 | — | 8.8 | 2.2 | ∼1 | ∼1.5 | — |
| 94 980 | 29 | 2.3 | — | 2.3 | — | 7.5 | 1.2 | ∼3 | ∼1 | ∼2.5 |
| 96 713 | 33 | 1.0 | 1.3 | 2.3 | 45−35 | 10.5 | 3.5 | ∼3 | ∼3 | — |
The D2 pellets used for triggering, aka 'pacing' ELMs on JET-ILW have dimensions  and length ∼2 mm with an average particle content
  , measured by the last microwave cavity along the flight tube. At the requested pellet rate of fPel
∼ 45 Hz for pulse #96 713, this results in a time-averaged fuelling rate into the vessel of
, measured by the last microwave cavity along the flight tube. At the requested pellet rate of fPel
∼ 45 Hz for pulse #96 713, this results in a time-averaged fuelling rate into the vessel of  . As shown in figure 1(b), the resulting total, time-averaged fuelling rate from the gas and pellets
  almost matches that in pulse #94 980 with the higher rate of gas fuelling alone.
Although the thermal stored energy Wth
is somewhat higher (∼15%) in pulse #94 915 than in pulse #94 980 with the higher fuelling rate, i.e. ∼8.8 MJ cf ∼7.5 MJ, as shown in figure 1(e) pulse #94 915 is non-stationary, exhibiting complex ELM behaviour, with some large, type-I ELMs, each followed by a period of small ELMs and then a long ELM-free phase of duration ∼0.2 s. During the final ELM-free, H*-phase, the radiated power fraction  (see figure 1(a)) increases to
  of the input power, at which point this triggers a controlled termination of the pulse, which commences with a strong increase of the gas puffing rate (not shown).
Stronger gas puffing into the main chamber is required to achieve steady operation, e.g. as in pulse #94 980, resulting in more frequent, smaller amplitude, type-I ELMs, some of which are followed rapid bursts of small, type-III ELMs and subsequent, shorter H*-phases, as shown in figure 1(f). A relative measure of the time-averaged (τsm
= 0.25 s) ELM-sputtered Be II influx  shown in the figure (cyan), indicates that the impurity source is, on-average, probably not very different to that in the non-stationary pulse #94 915. However, the more frequent ELMs manage to expel sufficient of the highly radiative W impurities to maintain
  (see figure 1(a)).
The achievement of sustained, ELMy H-mode operation at high-power with the stronger gas puffing does, however, come at the cost of reduced pedestal temperature and, consequently, lower overall energy confinement (see [8] and references therein.) The effect of the different fuelling on the pedestal parameters in these pulses is quantified in section 2.10 below. In terms of the normalised confinement, as shown in figure 1(c), the H-mode confinement enhancement factor H98,y2 12 is reduced by the stronger gas puffing to ∼0.8 cf ∼1.0 in pulse #94 915, while the input power in these two pulses is similar Pin ∼ 29 MW.
Note that, although the rates and method of fuelling are different, the achieved, line-average density  (corresponding to a Greenwald density fraction
  13
) is similar in these three pulses. The line-averaged, effective ion charge Zeff
∼ 1.6, inferred from a horizontal mid-plane, visible bremsstrahlung measurement, is also similar for the three pulses.
13
) is similar in these three pulses. The line-averaged, effective ion charge Zeff
∼ 1.6, inferred from a horizontal mid-plane, visible bremsstrahlung measurement, is also similar for the three pulses.
As shown in figure 1(d), the ∼50% reduction in the D-D neutron rate Γn,DD
caused by the increased gas puffing rate in pulse #94 980 is more severe than the reduction in thermal energy, the former being  c.f.
c.f.  in pulse #94 915. This is a consequence of the lower peak ion temperature Ti,0 ∼ 6 keV in pulse #94 980 compared to ∼8 keV in pulse #94 915 and the fact that the Maxwell-averaged rate coefficient
  increases strongly with temperature (approximately
  ) [20].
The injection of ELM-pacing pellets to trigger ELMs in conditions which would otherwise result in long H*-phases (and potentially a high disruptivity) offers a means of extending the duration of the high-performance, ELMy H-mode phase, whilst maintaining the high pedestal temperature and overall confinement that is achieved at lower gas fuelling rates. In the pulse #96 713 the gas fuelling rate of  is lower than that in pulse #94 915 but the total fuelling rate, including that from the 45 Hz pellets is close to that from the gas puffing alone in #94 980.
As shown in figure 1(g), this combined fuelling scheme results in higher frequency, lower amplitude ELMs, even than those in the pulse #94 980 with the higher fuelling rate. Although most but not all pellets trigger ELMs, the overall ELM frequency does not lock to the pellet frequency. Instead, there are typically bursts of small amplitude, high-frequency ELMs that follow the pellet triggered ELMs, resulting in a higher average ELM frequency than that of the pellets.
As a result of the small ELM amplitude, the time-averaged, relative ELM-sputtered Be II influx  is lower than in either of the other two pulses with the gas fuelling alone. In spite of this, the radiated power fraction
  is higher than in the high-gas pulse #94 980, lying just below that required to trigger an early pulse termination by the safety interlock. Note that the duration of the pulse with gas and pellets #96 715 is not limited by a high radiation fraction or W accumulation but intentionally by the control system, which was programmed to commence pulse termination by strongly increasing the gas puffing rate at 52 s.
The pulse #96 713, with gas and pellet fuelling, has a higher input power of 33 MW, i.e. ∼×1.15 more than the ∼29 MW in the pulses with gas puffing alone. The resulting stored energy  is relatively higher than in the two gas-fuelled pulses with low and high puffing rates, in which Wth
∼ 8.8 MW and ∼7.5 MW respectively. The confinement enhancement factor H98,y2, which offers a means of comparing the quality of confinement taking into account the difference in heating power, is restored to the same level in the pulse #96 713 with gas and pellets to that in the low-gas pulse #94 915, i.e.
is relatively higher than in the two gas-fuelled pulses with low and high puffing rates, in which Wth
∼ 8.8 MW and ∼7.5 MW respectively. The confinement enhancement factor H98,y2, which offers a means of comparing the quality of confinement taking into account the difference in heating power, is restored to the same level in the pulse #96 713 with gas and pellets to that in the low-gas pulse #94 915, i.e.  .
.
Remarkably, at the same stage of the pulse, the D-D neutron rate is considerably higher (∼×1.5) in pulse #96 713 with the pellets and gas than in the low-gas pulse #94 980, i.e. by a much larger factor than that of the extra heating power. In the next section section 2.1, we show that this can be attributed to a higher axial ion temperature Ti,0, which may result from increased rotational shear across the core plasma due to an overall higher toroidal rotation rate  . The enhanced rotation in pulse #96 713 may in part arise from the ∼×1.1 higher rotation at the pedestal top
  (see table 2 and figure 11(f) below).
Table 2. Average pedestal parameters over the high-performance, ELMy H-mode phase of the same three pulses (#94 915, #94 980 and #96 713) for which key parameters are stated in table 1 over the period  . Further details of how these parameters are determined are given in section 2.10. Note that the value of
  is that of
  at the top of the ne
pedestal, while the density ratio
at the top of the ne
pedestal, while the density ratio  is determined by assuming a fixed value of Te
∼ 100 eV at the separatrix.
is determined by assuming a fixed value of Te
∼ 100 eV at the separatrix.
| Pulse |

|

|

|

|

|

|
|---|---|---|---|---|---|---|
| # | (s) | (keV) | ( ) ) | (keV) | (×105 r s−1) | (−) |
| 94 915 | 8.5–10.0 | 0.78 ± 0.02 | 0.52 ± 0.02 | 1.17 ± 0.03 | 23.1 ± 0.8 | 0.18 ± 0.03 |
| 94 980 | 10.0–12.0 | 0.81 ± 0.01 | 0.59 ± 0.01 | 1.07 ± 0.02 | 21.9 ± 0.5 | 0.23 ± 0.01 |
| 96 713 | 10.0–12.0 | 0.76 ± 0.03 | 0.48 ± 0.01 | 1.00 ± 0.02 | 24.3 ± 0.6 | 0.20 ± 0.01 |
The higher core Ti
increases the D-D neutron rate coefficients  for both thermal and beam-target D-D fusion reactions, the latter causing the beam-target neutron rate to increase more strongly than linearly with the NBI heating power. Typically, in such high-power, 3.5 MA baseline-scenario pulses in JET-ILW, beam-target reactions contribute ∼30%–40% of the total D-D neutron rate.
It is conjectured that the increase in  at the plasma periphery may be due to reduced charge-exchange (CX) friction with neutral D0 atoms due to the lower rate of main-chamber gas puffing used in #96 713. As the pellets provide ∼50% of the fuelling and are injected at the HFS, while the main-chamber gas puffing at the low-field side (LFS) is reduced, a lower D0 density at the LFS would result in less frictional drag on the plasma [22].
2.1. Comparison of energy confinement in pulses #94 980 and #96 713
A beneficial effect of operating at a reduced gas fuelling rate with the ELM pacing pellets is an enhancement of the core energy confinement, which is associated with increased toroidal rotation and reduced ion temperature gradient stiffness [23]. A comparison of kinetic profiles averaged over a 2 s period of the ELMy H-mode phase of the 3.5 MA ITER-baseline pulses #94 980 with only gas fuelling and pulse #96 713 with pellets + gas fuelling is shown in figure 2. As stated previously in section 2, these pulses have similar total fuelling rates of  , however, the pulse #96 713 has only ∼43% of the gas fuelling rate ΓD2,gas
of #94 980.
, however, the pulse #96 713 has only ∼43% of the gas fuelling rate ΓD2,gas
of #94 980.
These profiles are from an interpretive transport analysis using the TRANSP code [24] based on input kinetic profiles which are mapped onto the radial coordinate  , where ΦN
is the normalised toroidal flux using a pressure-constrained, magnetic equilibrium obtained from the EFIT++ equilibrium reconstruction code [25, 26]. More details of the TRANSP run, including the origin of the input data and the assumptions made are given in section 2.2.
, where ΦN
is the normalised toroidal flux using a pressure-constrained, magnetic equilibrium obtained from the EFIT++ equilibrium reconstruction code [25, 26]. More details of the TRANSP run, including the origin of the input data and the assumptions made are given in section 2.2.
It can be seen from figure 2(a), that across the core plasma, both the ion temperature Ti
and the toroidal rotation rate  are higher in the pellet + gas-fuelled pulse #96 713 than in the gas fuelled pulse #94 980, on-axis by factors of ∼1.5 and ∼2 respectively. However, at the pedestal top, these parameters are approximately equal. It should be noted that the additional heating power Pin
is ∼×1.13 higher in #96 713 than in pulse #94 980.
are higher in the pellet + gas-fuelled pulse #96 713 than in the gas fuelled pulse #94 980, on-axis by factors of ∼1.5 and ∼2 respectively. However, at the pedestal top, these parameters are approximately equal. It should be noted that the additional heating power Pin
is ∼×1.13 higher in #96 713 than in pulse #94 980.
Average values of pedestal parameters over the high-performance, ELMy H-mode phase for the same 3.5 MA pulses as in table 1 are stated in table 2. Note that, in spite of the ∼×2 higher fuelling rate in pulse #94 980 as in pulse #96 713, the pedestal temperatures for the two pulses are quite similar. However, there are significant differences in the edge rotation and density, with lower  by ∼×0.8 and lower relative separatrix density
  by ∼×0.9 but higher
  by ∼×1.1 in #96 713 with the pellet + gas fuelling compared to those in #94 980.
Density profiles of the electrons and D+ ions are shown in figure 2(b). Although ne,ped
is ∼×1.1 higher in the gas-fuelled pulse #94 980 than in the pellet + gas fuelled pulse #96 713, the line-averaged density  is the same in both pulses, so the density profile is somewhat more peaked in the pellet + gas fuelled pulse #96 713, with
  compared to ∼1.35 in #94 980. The effect of the lower pedestal density with the pellet + gas fuelling on the power and momentum deposition from the neutral-beam-injection (NBI) heating is discussed in detail in section 2.2. As a lower ne,ped
increases the beam penetration, this will increase the beam particle source in the core, thereby enhancing the density peaking.
compared to ∼1.35 in #94 980. The effect of the lower pedestal density with the pellet + gas fuelling on the power and momentum deposition from the neutral-beam-injection (NBI) heating is discussed in detail in section 2.2. As a lower ne,ped
increases the beam penetration, this will increase the beam particle source in the core, thereby enhancing the density peaking.
Also shown in figure 2(b) are profiles of the flux-surface averaged total emissivity  from tomographic reconstructions [27] of multi-chord, bolometric measurements of the total radiation [28]. In the peripheral, 'mantle' region (defined here as
  ), we see that
  is
is  higher in the pellet + gas fuelled pulse #96 713 than in the gas-only fuelled pulse #94 980, which is consistent with the higher concentration of W in the mantle (see figure 11(a)), which is the dominant radiator in such high-power H-mode pulses in JET-ILW. The effect of this strong mantle radiation on the ion and electron power balances is also discussed in section 2.2.1 (see also section 4 of [8]).
Finally, we see from figure 2(c), that on-axis, the total thermal pressure pth
is ∼×1.5 higher in pulse #96 713 than in pulse #94 980, primarily due to the higher ion temperature Ti,0, which is ∼×1.5 higher in #96 713, while Te,0 is only ∼×1.23 higher than in pulse #94 980. The average volume-integrated, total stored energies  and those of the ions and electrons
  and
and  , obtained from the TRANSP runs for these pulses are stated in table 3, together with the corresponding, averaged pedestal stored energies.
Table 3. Thermal stored energies (total and of either ions or electrons) of the whole plasma and that due to the pressures at the pedestal top, averaged over the period  s during the high-performance, ELMy H-mode phase of the two pulses (#94 980 and #96 713) for which key parameters are stated in table 1. Also stated are the time-averaged ratios of total ion to electron heating power
  and thermal energies of the ions and electrons
  .
.
| Pulse |

|

|

|

|

|

|

|

|
|---|---|---|---|---|---|---|---|---|
| # | (MJ) | (MJ) | (MJ) | (MJ) | (MJ) | (MJ) | (—) | (—) |
| 94 980 | 6.53 ± 0.02 | 3.18 ± 0.01 | 3.35 ± 0.01 | 2.00 ± 0.04 | 0.88 ± 0.02 | 1.12 ± 0.03 | 1.18 ± 0.06 | 1.05 ± 0.01 |
| 96 713 | 8.54 ± 0.05 | 3.71 ± 0.02 | 4.84 ± 0.03 | 1.52 ± 0.03 | 0.64 ± 0.02 | 0.88 ± 0.02 | 1.33 ± 0.07 | 1.31 ± 0.01 |
From these stored energies in table 3, we see that on-average, the pedestal energy  is ∼×1.3 higher in the gas fuelled pulse #94 980 than in the pellet + gas fuelled pulse #96 713, primarily due to the higher ne,ped
in the former. However, the total stored energy
is ∼×1.3 higher in the gas fuelled pulse #94 980 than in the pellet + gas fuelled pulse #96 713, primarily due to the higher ne,ped
in the former. However, the total stored energy  is ∼×1.3 higher in pulse #96 713, which has ∼×1.13 higher input power than pulse #94 980. Comparing the ratios of the components of the total thermal energy stored in the ions to that in the electrons, we see that
  is higher in pulse #96 713 compared to ∼1.05 in #94 980.
This relative increase in ion energy confinement cannot be explained solely by an increase in the average ratio of ion to electron heating  , which is higher in pulse #96 713 compared to that in pulse #94 980 by a factor ∼1.12. Hence, there is also a relative improvement of the ion energy confinement with the pellet + gas fuelling compared to that with gas fuelling alone. The reason for this is discussed in more detail in section section 2.3, in which the effect of the changes to the fuelling between pulses #94 980 and #96 713 on the ion and electron heat transport and the transport of toroidal angular momentum
  across the core plasma is investigated.
2.2. Power and momentum balance analysis of #94 980 and #96 713
In this section, results on the power balances of the ions and electrons and the balance of toroidal angular momentum for the two 3.5 MA pulses: #94 980 with the high rate of gas fuelling alone and #96 713 with a similar total fuelling rate from gas and ELM pacing pellets, are presented and compared.
The primary input data for the transport analysis are the kinetic profiles (Te
, ne
, Ti
and  ), which are obtained by fitting the raw data from the high-resolution Thomson scattering system (HRTS) [29] and the core and edge CXRS systems [30, 31]. The fits use an
  function to represent the profiles over the pedestal region (
 ) [32] and a third-order polynomial for the core region. Examples of the raw profiles at 11 s are shown in figures 3(a) and 4(a). As the Ti
and
) [32] and a third-order polynomial for the core region. Examples of the raw profiles at 11 s are shown in figures 3(a) and 4(a). As the Ti
and  data from the edge CXRS system on JET-ILW is considered more reliable than that from the core system, the outer two points of the core CXRS (not shown) are excluded from the fit.
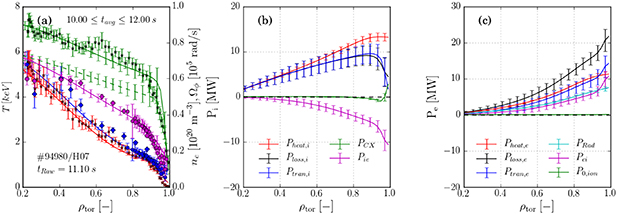
Figure 3. Results of interpretive, power balance analysis using TRANSP of pulse #94 980 showing: (a) fitted kinetic profiles Te
(red), ne
(green, solid) and ni
(green, dashed) from HRTS, Ti
(blue) and  (magenta) from the core and edge CXRS systems; radially integrated powers of components of the power balances of the ions (b) and the electrons (c), where the profiles are averaged over the time period
  and the error bars represent the standard deviations of the data σdata
. A 'snapshot' of the raw measurement data is shown at tRaw
= 11.1 s.
and the error bars represent the standard deviations of the data σdata
. A 'snapshot' of the raw measurement data is shown at tRaw
= 11.1 s.
Download figure:
Standard image High-resolution imagePressure constrained EFIT++ equilibrium reconstructions [26] are used to map the measurement data from major radius to the normalised flux coordinate, i.e.  . Using these equilibria for the profile mapping, meaningful results can be obtained in the pedestal region with no additional constraint required to ensure a reasonable value for Te,sep
, which is typically ∼100 eV (see [33]).
. Using these equilibria for the profile mapping, meaningful results can be obtained in the pedestal region with no additional constraint required to ensure a reasonable value for Te,sep
, which is typically ∼100 eV (see [33]).
For these interpretive transport calculations, time-dependent, radial profiles of flux-surface averaged densities of Be, Ni and W impurities are input to TRANSP, which are obtained from an integrated analysis described in [34], as for similar analysis presented in a previous study [8]. This analysis self-consistently fits bolometric measurements of the total emissivity, multi-channel soft x-ray measurements and a horizontal, visible bremsstrahlung measurement of the line-average Zeff , taking account of the poloidal redistribution of the impurity ions over the flux surfaces by centrifugal forces due to the toroidal rotation.
These calculations, which assume a radially constant concentration of Be impurities, yield the volume averaged quantities for the principle Be, Ni and W impurities, summarised in table 4.
Table 4. Time-averaged quantities over 10–12 s from the integrated analysis of impurity radiation described in [34] for the two pulses for which interpretive TRANSP analysis has been performed here, stating volume-averages  of: total Zeff
and Be, Ni and W impurity concentrations CZ
, with their incremental contributions ΔZeff
to Zeff
and their fractional contributions
of: total Zeff
and Be, Ni and W impurity concentrations CZ
, with their incremental contributions ΔZeff
to Zeff
and their fractional contributions  to the total radiated power. The H and 3He minority ion concentrations Cmin
assumed for the TORIC calculations of the ICRH power deposition are also stated.
to the total radiated power. The H and 3He minority ion concentrations Cmin
assumed for the TORIC calculations of the ICRH power deposition are also stated.
| Pulse |

|

|

|

| Cmin (%) | |||||||
|---|---|---|---|---|---|---|---|---|---|---|---|---|
| # | — | Be | Ni | W | Be | Ni | W | Be | Ni | W | H | 3He |
| 94 980 | 1.6 ± 0.03 | 3.8 | 0.02 | 0.005 | 0.61 | 0.11 | 0.05 | 3.6 | 17.3 | 75.5 | 1 | 2.5 |
| 96 713 | 1.6 ± 0.03 | 2.1 | 0.04 | 0.01 | 0.35 | 0.23 | 0.12 | 1.52 | 12.9 | 82.5 | 3 | — |
For both pulses the volume-averaged  . Pulse #94 980 has twice the concentration of Be (CBe
∼ 4%) than pulse #96 713 (∼2%). Conversely, the volume-averaged concentrations of the heavy impurities Ni and W, which are
. Pulse #94 980 has twice the concentration of Be (CBe
∼ 4%) than pulse #96 713 (∼2%). Conversely, the volume-averaged concentrations of the heavy impurities Ni and W, which are  are twice as high in pulse #96 713 than in pulse #94 980 and in both pulses the concentration of Ni is ∼×4 that of W. In spite of this, the W radiates
  and the Ni
  of the total radiated power in both pulses. Although the Be radiates only a few % of the power, this species makes the largest contribution to Zeff
.
of the total radiated power in both pulses. Although the Be radiates only a few % of the power, this species makes the largest contribution to Zeff
.
Power deposition profiles from the NBI and ICRH heating systems are calculated using the codes NUBEAM [35] and TORIC [36]. The ICRH heats the bulk plasma by means of the cyclotron resonance of the RF waves with a minority ion species. In pulse #96 713 there is a single H minority at a concentration of ∼3%, while for pulse #94 980 there are both H and 3He minority ions at average concentrations of ∼1% and ∼2.5% respectively. The presence of the heavier 3He minority species is to increase fraction of ICRH power heating to the D+ ions.
The neutral D0 influx at the plasma boundary, which determines the edge ionisation source, is determined from a horizontal, mid-plane  intensity measurement by assuming a ratio of ionisations/photon S/XB = 10. Note that the TRANSP runs, from which the results are reported here, do not account for the particle source from the ablation of the D0 pacing pellets, which are injected at the upper-HFS of the main vessel.
In the following discussion, we refer to volume integrated forms of the power and momentum balances, e.g. for the power balance, the corresponding power PX
is calculated from the power density QX
for quantity X as  to yield the associated power deposited within or leaving the
  flux surface.
We can define two further powers for the ions: the loss power due to ion heat transport  , where Pcond,i
and Pconv,i
are the conducted and convected powers, and the total loss power from the ions
, where Pcond,i
and Pconv,i
are the conducted and convected powers, and the total loss power from the ions  , where Pcx
is the CX loss power. Similarly for the electrons: the power due to electron heat transport
, where Pcx
is the CX loss power. Similarly for the electrons: the power due to electron heat transport  and the total loss power from the electrons is
  , where P0,ion
is the ionisation loss power and PRad
the radiated power. The total transport loss power through both channels is then
, where P0,ion
is the ionisation loss power and PRad
the radiated power. The total transport loss power through both channels is then  .
.
2.2.1. Results of power balance analysis.
Results from the interpretive, power balance analysis of the high-power 3.5 MA pulse #94 980 with the high gas fuelling rate ( ) are shown in figure 3. The derived profiles are shown averaged over the period 10–12 s of the ELMy H-mode phase, while the measured raw data in figure 3(a) is shown at 11.1 s.
Components of the radially-integrated ion and electron power balances are shown in figures 3(b) and (c). While Ti
only slightly exceeds Te
across the full plasma radius, collisional exchange transfers significant power from the ions to the electrons, i.e. integrated out the pedestal top Pie
∼ 6 MW, i.e. about ∼50% of the total ion heating Pheat,i
. Consequently, at the pedestal top, similar powers are conducted through the electron and ion channels, with  , in spite of the fact that at mid-radius the integrated power heating and conducted by the ions are twice those in the electron channel. Almost half of the total loss power through the electron channel Ploss,e
is radiated, i.e.
, in spite of the fact that at mid-radius the integrated power heating and conducted by the ions are twice those in the electron channel. Almost half of the total loss power through the electron channel Ploss,e
is radiated, i.e.  , predominantly by the strong W emission from the mantle region.
Note that on including the heavier 3He ion species in the TORIC calculations, significant ICRH power is deposited to the D+ ions, with a ratio of on-axis power densities in (MW m−3) of  , while (wrongly) assuming instead a single H (3%) minority species results in insignificant core ion heating).
Results from the interpretive, power balance analysis of the high-power 3.5 MA pulse #96 713 with the lower gas fuelling rate ( ) and the fPel
∼ 45 Hz ELM-pacing pellets, with a similar total fuelling rate as pulse #94 980 are shown in figure 4.
) and the fPel
∼ 45 Hz ELM-pacing pellets, with a similar total fuelling rate as pulse #94 980 are shown in figure 4.
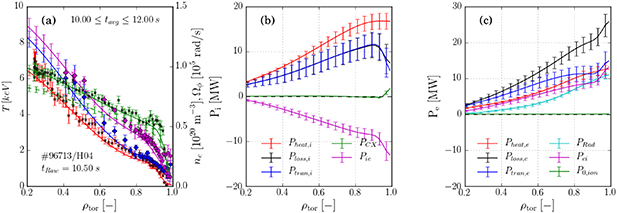
Figure 4. Results of interpretive, power balance analysis using TRANSP of pulse #96 713, where the profiles are averaged over the period  and a snapshot of the raw data is shown at tRaw
= 10.5 s. The definition of the quantities plotted are the same as in figure 3.
and a snapshot of the raw data is shown at tRaw
= 10.5 s. The definition of the quantities plotted are the same as in figure 3.
Download figure:
Standard image High-resolution imageThe most striking difference between the kinetic profiles for these two pulses is the much higher (∼×2) toroidal rotation rate of  in pulse #96 713, cf ∼70 krad s−1 in pulse #94 980. Also, there is a higher ratio of
  across the core plasma. Quoting values at the pedestal top, the exchange heating Pie
∼ 9 MW transfers ∼50% of the total ion heating Pheat,i
∼ 18 MW to the electrons. In fact, the exchange heating of the electrons Pei
almost equals that from the external electron heating Pheat,e
∼ 11 MW and equals the radiated power from the electrons PRad
.
across the core plasma. Quoting values at the pedestal top, the exchange heating Pie
∼ 9 MW transfers ∼50% of the total ion heating Pheat,i
∼ 18 MW to the electrons. In fact, the exchange heating of the electrons Pei
almost equals that from the external electron heating Pheat,e
∼ 11 MW and equals the radiated power from the electrons PRad
.
Hence, accounting for the ion-electron exchange power and radiation, the net transport loss power through the ion channel Ptran,i ∼ 12 MW is similar in magnitude to that transported through the electron channel Ptran,e ∼ 11 MW. The increased radiation in #96 713 ensures that about 50% of the total electron loss power Ploss,e ∼ 20 MW through the electron channel is lost by radiation (again quoting values at the pedestal top).
In both pulses, the profiles of power deposition density to the ions and electrons differ in that, whereas Qi,heat
peaks on-axis, Qe,heat
peaks in the mantle region. This is because the fraction of NBI power heating the ions ( ) increases with the ratio of Te
to the injection energy E0, with
) increases with the ratio of Te
to the injection energy E0, with  for
for  . Consequently, the ratio of heating power to the ions relative to that to the electrons
  is higher and also more peaked in #96 713 in which
  than in pulse #94 980, i.e.
  cf ∼1.18. In spite of the fact that this pulse has only H (1%) minority ions, more ICRH power is deposited into the D+ ions than into the electrons, with a ratio of on-axis power densities in (MW m−3) of
  .
.
The cause of the more peaked power deposition and greater fraction of ion heating in pulse #96 713 with the pellet+gas fuelling is partly the increased density peaking  , mentioned in section 2.1. This, together with the higher overall heating power ∼×1.15 in this pulse compared to that in pulse #94 980 results in higher rotational shear and a higher
  ratio. Because of the relatively higher radiated power in pulse #96 713, the ratio of ion to electron heat fluxes
  is close to unity at the pedestal top in both pulses. Transport in these two pulses are compared in section 2.3, revealing modest differences in the heat and momentum diffusivities and hence changes to the prevailing transport mechanisms induced by the difference in fuelling method.
2.2.2. Results of momentum balance analysis.
Results of the interpretive toroidal angular momentum balance analysis using TRANSP for the same two high-power, 3.5 MA pulses #94 980 and #96 713 are shown in figures 5 and 6. Torque densities τ (Nm m−3) are shown in (a), radially integrated torques T (Nm) in (b) and gyro-Bohm normalised momentum and ion heat diffusivities in (c).
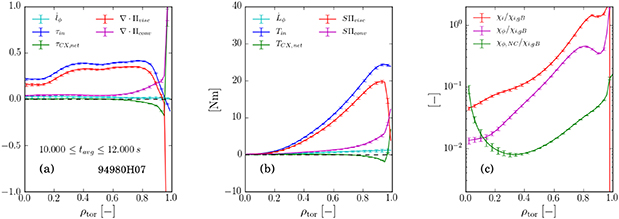
Figure 5. Results of interpretive, momentum balance analysis using TRANSP of pulse #94 980 showing: (a) input and net CX torque densities τin
and τCX,net
, rate of change of angular momentum  and divergences of viscous and convected momentum fluxes ∇·Πvisc
and ∇·Πconv
; (b) the quantities shown in (a) volume integrated out to radius ρtor
; (c) the ion thermal and momentum diffusivities, normalised to the ion-gyro-Bohm thermal diffusivity, i.e.
and divergences of viscous and convected momentum fluxes ∇·Πvisc
and ∇·Πconv
; (b) the quantities shown in (a) volume integrated out to radius ρtor
; (c) the ion thermal and momentum diffusivities, normalised to the ion-gyro-Bohm thermal diffusivity, i.e.  and
and  , where the TRANSP profiles are averaged over the sustained ELMy H-mode phase (
 ).
).
Download figure:
Standard image High-resolution image
Figure 6. Results of interpretive, momentum balance analysis using TRANSP of pulse #96 713, where the TRANSP profiles are averaged over the sustained ELMy H-mode phase (). The definition of the quantities plotted are the same as in figure 5.
Download figure:
Standard image High-resolution imageThe dominant source of input torque  –30 Nm is from the NBI heating. Note that because of the more peaked density profile in pulse #96 713, the torque density profile
  is somewhat more peaked than in pulse #94 980, which is partly responsible for the increased toroidal rotation rate. Note that in both pulses, the rate of change of angular momentum
  is small, i.e. there is a steady rate of toroidal rotation during the averaging period.
In the gas-fuelled pulse #94 980, in which  , the momentum and ion diffusivities are very similar, i.e. the Prandtl number
  except near the pedestal top. Except in the very core, both the ion thermal and momentum diffusivities are much larger than the ion-NC level, i.e.
  and
and  across the plasma.
As discussed further in section 2.3, in pulse #96 713 with the pellet + gas fuelling, the ion thermal diffusivity is slightly less than that for the electrons,  , both remaining
  . However, there is a more significant reduction in
  , with the Prandtl number below
  , particularly further into the core.
In the pedestal region, CX collisions with cold neutral D0 atoms results in a radially-integrated, frictional torque  , which opposes the torque imposed by the NBI. This torque
  is ∼×1.5 (and
  ) higher in the gas-fuelled pulse #94 980 than in the pellet + gas fuelled pulse #96 713, primarily because the D0 influx at the LFS is higher in the gas fuelled pulse.
The large CX torque density ( ) necessitates a large negative viscous momentum flux
  across the pedestal to achieve momentum balance. This implies the presence of a strong momentum 'pinch' that can arise from neo-classical effects [37] and/or be driven by turbulence [38]. While the presence of this momentum pinch is worthy of more detailed study, it is beyond the scope of this paper.
2.3. Comparison of core heat and momentum transport in pulses #94 980 and #96 713
The time-dependent, interpretive TRANSP analysis solves the balance equations for the transport of particles, ion and electron heat and toroidal momentum [24, 39]. The source of kinetic profiles (T, ne
, Ti
,  and
and  ) and other input data, the magnetic equilibrium used for mapping the profiles onto normalised radius ρtor
and other assumptions in setting up the runs, e.g. on the impurity densities, are described in detail in section 2.2.
) and other input data, the magnetic equilibrium used for mapping the profiles onto normalised radius ρtor
and other assumptions in setting up the runs, e.g. on the impurity densities, are described in detail in section 2.2.
A comparison of results from the solution of the power balances of the ions and electrons and of toroidal momentum are shown in figure 7 for the pulses #94 980 with gas-fuelling alone and #96 713 with pellet + gas fuelling, where the profile data is averaged over a 2 s period of the ELMy H-mode phase.
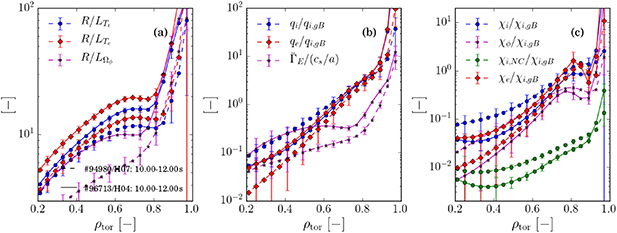
Figure 7. Results of interpretive, TRANSP power balance analyses of JET-ILW pulses #94 980 (dashed) and #96 713 (solid) showing time-averaged profiles over the ELMy H-mode phase of: (a) the normalised gradients  (
( ) and
) and  (
( ) and of torodial rotation
  (
( ); (b) the electron and ion heat fluxes
  (
( ) and
) and  (
( ) normalised to the ion gyro-Bohm level qi,gB
and the normalised E × B shearing rate
) normalised to the ion gyro-Bohm level qi,gB
and the normalised E × B shearing rate  (cs
is the sound speed) (
(cs
is the sound speed) ( ); and (c) thermal diffusivities of the electrons
  (
( ), ions
  (
( ) and the ion neo-classical diffusivity
  , all normalised to the ion-gyro-Bohm thermal diffusivity χi,gB
.
, all normalised to the ion-gyro-Bohm thermal diffusivity χi,gB
.
Download figure:
Standard image High-resolution imageIt can be seen from figure 7(a), that across the core plasma the normalised gradients  ,
,  and
and  are all larger in pulse #96 713 than in pulse #94 980, with
  and
and  higher and
  higher at mid-radius. This increase is a signature of improved energy and momentum confinement, particularly in the ion channel across the core plasma in the pellet + gas fuelled pulse.
The heat fluxes in the ion and electron channels  and
and  , normalised to the ion-gyro-Bohm heat flux qi,gB
are plotted in figure 7(b)
14
. For pulse #96 713 with gas + pellet fuelling, these normalised heat fluxes are almost equal with
, normalised to the ion-gyro-Bohm heat flux qi,gB
are plotted in figure 7(b)
14
. For pulse #96 713 with gas + pellet fuelling, these normalised heat fluxes are almost equal with  right across the core plasma. In contrast, for the gas fuelled pulse #94 980, while
  in the mantle region (
 ), deeper into the core plasma qi
progressively exceeds qe
, with
), deeper into the core plasma qi
progressively exceeds qe
, with  in the core.
The normalised, perpendicular E × B shearing rate  15
, also shown in figure 7(b), is considerably higher in pulse #96 713 than in pulse #94 980, by up to a factor ∼3 at mid-radius. This shearing can suppress the amplitude of ion-scale turbulence when
15
, also shown in figure 7(b), is considerably higher in pulse #96 713 than in pulse #94 980, by up to a factor ∼3 at mid-radius. This shearing can suppress the amplitude of ion-scale turbulence when  [41, 42], thereby reducing the associated heat flux. Hence, it is likely that E × B shear plays a more significant role in regulating the level of turbulent ion heat transport in pulse #96 713, in which
  at mid-radius, than in pulse #94 980.
Thermal diffusivities for the ion and electron channels, normalised to the ion-gyro-Bohm thermal diffusivity,  and
and  are compared in figure 7(c) for the same two pulses, together with the normalised diffusivity of the toroidal angular momentum
  . Also shown is an estimate of the gyro-Bohm normalised, neo-classical (NC) ion thermal diffusivity
  , which is calculated in TRANSP using the NCLASS code [43].
It can be seen from figure 7(c) that for both pulses, in the peripheral mantle region the normalised thermal diffusivities of the ions and electrons are approximately equal, i.e.  . For pellet + gas fuelled pulse #96 713 this is also the case right across the core plasma. In contrast, for the gas fuelled pulse #94 980, further into the plasma χi
progressively exceeds χe
, with
. For pellet + gas fuelled pulse #96 713 this is also the case right across the core plasma. In contrast, for the gas fuelled pulse #94 980, further into the plasma χi
progressively exceeds χe
, with  in the core. In both pulses these thermal diffusivities far exceed the ion neo-classical level, with both
  . This certainly indicates that ion-scale turbulent transport is by no means fully suppressed in either pulse.
In both pulses, the Prandtl number  decreases from Pr ∼ 0.5 at ρtor
∼ 0.7 both deeper into the core plasma and outward across the pedestal region, which is an indication that there is some degree of suppression of ion-scale turbulence (which results in stronger viscosity than electron scale turbulence) in the core and peripheral regions.
decreases from Pr ∼ 0.5 at ρtor
∼ 0.7 both deeper into the core plasma and outward across the pedestal region, which is an indication that there is some degree of suppression of ion-scale turbulence (which results in stronger viscosity than electron scale turbulence) in the core and peripheral regions.
These results suggest that ion-scale turbulence (ITG or TEM), which can result in both ion and electron heat transport with equal efficacy, is primarily responsible for the core heat transport in both pulses. However, in the higher performance pulse #96 713 with pellet + gas fuelling, at least some of the increased ion pressure in the core may be caused by a modest relative reduction in the efficiency of ion-scale, turbulent heat transport, caused by the increased E × B flow shear across the core plasma.
In spite of the fact that in both pulses the integrated heating power to the ions is approximately equal at mid-radius, the ∼×3 higher χi in the gas fuelled pulse #94 980 results in lower core Ti gradient and hence reduced core ion energy confinement than in the pellet + gas fuelled pulse #96 713. This is a consequence of the more peaked ion heating and torque deposition profiles resulting from the reduced pedestal density with the pellet + gas fuelling compared to that with the gas fuelling alone.
2.4. W impurity behaviour in 3.5 MA baseline pulses
In high-power ITER-baseline scenario pulses with  of heating power, a substantial fraction of the input power is radiated from the core plasma, i.e.
  –40%. It has been shown in [8] that these losses are dominated by radiation from W impurities, which accounts for
  of the total radiation. In such pulses, these impurities are typically localised to the outer 'mantle' region of the confined plasma, e.g. as shown for the 3 MA/2.8 T pulse #92 432 with 32 MW heating power in figure 13(a). The radially outward centrifugal force due to the toroidal rotation localises the heavy W ions to the LFS mid-plane where the total emissivity
  m
peaks [44]. However, because of the very high parallel electron thermal conductivity
m
peaks [44]. However, because of the very high parallel electron thermal conductivity  , it is the flux-surface-averaged emissivity
  that is relevant to the electron power balance (see figure 2(b)).
The reason why the impurity ions tend to remain localised to the mantle region in these ITER-baseline pulses is because the density gradient across the core plasma is much weaker than that of the ion temperature, i.e. there is a low degree of density peaking. As is discussed in [8] and references therein, the radial neo-classical convection velocity of impurity ions is proportional to the parameter  [45]. Hence, a peaked
Ti
profile and a flat
ne
profile favours outward neo-classical convection, expelling the impurities from the plasma core. The converse is also true and, particularly in 'hybrid' scenario plasmas [1], which operate with a lower pedestal density ne,ped
and consequently with a more peaked ne
profile, this can cause the W impurities to accumulate in the plasma core and lead to radiation collapse.
[45]. Hence, a peaked
Ti
profile and a flat
ne
profile favours outward neo-classical convection, expelling the impurities from the plasma core. The converse is also true and, particularly in 'hybrid' scenario plasmas [1], which operate with a lower pedestal density ne,ped
and consequently with a more peaked ne
profile, this can cause the W impurities to accumulate in the plasma core and lead to radiation collapse.
The evolution of the flux-surface-averaged W impurity density  is shown in figures 8(a)–(c) for the three 3.5 MA ITER-baseline pulses discussed in section 2, from which it can be seen that the W is typically localised to the mantle region, i.e.
  . Only in one of these pulses #94 980 is there a brief period during which
  peaks in the plasma core but these impurities are expelled again later.

Figure 8. Comparison for the three 3.5 MA/3.3 T ITER-baseline scenario pulses with different fuelling #94 915 (a, d), #94 980 (b, e) and #96 713 (c, f) shown in figure 1 of: (a)–(c) the flux-surface-averaged W impurity density  (top); and (d)–(f) the neo-classical convection parameter ζNC
(bottom), both as a function of ρtor
. For #94 980 and #96 713 the W density is determined from the integrated analysis of [34], while for #94 915 it is determined by assuming W radiation dominates the total emissivity from bolometer tomography, i.e. that
(top); and (d)–(f) the neo-classical convection parameter ζNC
(bottom), both as a function of ρtor
. For #94 980 and #96 713 the W density is determined from the integrated analysis of [34], while for #94 915 it is determined by assuming W radiation dominates the total emissivity from bolometer tomography, i.e. that  , where
  is the total emissivity coefficient of W in the mantle region.
Download figure:
Standard image High-resolution imageAlso shown in figures 8(d)–(f) is a comparison of the evolution of profiles of the neo-classical convection parameter ζNC
. This is calculated from the results of an interpretive TRANSP calculation, which is based on kinetic data provided from fits to electron density ne
and temperature Te
profile data measured by the HRTS [29] and Ne10 + impurity ion temperature Ti
and toroidal rotation  profile data from the core and edge CXRS systems [30].
From these plots it can be seen that, while  is strongly negative in the pedestal region (off the colour scale), hence driving the impurities across the pedestal into the confined plasma, it is weakly positive
  right across the core of the plasma. Consequently, once inside the confined plasma, the impurities are screened from the core plasma by outward convection, which concentrates them in the outer mantle region. Note that the convection velocity
  , where Z is the impurity ion charge and Dc
is the collisional diffusivity [45]. Typically, the W ions are in charge states W25 − 30 + in the mantle region (see figure 9(c)), so this convection is very strong for the W ions. Also, the strong polodial asymmetry enhances the convection by a further factor 1/(2 2) ∼ 5, where the inverse aspect ratio = r/a [46].
, where Z is the impurity ion charge and Dc
is the collisional diffusivity [45]. Typically, the W ions are in charge states W25 − 30 + in the mantle region (see figure 9(c)), so this convection is very strong for the W ions. Also, the strong polodial asymmetry enhances the convection by a further factor 1/(2 2) ∼ 5, where the inverse aspect ratio = r/a [46].
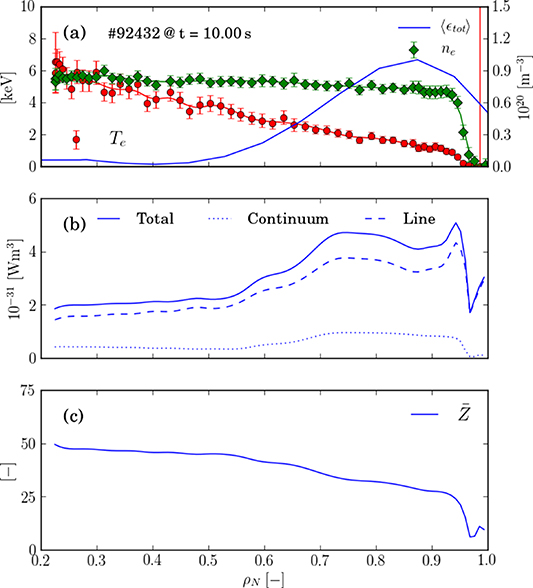
Figure 9. Profiles for the high-power, JET-ILW pulse #92 432 at 10 s of: (a) electron temperature Te
( ) and density ne
(
) and density ne
( ) measured by high-resolution Thomson scattering and flux-surface averaged, total emissivity
  from bolometer tomography (solid-blue); (b) emissivity coefficients
  for W radiation (total-solid, line-dashed and continuum-dotted) from ADAS [48, 49]; and (c) mean ionic charge
  of W, where coronal ionisation balance is assumed for the W atomic data.
Download figure:
Standard image High-resolution imageNote that there are circumstances in these high-power, ITER-baseline pulses in which profile changes following an H- to L-mode transition, triggered by the strong W radiation from the plasma periphery, causes a sudden accumulation of the impurities. This typically leads to termination of the high-performance phase, either triggering a 'pulse stop' or causing a disruption due to radiation collapse. Such a radiation event occurs in the 3 MA pulse #92 432, the phenomenology of which is described in section 2.6.
Note that in pulse #94 915, during the periods of ELM-free H*-mode
16
, radiative cooling of the mantle region by the increasingly strong W radiation together with a concomitant increase in density, causes stronger outward convection ( ), localising the W to the plasma periphery. However, during the subsequent periods with rapid type-III ELMs, the resulting increase in the ne
gradient in the mantle causes this convection to reverse (
), localising the W to the plasma periphery. However, during the subsequent periods with rapid type-III ELMs, the resulting increase in the ne
gradient in the mantle causes this convection to reverse ( ), thereby allowing the W impurities to penetrate deeper in to the plasma, although they do not accumulate in the core.
While the W impurities are localised to the mantle region by the outward neo-classical convection, they can be efficiently expelled from the confined plasma by the ELMs. The ELMs typically expel a small fraction of the plasma particles, peeling off part of the edge plasma, causing relative density losses  –10%. If the impurities are concentrated in the periphery, the ELMs can 'flush' out a larger relative fraction of the impurity content than that of the main ions.
We define here the flushing efficiency of the W impurities by an ELM as  , i.e. the relative change in the W content of the plasma due to the ELM. Because the total radiation in high-power, JET-ILW pulses is dominated by that from W, this flushing efficiency can be evaluated from fast, bolometric measurements of the total radiation from the confined plasma, as described in detail in the following section 2.5.
2.5. Evaluation of ELM W 'flushing' efficiency
An estimate of the efficacy of each ELM at flushing the W impurities from the confined plasma (and also their influx during the inter-ELM periods) can be obtained from an analysis of fast, bolometric total radiation measurements, using a method first applied to JET-ILW plasmas described in [47]. For this analysis we use a fast radiated power signal  calculated from a weighted sum of intensities from a bolometer camera viewing the main chamber horizontally from the LFS [28].
As shown in figure 9(b) for the high-power, 3 MA ITER-baseline pulse #92 432, the total emissivity coefficient of W is reasonably constant over the mantle region ( ), i.e.
  , where the W radiates most intensely (see figure 9(a)). Typically, in the mantle region, where Te
∼ 1–3 keV, the average charge state
, where the W radiates most intensely (see figure 9(a)). Typically, in the mantle region, where Te
∼ 1–3 keV, the average charge state  of the impurities is W25 − 30 + . The atomic data shown in figure 9 is from the ADAS database of spectroscopic data [48] and uses total radiated line power (
 ) data for W from [49].
As the W radiates mainly from the mantle region and the emissivity of W is reasonably constant over the relevant temperature range (1–3 keV), the average W density  in the mantle can be estimated from the expression:
  , where
  is the average density over the mantle region and Vman
is the volume of the mantle ∼22 m3. We next explain how we obtain a fast enough signal
is the average density over the mantle region and Vman
is the volume of the mantle ∼22 m3. We next explain how we obtain a fast enough signal  quantifying the radiated power from the mantle region to determine the ELM flushing efficiency, which requires a frequency response of order 1 kHz.
The power radiated from the confined plasma  can be calculated from a weighted sum of horizontally viewing, line-integrated measurements of total intensity measured using a multi-chord bolometer system [28]. This system has a sample rate of 5 kHz and uses an adaptive filtering algorithm so as not to smooth fast transients due to ELMs, while having lower bandwidth of typically 0.2 kHz during steady phases. As this calculation relies on assumptions on the symmetry of the emissivity on flux surfaces, it tends to overestimate
  by as much as 50% in the presence of highly in-out asymmetric emissivity distributions. Here, we refer to this fast radiated power signal as
  .
.
In order to overcome this problem and accurately calculate the radiated power from the mantle region  , we use the total emissivity distribution m
(R, z) obtained from tomographic inversion [27] of the multi-chord bolometer data, which take proper account of the poloidal asymmetry. Reconstructions are calculated at the mid-times of each inter-ELM period, using input data averaged over 5 ms intervals. The resulting distributions are integrated over the volume of the mantle to form a 'slow' radiated power signal we refer to here as
, we use the total emissivity distribution m
(R, z) obtained from tomographic inversion [27] of the multi-chord bolometer data, which take proper account of the poloidal asymmetry. Reconstructions are calculated at the mid-times of each inter-ELM period, using input data averaged over 5 ms intervals. The resulting distributions are integrated over the volume of the mantle to form a 'slow' radiated power signal we refer to here as  . Note that in these high-power, ITER-baseline scenario pulses, typically ∼70% of the radiated power is emitted from the mantle region (see figure 10(c)).

Figure 10. The evolution of JET-ILW pulse #92 432 illustrating the effect of W radiation on the mantle: (a) the signal  (blue), the average W concentration in the mantle
  (red) and the ELM times (green dashed); (b) the relative changes to the W content in the mantle
  caused by ELM flushing (green), the influx between ELMs (blue) and the net change over the ELM cycle (black); (c) the separatrix loss power
  (blue-solid) and the L/H-transition threshold power PLH
[52]; and the fractions of radiated power
(blue-solid) and the L/H-transition threshold power PLH
[52]; and the fractions of radiated power  (RHS-dashed) from the confined plasma (black), the mantle (blue) and the core (
 ) (red); (d) the flux-surface averaged emissivity
  ; (e) the electron temperature Te
(
; (e) the electron temperature Te
( ) and density ne
(
) and density ne
( ) at ρN
= 0.9; and (f) the neo-classical convection parameter
) at ρN
= 0.9; and (f) the neo-classical convection parameter  averaged over the mantle region (blue).
Download figure:
Standard image High-resolution imageWe can correct the fast radiated power signal  to provide a more accurate, fast estimate of
  by scaling it to the more accurate, slow signal
  obtained from the tomography using a time-dependent scale factor. While this procedure may seem complicated, it is necessary if we are to use the resulting values of
  to estimate the concentration of W in the mantle region.
From both the fast estimate of the radiated power from the mantle  and a fast measurement of the line-average density
  from the lower, horizontal interferometer channel (#5), which passes through the outer half of the lower plasma cross-section, the ELM W flushing efficiency can be evaluated from the change in the signal
  aka the 'flushing' signal between short averaging periods just before and after the ELM crash, i.e. from the expression
  .
.
For our analysis we use pre- and post averaging times of  and
and  relative to the time tELM
of the peak Be II intensity signal. The post-ELM time period is delayed by 5 ms to avoid the transient increase in radiation that is caused by the ELM-sputtered W influx before the ionisation balance has had time to recover. It is a general phenomenon that when a population of impurity ions has not yet reached coronal ionisation balance, they are able to radiate more efficiently than when in equilibrium [50].
relative to the time tELM
of the peak Be II intensity signal. The post-ELM time period is delayed by 5 ms to avoid the transient increase in radiation that is caused by the ELM-sputtered W influx before the ionisation balance has had time to recover. It is a general phenomenon that when a population of impurity ions has not yet reached coronal ionisation balance, they are able to radiate more efficiently than when in equilibrium [50].
A similar measure, estimating the relative change in the W content between the ELMs, i.e. the relative inter-ELM ingress or 'fluence' of W  can be calculated from the difference between the post-ELM value of ffl
and that prior to the subsequent ELM, i.e.
can be calculated from the difference between the post-ELM value of ffl
and that prior to the subsequent ELM, i.e.  . These measures of the ELM W flushing efficiency
  and the relative, inter-ELM fluence
  can then be used to calculate net rates of change of the W impurity content,
  from a time-dependent average, as described in appendix B of [51].
In the case of a group of rapid ELMs, with an inter-ELM period shorter than the pre- and post-ELM averaging times of  , it is only possible to determine the flushing for the group of ELMs, which we choose to split equally between the sub-ELMs, while the inter-ELM fluence is allocated to the last in the group. A property of this ad-hoc method of handling the compound ELMs does maintain valid, time-averaged flushing rates γW
calculated from the
, it is only possible to determine the flushing for the group of ELMs, which we choose to split equally between the sub-ELMs, while the inter-ELM fluence is allocated to the last in the group. A property of this ad-hoc method of handling the compound ELMs does maintain valid, time-averaged flushing rates γW
calculated from the  data. Rates of change of the W content due to the ELM flushing
  and the inter-ELM influx
  are shown in figure 11(c) of section 2.7 below, together with the 'net' rate of change due to the balance between these competing fluences, i.e.
  .
.
By availing of fact that radiation from W dominates the radiated power and that the total emission rate coefficient  of W over the 1–3 keV temperature range in the mantle region is almost constant
  , the average W concentration over the mantle region
  can also be estimated from the expression:
  . Typically,
  –3 × 10⁻⁴ in these plasmas, e.g. as shown in figure 10(a).
An example of the application of this ELM-flushing analysis to the the high-power, 3 MA ITER-baseline pulse #92 432 is presented in the following section section 2.6.
2.6. ELM W flushing and 'radiation event' in pulse #92 432
The evolution of the high-power, 3 MA/2.8 T ITER-baseline pulse #92 432 with 32 MW of additional heating power and gas fuelling only at a rate of  , is shown in figure 10 both as an example of the application of the ELM W flushing analysis described above but also to illustrate the profound effect that the strong W radiation can have on the evolution of such high-power H-mode pulses in JET-ILW. Note that this 3 MA pulse has the same q95 and plasma configuration as the 3.5 MA pulses discussed here.
Provided the W impurities remain primarily in the outer, mantle region of the plasma, their effect on the core fusion performance is relatively benign and their radiation helps distribute the power exhaust over the vessel walls. For this situation to persist, two criteria must be satisfied: firstly, the ELMs must flush out enough of the W that crosses the separatrix between ELMs to maintain a constant impurity content; secondly, the Te
and ne
gradients in the mantle must stay aligned such that the impurity convection is directed outwards, i.e.  , so that the W impurities are screened from the plasma core.
During the early ELMy phase of the pulse ( ) these conditions are fulfilled, however, later the ELM frequency slows and they then cease at ∼10.2 s. During the subsequent, ELM-free H*-phase, the density
  , W content (
 ) and the associated radiation primarily from the mantle increase strongly, to a fraction
  of the input power (see figure 10(c)). The slowing of the ELMs prior to the H*-phase is caused by an increase in the gas puffing rate by the control system, which is intended to increase
fELM
, i.e. this has the opposite effect to that expected. The phenomenology of these events is discussed further in section 3.
of the input power (see figure 10(c)). The slowing of the ELMs prior to the H*-phase is caused by an increase in the gas puffing rate by the control system, which is intended to increase
fELM
, i.e. this has the opposite effect to that expected. The phenomenology of these events is discussed further in section 3.
The consequent reduction of the net power crossing the separatrix  below L/H-transition threshold power PLH
[52] triggers a subsequent back transition to L-mode (see figure 10(c)). Note that, the fact that PLH
increases with Bt
means that this type of behaviour is more prone to occur in higher-current baseline-scenario pulses with higher Bt
, making then more difficult to control.
below L/H-transition threshold power PLH
[52] triggers a subsequent back transition to L-mode (see figure 10(c)). Note that, the fact that PLH
increases with Bt
means that this type of behaviour is more prone to occur in higher-current baseline-scenario pulses with higher Bt
, making then more difficult to control.
As shown in figures 10(f) and (g), the resulting peaking of the ne
profile due to the loss of the density pedestal after the transition to L-mode results in a sudden reduction of the neo-classical screening ( ). As is evident from the evolution of the total emissivity
  shown in figure 10(d) this reduction in screening then causes sudden accumulation of the W impurities the plasma core, resulting in a reduction of the stored energy Wpl
by ∼30%.
shown in figure 10(d) this reduction in screening then causes sudden accumulation of the W impurities the plasma core, resulting in a reduction of the stored energy Wpl
by ∼30%.
The influence of the strong mantle radiation on the electron power balance is evident from figure 10(e), which shows that there is a significant reduction of Te just inside the pedestal top (at ρtor = 0.9) and a corresponding increase of ne as the level of mantle radiation increases (see [8] for a detailed discussion of the electron and ion power balance in this pulse).
The resulting changes to the ne
and Te
gradients in the mantle initially causes  to increase (see figure 10(f)), driving the impurities more strongly outwards. At the H/L-transition at 10.5 s,
  suddenly decreases to ∼0, when the normalised density gradient
  in the mantle region steepens, causing the W impurities to rush into in the plasma core. This behaviour is evident from the evolution of the total emissivity distribution
  , which is shown in figure 10(d).
During the ELMy H-mode phase, as shown in figure 10(a), while the W concentration in the mantle ( ) remains quite constant at
  , there is a gradual increase in the W content
  , causing a concomitant increase in the mantle radiation
  (see figure 10(c)). This gradual increase is a result of a delicate balance between the flushing of the W impurities by the ELMs from the confined plasma and their influx across the pedestal between the ELMs.
The relative W flushing efficiency  and inter-ELM W fluence
  evaluated for each ELM are shown in figure 10(b), together with the net, relative change in the W content over each ELM cycle, i.e.
  . It is evident that, while ∼5%–10% of the W content is flushed by each ELM, a similar amount is convected across the pedestal from the SOL and re-enters the plasma between the ELMs. The small, net change results in a gradual change on a timescale
  .
.
In this pulse, ELMy H-mode does resume at the end of the period shown but the high-Z impurities remain in the plasma core and the stored energy does not fully recover to the level prior to the radiation event. The use of ELM-pacing pellets in such pulses alters the characteristics of the ELMs and allows the duration such high-performance, ITER-baseline pulses to be extended. The behaviour of 3.5 MA ITER-baseline, H-mode pulses with ELM pacing pellets is discussed in the following section section 2.7.
2.7. ELM flushing and W behaviour in 3.5 MA pulses
In this section, we investigate the ELM flushing and W behaviour in the three 3.5 MA ITER-baseline pulses with different gas and/or pellet fuelling that were discussed previously in section 2. Results of the ELM W flushing analysis for these pulses are presented in figure 11.
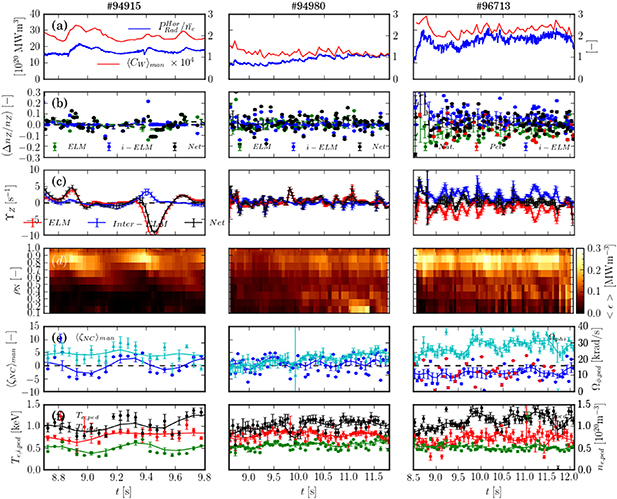
Figure 11. A comparison for the three high-power, 3.5 MA/3.3 T baseline-scenario JET-ILW pulses of figure 1 (key parameters given in table 1), showing the evolution of: (a) the signal  (blue) and the estimated average W concentration over the mantle region
  (red); (b) the fraction of W flushed per ELM
  for natural (
 ) and pellet-triggered (
 ) ELMs, the inter-ELM W influx
  (
( ) and the net fractional change in W content per ELM cycle (•); (c) the respective rates of change of the W content
  due to the ELM flushing (
 –red), the inter-ELM influx (
 –blue) and the resulting net rate of change (
 –black), (d) the flux-surface-averaged total emissivity
  from bolometry; (e) the neo-classical convection parameter
  averaged over the mantle region (blue and
  ,
,  following pellet-triggered ELMs) and the toroidal rotation rate
  (
( ) measured by CXRS at the top of the density pedestal; and (f) the electron Te,ped
(
) measured by CXRS at the top of the density pedestal; and (f) the electron Te,ped
( ) and ion Ti,ped
(•) pedestal temperatures and the pedestal density ne,ped
(
) and ion Ti,ped
(•) pedestal temperatures and the pedestal density ne,ped
( ).
).
Download figure:
Standard image High-resolution imageConsidering first, the pulse #94 915 with the lower rate of gas fuelling ( ) alone, we see that this pulse is non-stationary, exhibiting three H*-phases, during which the mantle W radiation increases, just as occurred in pulse #92 432, as described in section 2.6 above. The W concentration in the mantle
  is similar in both of these gas-only fuelled pulses.
The strong mantle radiation does not result in an H/L-transition as in pulse #92 432, instead the H*-phase is terminated by a single large amplitude ELM, which is followed by a sustained burst of small, type-III ELMs (see figure 1(e)). During these phases, the ne gradient in the mantle region increases, resulting in a reversal of the neo-classical convection from outward to inward, as shown in figure 11(e). This reversal allows the W to migrate deeper into the plasma core, as is evident from the evolution of the total emissivity shown in figure 11(f), however, the impurities do not accumulate in the plasma core.
The combined effect of the few, large and frequent, small ELMs does provide sufficient flushing of the W to maintain a reasonably constant W concentration. However, during the final H*-phase, a strong increase of the total radiated power  triggered an early 'pulse-stop', which initiated an increase in the gas fuelling rate. During the ramp-down phase of this pulse, there was a disruption, resulting in vessel forces exceeding 350 T. This non-stationary nature of high-power, ITER-baseline pulses with a low rate of gas fuelling leads to a high fraction of pulses disrupting, which is clearly unacceptable.
Increasing the D2 gas puffing rate, as in pulse #94 980 ( ), provides a safe means of controlling the W impurity level, and thereby reducing the disruptivity, but at the cost of decreased energy confinement. The more frequent ELMs induced by the increased gas puffing flush out more W, significantly reducing the W concentration to
  –1.5 × 10⁻⁴. Note, however, that there is a gradual buildup of the W content due to the increasing
  (see figure 11(a)). The W impurities are also not so well screened from the core because of the reduced core Ti
and hence weaker
(see figure 11(a)). The W impurities are also not so well screened from the core because of the reduced core Ti
and hence weaker  , resulting in the neo-classical convection parameter ζNC
∼ 0 in the mantle region.
, resulting in the neo-classical convection parameter ζNC
∼ 0 in the mantle region.
Comparison of the pedestal parameters shown in figures 11(e) and (f), shows that the increased gas puffing in pulse #94 980 does not significantly reduce Te,ped
, or indeed increase ne,ped
, compared to those in pulse #94 915. There is, however, a significant reduction in toroidal rotation rate  at the top of the density pedestal caused by the increased gas puffing rate in pulse #94 980. In both pulses, the ion temperature Ti,ped
, here defined as Ti
at the top of the density pedestal
17
, is significantly higher (∼20%) than Te,ped
.
at the top of the density pedestal caused by the increased gas puffing rate in pulse #94 980. In both pulses, the ion temperature Ti,ped
, here defined as Ti
at the top of the density pedestal
17
, is significantly higher (∼20%) than Te,ped
.
As already discussed above, the use of ELM-pacing pellets in pulse #96 713 allows the duration of the high-performance phase to be extended without degrading the energy confinement. The main beneficial effect of the pellets is to trigger regular ELMs under conditions which would otherwise result in ELM-free H*-phases, as occur in pulse #94 915. This allows pulse #96 713 to be run with an even lower gas puffing rate ( ) than that used in pulse #94 915 (
 ). The danger with such a strategy is the necessity of reliable pellet injector operation to deliver a regular stream of pellets for the pulse to run without risk of a radiation induced disruption.
Although the total D2 fuelling rate from gas and pellets, i.e.  , is the same in pulse #96 713 as used in pulse #94 980, the performance of the pulse is superior in terms its overall energy confinement. We will see that the origin of this lies not in significantly higher Te,ped
but in increased toroidal rotation and hence rotational shear from the pedestal top, inwards across the core plasma and hence increased core ion energy confinement.
, is the same in pulse #96 713 as used in pulse #94 980, the performance of the pulse is superior in terms its overall energy confinement. We will see that the origin of this lies not in significantly higher Te,ped
but in increased toroidal rotation and hence rotational shear from the pedestal top, inwards across the core plasma and hence increased core ion energy confinement.
From figure 11(a), we can see that the W concentration of  is in fact as high in pulse #96 713 as in pulse #94 915. As evident from the evolution of the total emissivity shown in figure 11(d), the W is also not as well screened from the plasma core as in pulse #94 915. Averaged over the mantle region, the neo-classical convection parameter is slightly negative
  in pulse #96 713, i.e. weakly inwards (see figure 11(e)). However, the full radial profiles shown in figure 8(b), show that
  at mid-radius, hence the N-C convection still acts to screen the W from the core.
Comparison of the pedestal parameters in figures 11(e) and (f), show that whereas Te,ped
is similar in the three pulses, while ne,ped
is slightly lower in the pulse #96 713 with the pellets, there is a significant difference in the ion parameters (Ti,ped
and  ) from the edge CXRS measurements. In pulse #96 713, there is a greater ratio of
  , than in the other two pulses (∼1.4) and the rotation at the pedestal top
  is also ∼×1.4 higher.
In section 2.1 above, we showed that this enhanced rotation in the pulse #96 713 with pellets and the lower rate of gas fuelling, in fact occurs right across the plasma from the pedestal to the core. This perhaps arises from reduced CX damping of the toroidal momentum due to the lower D0 atomic density resulting from the reduced gas puffing into the main chamber.
In the following section section 2.8, the dependence of the W flushing efficiency  on the fractional ELM density losses
  is investigated, classifying the data according to whether the ELMs are spontaneous or pellet-triggered events.
2.8. Influence of ELM type on W flushing efficiency
By identifying whether the ELMs are either spontaneous aka 'natural' or 'pellet-triggered' events, the data for the relative W flushing efficiency  and inter-ELM fluence
  can be classified according to ELM type. This classification is performed by determining whether the occurrence of the ELMs is coincident with the arrival of the pellets at the plasma edge.
Such data is shown in figure 12 for six 3.5 MA baseline-scenario pulses with 30–37 MW of additional heating power, three with only D2 gas fuelling at rates of ΓD2,gas
∼ 1.5, 2.3 and  and three with both gas fuelling (1–
 ) and
) and  ELM pacing pellets (fPel
∼ 35 Hz). The W flushing
ELM pacing pellets (fPel
∼ 35 Hz). The W flushing  and inter-ELM fluence
  data are plotted as a function of the relative ELM density losses
  , which are determined from the decrease at the ELMs of the line-average density
  from channel #5 of the FIR interferometer passing diagonally through the lower, outer half of the plasma cross-section.

Figure 12. Comparison of data from six 3.5 MA/3.3 T baseline-scenario pulses with 30 − 37 MW of additional heating power with: only gas fuelling (#94 915 ( ), 94 964 (
 ) and 94 980 (
 )
)  ) and with both gas fuelling (1–
 ) and pacing pellets (fPel
∼ 35 Hz) and (#96 536, 96 713 and 96 750 –
) and pacing pellets (fPel
∼ 35 Hz) and (#96 536, 96 713 and 96 750 –  , , for pellet triggered (
 ) and natural (
 ) ELMs, showing: (a) the relative change in W content of the confined plasma due to ELMs
  and (b) the inter-ELM fluences
  . Histograms on the x- and y-axes show probability density functions (PDFs) of the respective quantities for the different ELM types: in gas-only pulses (
 ) and pulses with pacing pellets for natural (
 ) and pellet-triggered (
 ) ELMs), where the dashed lines and error bars represent the average values and standard deviations of the data points.
Download figure:
Standard image High-resolution imageTo better quantify the differences in these parameters between the different classes of ELMs, histograms, i.e. PDFs, of the distributions of the data are plotted on the corresponding axis. These histogram plots also show the mean and standard deviation of the data for each class of ELMs. While the 'natural' ELMs typically result in density losses  –10%, the density losses due to pellet-triggered ELMs are smaller and some of the pellets result in a small net fuelling.
Note that these ELM-pacing pellets are smaller (∼20% of the particle content) than those used for fuelling, i.e. of  , see
, see  for the fuelling pellets, and are hence mostly ablated before reaching the pedestal top. Typical particle contents of the pacing and fuelling pellets are
  and
and  respectively.
Average values and standard deviations of the data show in figure 12 are stated in table 5. For the natural ELMs, the average density losses  are similar in both the gas-only and gas + pellet-fuelled pulses. However, for the pellet-triggered ELMs, on-average the density losses are considerably smaller
  , i.e. there is significant net fuelling of the confined plasma by many of the pacing pellets.
Table 5. Average values of data shown in figure 12 by fuelling source and ELM type for high-power, 3.5 MA/3.3 T ITER-baseline pulses.
| Fuelling | ELM type |
 (%) (%) |
 (%) (%) | |
|---|---|---|---|---|
| — | — | ELM | ELM | inter-ELM |
| Gas-only | Natural | −2.8 ± 0.1 | −0.7 ± 0.3 | 0.2 ± 0.3 |
| Pel and Gas | −2.4 ± 0.2 | −1.4 ± 0.2 | 1.3 ± 0.2 | |
| Pellet | −0.7 ± 0.1 | −2.9 ± 0.4 | 2.3 ± 0.3 | |
| — | All | −2.2 ± 0.1 | −1.4 ± 0.2 | 0.9 ± 0.2 |
There is a large scatter in the ELM flushing  and inter-ELM fluence
  data for several reasons. Firstly, the measurement method gives only an approximate measure and is prone to error. Also, while some ELMs are followed by ELM-free periods of significant duration, others are followed by the groups of rapid small ELMs, which complicates the measurement. In spite of these difficulties with the measurement, it may well be that some ELMs do result in a net increase in the W content as a result of an interchange component of the ELM instability [53], which could mix some cold plasma from the SOL containing W back into the confined plasma.
There are significant differences in the average ELM W flushing efficiency for the three ELM types. The ELMs in the gas fuelled pulses are on-average, about half as efficient at flushing the W than the natural ELMs in the pellet fuelled pulses, while the pellet triggered ELMs are more efficient at flushing the W than the natural ELMs with either fuelling method. This is not simply a result of change to the the density losses  , which show the opposite trend with ELM type. Although the pellets result in lower net density losses following the triggered ELM, more W is flushed from the plasma than after natural ELMs.
There are also significant differences in the inter-ELM W fluence data between the natural and pellet triggered ELMs. On average, considerably more W is able to enter the plasma following the pellet triggered ELMs. Also, more W enters the plasma after either ELM type in pellet + gas fuelled pulses than gas-only fuelled pulses. Note that the average magnitudes of the ELM W flushing and inter-ELM ingress are similar, so the net change in the W content of the plasma is a delicate balance between these processes. In section 2.10 below, we investigate how differences between the pedestal and mantle gradient parameters might affect the transport of W in the edge plasma.
2.9. Influence of ELM type on sputtered impurity sources
Other than affecting the ELM W flushing efficiency and inter-ELM ingress of W into the plasma, the pellets might also affect the sources of impurities sputtered by the ELMs from the PFCs. In this section, we compare relative intra-ELM fluences, i.e. influxes integrated over the duration of the ELM peak in the line intensity signal, of Be and W impurities ΦBe,W sputtered from the inner and outer divertor targets by the interaction with the ELMs.
A relative measure of these fluences can be estimated from time-integrated Be II (527 nm) and W I (401 nm) line intensities measured by a multi-chord spectrometer viewing the HFS, and LFS divertor targets. The lines of sight of this spectrometer are shown in figure 13(a). Profiles of the Be II (527 nm) and W I (401 nm) line intensities time-integrated over the ELM peak are shown in figure 13(b) as a function of the distance S along the divertor target. The most intense interaction with the ELM is with the top of the inner and outer vertical targets aka 'domes' and also at the strike points [51]. Also shown in figures 13(c) and (d) are the evolution of the Be II (527 nm) and W I (401 nm) line intensities, summed over channels viewing the inner and outer divertor targets, over the duration of a typical type-I ELM, indicating the period over which the intra-ELM fluences are integrated.
Note that the inner strike point is hidden from view in this corner-corner (C-C) configuration in which the both strike points are close to the divertor pumping throats, so these measurements are unable to detect the impurity influxes from the vicinity of outer strike point. It has been shown from the analysis of spectrally filtered, fast-camera imaging data from JET-ILW that the intra-ELM sputtered W0 influx is almost an order of magnitude larger than the time-integrated inter-ELM influx from the strike-point regions [54].
In figures 14(a) and (b), relative, intra-ELM Be+ fluences  estimated (assuming constant ionisations/photon, S/XB) from the time-integrated Be II (527 nm line intensity data summed over the HFS and LFS divertor targets respectively, plotted versus the relative ELM density losses
  . Similar data for the relative W0 atomic, intra-ELM fluences
  are shown in figure 15. Average values of these fluences
  and
and  with their standard deviations are stated in table 6. The bremsstrahlung contribution to the W I line, detected by a LOS viewing through the x-point, which does not view a region of the target with significant interaction with the SOL plasma, is estimated to be
  during the intra-ELM periods.
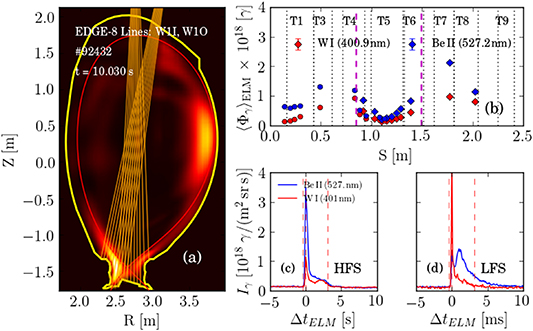
Figure 13. Bolometric total radiation and spectroscopic impurity influx data for the high-power, 3 MA JET-ILW pulse #92 432 showing: (a) tomographic reconstruction of total emissivity m
(R, z) at the peak of an ELM crash (t = 10.035 s) and lines of sight (LoS) of the multi-channel, visible range spectrometer system (KS3) viewing the divertor region (orange); (b) intra-ELM photon fluences  averaged over the period
  of the W I (400.9 nm)
  and Be II (527.9 nm)
  lines vs' the S-coordinate along the divertor target surface starting at the top corner of the inner 'dome' structure (the symbols indicate the LoS groups viewing the LFS (•) and HFS (
 ) regions); and (c), (d) time evolution over a single ELM of the intensity of the same Be II and W I lines summed over the channels viewing the inner (c) and outer (d) divertor regions. In (a) and (b), the vertical lines indicate the locations of the strike points (magenta-dashed) and divertor tile edges (black-dotted).
Download figure:
Standard image High-resolution image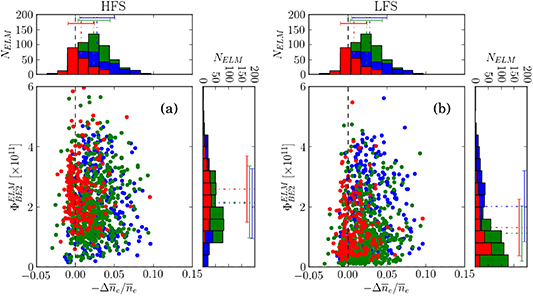
Figure 14. Comparison of data from the same high-power, 3.5 MA/3.3 T pulses as for figure 12 with only gas ( ) and with pellet and gas fuelling (
 ,
,  ), for pellet-triggered (
 ) and natural (
 ,
,  ) ELMs, showing: relative, time-integrated, intra-ELM fluences of Be+ ions
  measured by a multi-channel visible-range spectrometer (KS3) viewing the divertor region, spatially integrated over: (a) the HFS and (b) the LFS divertor targets. As in figure 12, the histograms show PDFs of the respective quantities for the different ELM types.
Download figure:
Standard image High-resolution image
Figure 15. Comparison of data from the same high-power, 3.5 MA/3.3 T pulses as for figure 12 with only gas ( ) and with pellet and gas fuelling (
 ,
,  ), for pellet-triggered (
 ) and natural (
 ,
,  ) ELMs, showing: relative, time-integrated, intra-ELM fluences of W0 atoms
  measured by a multi-channel visible-range spectrometer (KS3) viewing the divertor region, spatially integrated over: (a) the inner (HFS) and (b) the outer (LFS) divertor targets. As in figure 12, the histograms show PDFs of the respective quantities for the different ELM types.
Download figure:
Standard image High-resolution imageTable 6. Average values of the relative intra-ELM Be+ and W0 fluence data  and
and  , classified by fuelling source and ELM type for the data shown in figures 14 and 15 from high-power, 3.5 MA pulses. The sum of these fluences from both HFS and LFS targets is also stated.
| Fuelling | ELM type | HFS | LFS | Total | |||
|---|---|---|---|---|---|---|---|
| — | — |

|

|

|

|

|

|
| — | — | (a.u.) | (a.u.) | (a.u.) | (a.u.) | (a.u.) | (a.u.) |
| Gas-only | Natural | 1.15 ± 0.03 | 2.11 ± 0.07 | 0.73 ± 0.02 | 2.02 ± 0.07 | 1.88 ± 0.05 | 4.13 ± 0.12 |
| Pel and Gas | 1.48 ± 0.03 | 2.16 ± 0.05 | 0.52 ± 0.02 | 1.11 ± 0.04 | 2.00 ± 0.04 | 3.27 ± 0.10 | |
| Pellet | 1.46 ± 0.03 | 2.59 ± 0.08 | 0.60 ± 0.03 | 1.32 ± 0.07 | 2.06 ± 0.05 | 3.91 ± 0.13 | |
| — | All | 1.38 ± 0.02 | 2.23 ± 0.04 | 0.60 ± 0.01 | 1.42 ± 0.03 | 1.97 ± 0.03 | 3.65 ± 0.07 |
The high degree of scatter in the relative ELM-sputtered  and W0 fluence data is shown in figures 14 and 15 is due to the similarly large spread in the ELM amplitudes. The averaged values over the whole data set, classified by fuelling source and ELM type, reveal little significant difference between these fluences at the HFS target between these cases, except that the natural ELMs sputter slightly less W impurities (∼×0.8) and the pellet-triggered ELMs slightly more Be (∼×1.15) than the average over all ELMs. This is reversed at the LFS target, where the natural ELMs in the gas-only fuelled pulses do sputter significantly more W and Be (∼×1.2 and 1.4 respectively) than the average over all ELMs.
Values of ionisations/photon (S/XB) for these Be and W lines available from the ADAS atomic database [48], increase with both Te
and ne
, as does the fraction of W+ ions promptly redeposited at the surface [3]. Hence, without Te
and ne
data with sufficient temporal ( ) and spatial resolution
  measured at the divertor target surface, it is impossible to evaluate absolute influxes from the measured intensities. However, by assuming fixed values of S/XB and assuming that the measured Be+ influx is equal to the incident flux at the targets, i.e. assuming a balance between erosion and redeposition, it is possible to calculate an effective sputtering yield for W by Be+ ions
  .
.
For intra-ELM conditions, typical S/XB values at Te
= 100 eV and  of (S/XB)WI
= 46.7 and (S/XB)BeII
= 52.5 correspond to an S/XB ratio of 0.89 for the two lines, consistent with that used for a previous measurement on JET-ILW [55]. Resulting values for the intra-ELM sputtering yield lie in the range
of (S/XB)WI
= 46.7 and (S/XB)BeII
= 52.5 correspond to an S/XB ratio of 0.89 for the two lines, consistent with that used for a previous measurement on JET-ILW [55]. Resulting values for the intra-ELM sputtering yield lie in the range  –1.0. These are consistent with values shown in figure 9 of [55], which were obtained using the same diagnostic, assumed S/XB values and spectrometer on JET-ILW.
In [55], it was shown that such high values for  –1.0 are higher than that possible for Be+ ions on W from physical sputtering, which has a maximum yield of
  . Hence, there must be a significant contribution from W sputtering by the incident D+ fuel ions during type-I ELMs at the prevailing pedestal temperatures in JET-ILW. Also, conditional averaging of the resulting data reveals no significant difference in the measured sputtering yield
  by the different classes of ELMs.
2.10. Effect of pellets on pedestal and mantle parameters
We have seen above in section 2.4 that the amount of W in the plasma is a result of a delicate balance between the influx across the pedestal driven by inward neo-classical convection and the flushing of the W by the ELMs. Also, the in the high-power ITER-baseline pulses investigated here, the W is typically localised by outward neo-classical convection to the outer, mantle region, hence mitigating the tendency for this to accumulate in the plasma core.
In this section, we quantify the effect of the ELM pacing pellets on the density and temperature gradients in the pedestal and mantle regions during the inter-ELM periods following the pellet triggered ELMs, comparing the derived quantities ζNC
and  (which govern the neo-classical impurity convection and provide the drive for electron-temperature-gradient (ETG) driven turbulence, respectively) during inter-ELM periods following the pellet-triggered or natural, spontaneous ELMs.
Pedestal characteristics Te,ped
, ne,ped
and pe,ped
and gradient parameters derived from mtanh() fits to ne
and Te
profile data from the high-resolution, Thomson scattering system (HRTS) [29] are shown in figure 16. Values of the gradient parameters  ,
,  and
and  and the derived parameters ζNC
and ηe
are spatially averaged over the pedestal
and the derived parameters ζNC
and ηe
are spatially averaged over the pedestal  and mantle
  regions. In this figure the colour represents the type of the ELM preceding the HRTS measurement, i.e. whether the ELMs are pellet-triggered or natural ELMs in either gas-only or pellet + gas fuelled pulses.

Figure 16. Inter-ELM evolution of parameters determined from fits to HRTS ne
and Te
profile data as a function of the time from the previous ELM ΔtELM
for the same six 3.5 MA/3.3 T ITER-baseline pulses as analysed in section 2.8, showing: the pedestal top parameters Te,ped
, ne,ped
and pe,ped
(a)–(c); their normalised gradients  ,
,  and
and  averaged over the pedestal
  (d)–(f) and mantle regions
  (g)–(i); and the parameter
  averaged over the pedestal region (j) and the neo-classical convection parameter averaged over the pedestal
  (k) and mantle regions
  (l). The colours indicate the previous ELM type: natural ELMs in the gas fuelled pulses (
 ); natural ELMs (
 ) or pellet triggered ELMs (
 ) in pulses with pellet + gas fuelling.
Download figure:
Standard image High-resolution imageIn order to determine whether the ELM-pacing pellets have any statistically significant effect on the average values of the parameters ζNC and ηe over the pedestal and mantle regions, the data shown in figure 16 is plotted in figure 17 in the form of histograms, where the data is distinguished according to the preceding ELM type. Average values and standard deviations of the data (σdata ), also shown in figure 17, are stated in table 7.
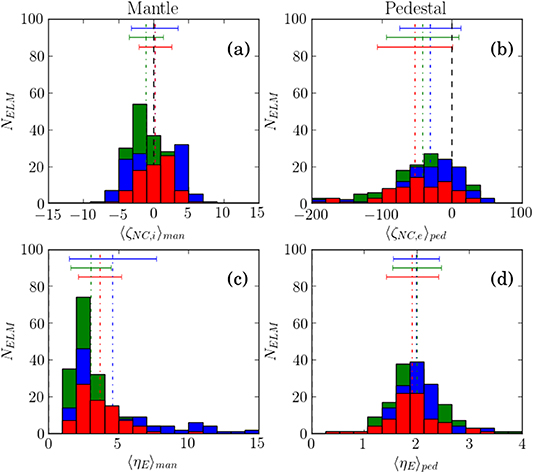
Figure 17. PDFs of the gradient parameters: ((a), (b)—top) ζNC
and ((c), (d)—bottom) ηe
shown in figure 16 for 3.5 MA ITER-baseline pulses, spatially-averaged over the mantle ((a), (c)—left) and density pedestal ((b), (d)—right) regions, where the data points have been selected by the ELM type preceding the HRTS measurement times: natural ELMs in the gas fuelled pulses ( ) and natural ELMs (
 ) or pellet triggered ELMs (
 ) in pulses with pellet + gas fuelling.
Download figure:
Standard image High-resolution imageTable 7. Average values of data shown in figure 17 by fuelling source and ELM type for high-power, 3.5 MA ITER-baseline pulses.
| Fuelling | ELM type | ζNC | ηe | ||
|---|---|---|---|---|---|
| — | — | Pedestal | Mantle | Pedestal | Mantle |
| Gas-only | Natural | −30 ± 4 | 0.16 ± 0.2 | 2.0 ± 0.4 | 4.5 ± 0.3 |
| Pel and Gas | −42 ± 4 | −1.1 ± 0.2 | 2.0 ± 0.4 | 3.1 ± 0.1 | |
| Pellet | −52 ± 6 | 0.24 ± 0.3 | 1.9 ± 0.6 | 3.7 ± 0.2 | |
| — | All | −40 ± 2 | 0.14 ± 0.2 | 2.0 ± 0.3 | 3.7 ± 0.2 |
Referring to the values of  in table 7, we see that on-average there is relatively strong inward impurity convection (
 –50)) across the pedestal during the inter-ELM periods. However, the time-resolved data shown in figure 16 shows that, during the first ∼10 ms after the pellet-triggered and natural ELMs in the pellet fuelled pulses (
 ,
,  ) there is some tendency for this convection to weaken (and sometimes even reverse) due to the relatively lower
  following these ELMs. There is hence some tendency for the pacing pellets to reduce the inward W influx just after the ELMs.
In the mantle region, the overall average value of  following all of the ELMs is much weaker than that prevailing in the pedestal region (
 –50)). On-average, there is a somewhat higher, positive value of
  following the pellet triggered ELMs due to the fuelling at the pedestal top by the pellets reducing
  . However, after the natural ELMs in the pellet fuelled pulses, there is a slightly negative average value of
  , driving inward impurity convection. This probably arises because of relatively low level of gas fuelling in the pellet fuelled pulses results in a slightly lower ne,ped
than in the gas fuelled pulses and hence a higher value of
, driving inward impurity convection. This probably arises because of relatively low level of gas fuelling in the pellet fuelled pulses results in a slightly lower ne,ped
than in the gas fuelled pulses and hence a higher value of  , which favours inward impurity convection. Hence, while the ELM pacing pellets do modify the pedestal gradients on-average such as to slightly increase the convection of W (and other impurities) across the pedestal, they also modify the mantle gradients to reduce the screening of these impurities from the plasma core.
Somewhat as an aside to the topic of this paper, the average values of ηe
in the pedestal and mantle regions are worthy of note. As was discussed in [8] with respect to the high-power, 3 MA ITER-baseline pulse #92 432, the value of ηe
averaged over the steep density gradient region ( ) of
) of  as stated in table 7 for the 3.5 MA pulses are similar to those that were found for pulse #92 432, which may indicate that there may be a degree of stiffness of the electron heat transport in the pedestal, predominantly due to the slab branch of ETG turbulence, which is destabilised at a critical
  . Note that, on-average, there is also an increase in
  during the first ∼10 ms following the ELMs, providing a stronger drive for turbulent electron heat transport at this time.
Turning our attention now to the mantle region ( ), the average value of
  –5 is larger than in the pedestal region, which may be consistent with the higher values of ηe
required to destabilise the toroidal branch of ETG turbulence at the relatively low values of
–5 is larger than in the pedestal region, which may be consistent with the higher values of ηe
required to destabilise the toroidal branch of ETG turbulence at the relatively low values of  –10 prevailing in the mantle compared to those in the pedestal region (
 ). For further discussion of this topic see section 4 of [8]).
3. Discussion
3.1. Proposed mechanism for the influence of W radiation on the evolution of high-power, ITER-baseline pulses in JET-ILW
As mentioned in the introduction, sustained H-mode operation of JET-ILW pulses requires fuelling by gas puffing to mitigate the detrimental effect of W impurities sputtered from the divertor targets, predominantly but not exclusively by the extremely high instantaneous powers deposited by the ELMs. The beneficial effect of the gas puffing on this process is illustrated systematically in figure 18.

Figure 18. Schematic representation of the effect of gas puffing on: (a) the ELM behaviour and W radiation and (b) the inter-ELM pedestal characteristics.
Download figure:
Standard image High-resolution imageAlthough the physics underlying each step is not always well understood, the underlying mechanism can be explained as follows:
- (a)Effect of increased gas fuelling on ELMs: More gas fuelling typically increases the ELM frequency fELM and reduces the ELM energy losses ΔWELM (at approximately constant
 ), resulting in a lower sputtered W source SW
from the divertor targets. A lower W concentration cW
in the SOL then reduces the impurity influx to the confined plasma between ELMs and the higher ELM frequency flushes more W out again . A lower W concentration in the confined plasma then reduces the radiated power , thereby increasing the rate of increase of stored energy dWpl
/dt between the ELMs. This causes pe,sep
to reach the MHD pressure limit faster, triggering the ELMs earlier and thereby increasing their frequency fELM
. The chain of causality of the effects of increased gas fuelling are illustrated in figure 18(a).
), resulting in a lower sputtered W source SW
from the divertor targets. A lower W concentration cW
in the SOL then reduces the impurity influx to the confined plasma between ELMs and the higher ELM frequency flushes more W out again . A lower W concentration in the confined plasma then reduces the radiated power , thereby increasing the rate of increase of stored energy dWpl
/dt between the ELMs. This causes pe,sep
to reach the MHD pressure limit faster, triggering the ELMs earlier and thereby increasing their frequency fELM
. The chain of causality of the effects of increased gas fuelling are illustrated in figure 18(a). - (b)Effect of increased gas fuelling on pedestal and confinement: Although the effect of the gas fuelling on the inter-ELM pedestal structure is beneficial in terms of further mitigating the W contamination, it also reduces the energy confinement by degrading the pedestal temperature, which reduces the temperature over the whole plasma due to stiffness of core heat transport. An increase in turbulent heat flux across the pedestal due to changes in its structure caused by the gas puffing is now well established as the most plausible explanation for the low pedestal temperature in JET-ILW pulses [10, 12, 14, 56, 57] and this is illustrated schematically in figure 18(b).Increased gas puffing raises the separatrix density ne,sep , which decreases the density gradient across the pedestal, increasing and hence ηi,e
across the ETB, providing a stronger drive for turbulent heat transport. With the residual power through the ETB determined by the heating power, radiation and ELM losses, an increase in the heat turbulent heat diffusivity χeff
must reduce the pedestal temperature Te,ped
.As a consequence of reducing Te,ped
, a higher pedestal density ne,ped
is required for pe,ped
to reach the peeling-ballooning limit at which ELMs are triggered. The lower Te,ped
and higher ne,ped
increases the effective collisionality at the pedestal top. This then reduces the density peaking , which is partly driven by a turbulent particle pinch, thereby reinforcing the higher ne,ped
[58].Conversely, less gas fuelling is required with the pellets, resulting in reduced ne,ped
and higher Te,ped
and lower νeff
, which favours density peaking. This is then further reinforced by the more peaked beam ionisation source resulting from the reduced ne,ped
, which is known to play an important role in peaking the density profile in JET-ILW [59].
- (c)Feedback loops between gas puffing, ELMs and W behaviour: As indicated in figure 18, there is coupling between the changes to the pedestal structure, the ELM behaviour and the W transport, which reinforce the effects of the gas puffing. Firstly, the higher reduces the magnitude of the inward convection ζNC
across the ETB, which reduces the W influx into the confined plasma. Secondly, the lower Te,ped
and higher ne,ped
reduces Te
at the W targets during the ELM crashes, decreasing the incident ion energies and hence the physical sputtering yield and thereby reducing the W source. Also, more gas puffing typically increases fELM
, flushing more impurities from the plasma
18
.


3.2. Understanding the evolution of pulse #92 432
We can try to use this insight into the effect of gas puffing on the pedestal and the W flushing by the ELMs to understand the evolution of the high-power, 3 MA baseline-scenario pulse #92 432, which was discussed in detail in section 2.6. A schematic representation of the causality of the underlying mechanisms is shown in figure 19. A breakdown of this mechanism follows:
- (a)Initially, the rate of gas fuelling was probably too low, causing a gradual buildup of the W content, increasing, decreasing dWpl
/dt and hence causing a reduction of the ELM frequency fELM
(see figure 10).
- (b)In response to the decrease in fELM , the plasma control system initiated an increase in the gas puffing rate, which had the opposite effect to that desired. More gas fuelling raised ne,ped
, consequently increasing , reducing dWpl
/dt and hence further reducing fELM
, eventually stopping the ELMs entirely.
- (c)Cessation of the ELMs caused ne,ped to rise faster, resulting in an even faster increase in mantle radiation, hence strongly reducing .
- (d)Once falls sufficiently, this triggers an H/L-transition, which rapidly reduces ne,ped
and increases in the mantle region.
- (e)The increased then causes sudden reversal of the neo-classical convection (), driving the W impurities into the plasma core, causing a reduction in Te,0, a collapse in Wpl
, ending the high-performance phase of the pulse.


Figure 19. Schematic representation of the factors affecting the evolution of the high-power baseline scenario JET-ILW pulse #92 432 at: (1) the initial phase and (2) after the feedback system increases the gas puffing rate  to try to control the W influx.
Download figure:
Standard image High-resolution imageNote that this particular pulse does in fact recover from the W accumulation event. The L-mode phase is followed by another period of ELMy H-mode, albeit with higher PRad and reduced energy confinement.
3.3. W impurity retention and redeposition in the divertor
The fraction of radiated power  is higher in the pellet + gas-fuelled pulse #96 713 compared to that in the gas-fuelled pulse #94 980, in spite of the fact that on-average, the level of inter-ELM Be influx
  from the target is comparatively lower (see figures 1(f) and (g)). Although the level of ELM-sputtered W from the targets is lower in in pulse #96 713, the W concentration in the mantle
  is higher than in pulse #94 980 (see figure 11(a)). This implies that the retention [60, 61] and/or prompt re-deposition [3] of the sputtered W in the divertor is less efficient in pulse #96 713, which has a lower (∼45%) gas fuelling rate than that in pulse #94 980.
The process of prompt redeposition of the sputtered W0 is due to singly ionized W+ ions being redeposited with their first Larmor orbit onto the target. This occurs because the Larmor radius  of the heavy (
 ) W+ ions can be larger than the ionization length L0
19
of the sputtered W0 atoms [3]. The fraction of ions redeposited to the target fdep
decreases with an increase of the ratio of ionisation length to the W+ Larmor radius
) W+ ions can be larger than the ionization length L0
19
of the sputtered W0 atoms [3]. The fraction of ions redeposited to the target fdep
decreases with an increase of the ratio of ionisation length to the W+ Larmor radius  according to
  [62]. This ratio p decreases with increasing density ne,t
and electron temperature Te,t
at the target. It is hence difficult to predict the effect of increasing the gas puffing on fdep
without complex modelling, e.g. with the kinetic impurity simulation code ERO [63], and knowledge of how ne,t
and Te,t
respond to the changes in fuelling.
[62]. This ratio p decreases with increasing density ne,t
and electron temperature Te,t
at the target. It is hence difficult to predict the effect of increasing the gas puffing on fdep
without complex modelling, e.g. with the kinetic impurity simulation code ERO [63], and knowledge of how ne,t
and Te,t
respond to the changes in fuelling.
The relatively higher ∼×1.5 concentration of W in the pellet + gas fuelled pulse #96 713 compared to that in the gas fuelled pulse #94 980 might also be a sign of reduced retention of the sputtered W in the divertor. Modelling the transport of W (ZW
= 74), which has many ionisation states, in the SOL plasma is computationally extremely complex. Some insight into the processes involved can be gleaned from inspection of the parallel force balance on the impurity ions, which is stated as equation (1) of [60]. The relevant terms (where I represents impurity ions) are: (1)  representing friction with other ion species; and (2)
  and
and  representing thermal forces due to the parallel temperature gradients of the ions and electrons. Here,
  are the average parallel flow speeds of the respective ions i/I,
  is the momentum exchange rate between ions and impurities and the αI,i/e
are coefficients for the ion/electron thermal forces.
is the momentum exchange rate between ions and impurities and the αI,i/e
are coefficients for the ion/electron thermal forces.
It might be expected that, with an increased gas fuelling rate ΓD2,gas
into the main chamber, that with the increased flow of D+ ions through the SOL to the divertor, the parallel friction force (1) might increase, thereby enhancing the retention of the W impurities in the divertor. A higher parallel temperature gradient in the SOL would, however, act to reduce the impurity retention by increasing the thermal forces (2), which are directed away from the target. Without detailed modelling with a SOL transport code, it is not easy to determine how  will change along the SOL in response to changes in the fuelling and how these changes will influence the impurity retention.
In conclusion, it may well be that increased W retention and also an increase in the prompt redeposition fraction with a higher ne,t at higher fuelling rate might explain the lower W concentration in pulse #94 980 cf that in pulse #96 713. Exhaustive modelling, e.g. with a SOL transport code such as SOLPS [64] or the latest ITER version SOLPS-ITER [65], is required to elucidate these effects further.
Finally, it is worth noting that, if there is a balance between the incident Be flux to the target and that sputtered during the inter-ELM periods, the comparatively lower intra-ELM Be influx in pulse #96 713 implies, a lower rate of Be sputtering by the ELMs from the main chamber walls, which are faced with Be tiles. The ELM-sputtered Be influx from the walls might be expected to decrease with a lower neutral gas density in the plasma-wall interspace, resulting from reduced gas puffing into the main chamber in pulses with pellet + gas fuelling.
4. Conclusions
ITER-baseline scenario pulses typically operate at a higher plasma current Ip
and consequently, lower  –2
20
and lower edge safety factor q95 ∼ 3, e.g. than hybrid-scenario pulses, which operate at lower Ip
and hence higher βN
∼ 2 − 3 and q95 ∼ 4. Because the pedestal density ne,ped
increases with Ip
[11], the higher
–2
20
and lower edge safety factor q95 ∼ 3, e.g. than hybrid-scenario pulses, which operate at lower Ip
and hence higher βN
∼ 2 − 3 and q95 ∼ 4. Because the pedestal density ne,ped
increases with Ip
[11], the higher  of baseline-scenario pulses results in a relatively higher ne,ped
and less peaked ne
profile (
of baseline-scenario pulses results in a relatively higher ne,ped
and less peaked ne
profile ( ) than in hybrid-scenario pulses with
  .
.
The high ne,ped
and low ne
peaking in baseline-scenario pulses has a fortuitous effect on the impurity transport and hence the radiation, which favours steady-state ELMy H-mode operation. The weak ne
gradient and hence low normalised gradient  across the core plasma compared to that of Ti
, typically results in outward neo-classical impurity convection
across the core plasma compared to that of Ti
, typically results in outward neo-classical impurity convection  and hence a hollow impurity density profile. This localises the strongly radiating W impurities to the mantle region, where they can be efficiently flushed from the confined plasma by the ELMs.
This strong W radiation from the mantle has a dominant effect on the electron power balance there and, without efficient flushing by the ELMs, this can reduce the power crossing the separatrix PSep , hence slowing and even stopping the ELMs altogether, which often causes a runaway radiation event, an H/L-transition and sudden impurity accumulation. This is one of the main causes of the higher disruptivity of high-power, H-mode pulses in JET-ILW [5].
Note that, because hybrid-scenario pulses are run at lower Ip
and higher βN
, these operate with a lower ne,ped
and hence more peaked ne
profile. Consequently, such pulses are more prone to core W accumulation and can often suffer from radiation collapse of the central electron temperature, leading to a disruption. In such pulses, which are characterised by a broad, elevated q profile with  , the W accumulation is usually triggered by low-n NTMs, which are destabilised at low-order rational surfaces, e.g.
  . The physics of this process has been investigated in detail in [16].
As mentioned earlier, it has recently been demonstrated that optimised gas fuelling during the initial current ramp phase, can result in a hot, low collisionality pedestal, which effectively screens out the high-Z impurities from the confined plasma [17]. Similar analysis of the ELM flushing in such optimised, high-performance hybrid-scenario pulses has shown that the behaviour of the W impurities is quite different to that observed in baseline pulses, i.e. the ELMs do not flush but instead allow W to enter the confined plasma, which is then removed during the inter-ELM periods by outward neo-classical convection [66].
This 'vicious circle', i.e. the strong mantle radiation slowing and thereby stopping the ELMs flushing out the W impurities, in baseline-scenario pulses as illustrated by the radiation 'event' in pulse #92 432 (see section 2.6), can be avoided by maintaining regular ELMs by the injection of small ELM-pacing pellets. The primary, beneficial effect of the ELM-pacing pellets, at a frequency fPel
∼ 25–45 Hz into such pulses, is to maintain a regular ELM frequency  , preventing the occurrence of ELM-free H*-phases longer in duration than
  –40 ms, which can lead to an H/L-transition and subsequent W accumulation or sometimes a disruption due to the strong radiation from the mantle.
A secondary, beneficial effect is that the use of the pacing pellets, which also fuel the plasma, allows operation with a reduced D2 puffing rate into the main chamber, e.g. in pulse #96 713 the 45 Hz pellets provide ∼60% of the total D2 fuelling rate. It is well established that an increased rate of gas fuelling is detrimental to the pedestal confinement and hence to the overall energy confinement, so the use of the pacing pellets allows the duration of the ELMy H-mode phase to be extended, while also maintaining good overall energy confinement.
The capability to run high-power plasmas with  , yielding a D-D neutron rate of
  (equivalent to a D-T fusion power PDT
∼ 15 MW) sustained for 5 s is one of the KPI for the JET-ILW C38 campaign, which is preparing for the forthcoming D-T campaign (DTE2). The evolution of the best performing, unseeded ITER-baseline scenario pulse #96 482 achieved so far with pellets + gas fuelling is shown in figure 20. This pulse achieved a maximum D-D neutron rate of
(equivalent to a D-T fusion power PDT
∼ 15 MW) sustained for 5 s is one of the KPI for the JET-ILW C38 campaign, which is preparing for the forthcoming D-T campaign (DTE2). The evolution of the best performing, unseeded ITER-baseline scenario pulse #96 482 achieved so far with pellets + gas fuelling is shown in figure 20. This pulse achieved a maximum D-D neutron rate of  , with an average over the 5 s period 8–13 s of
  21
.
21
.
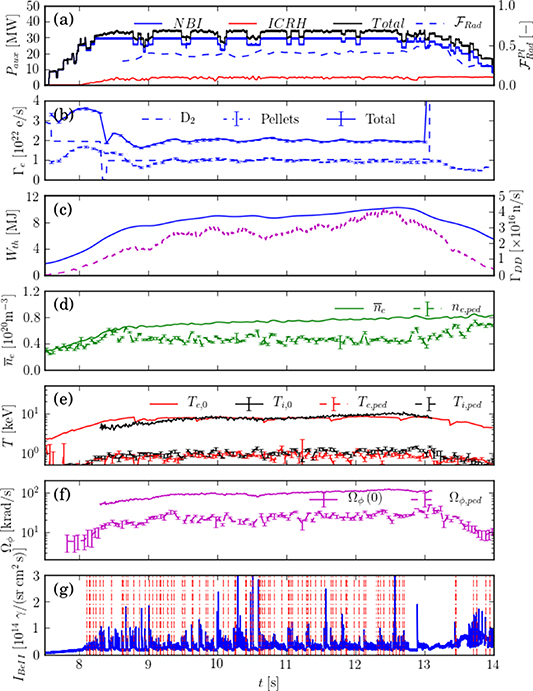
Figure 20. Evolution of high-performance 3.5 MA/3.3 T ITER-baseline scenario pulse #96 482 with the record averaged 'flat-top' D-D neutron rate for an unseeded pulse, showing: (a) total absorbed additional heating power Pabs
(solid) and radiated power fraction  (dashed); (b) D2 gas fuelling rate ΓD2,gas
(dashed), smoothed pellet fuelling rate ΓD2,pel
(dot-dashed) and total fuelling rate
(dashed); (b) D2 gas fuelling rate ΓD2,gas
(dashed), smoothed pellet fuelling rate ΓD2,pel
(dot-dashed) and total fuelling rate  (solid); (c) total MHD stored energy Wth
(solid) and H-mode confinement enhancement factor H98,y2 (dashed); (d) mid-plane, line-averaged density
(solid); (c) total MHD stored energy Wth
(solid) and H-mode confinement enhancement factor H98,y2 (dashed); (d) mid-plane, line-averaged density  (solid) and D-D neutron rate Γn,DD
(e/s) (dashed); (e) axial electron and ion temperatures Te,0 and Ti,0 (solid) and pedestal temperatures Te,ped
and Ti,ped
(dashed), (f) axial
(solid) and D-D neutron rate Γn,DD
(e/s) (dashed); (e) axial electron and ion temperatures Te,0 and Ti,0 (solid) and pedestal temperatures Te,ped
and Ti,ped
(dashed), (f) axial  and pedestal
  toroidal rotation rates, (g) the ELM behaviour from a visible Be II line viewing the outer divertor target.
Download figure:
Standard image High-resolution imageIt should be noted that record performance for an ITER-baseline scenario pulse in JET-ILW has been achieved so far using Ne impurity seeding in the 3 MA/2.8 T pulse #96 994 with 31 MW heating power [17]. With a Ne seeding rate of  and 45 Hz D2 ELM pacing pellets, this pulse achieved a confinement enhancement factor H98,y2 ∼ 1.1 and a D-D neutron yield of
  averaged over 5 s.
In such high-power, pellet + gas fuelled, ITER-baseline pulses, the improved energy confinement is mainly caused by a increase in the ion energy confinement in the plasma core, relative to that of the electrons, rather than increased pedestal energy confinement [23]. This has several causes: (1) decreased ne,ped
and hence increased ne
peaking, results in more central NBI power and torque deposition; (2) increased toroidal rotation rate  , and hence increased E × B flow shear across the core gradient region; (3) a higher
  ratio across the core plasma, which results in an increased fraction of beam heating of the ions and is also stabilising to ITG turbulence and hence reinforces turbulence suppression by the E × B flow shear. As well as these effects, in high-power JET-ILW pulses, the fast particle pressure pfp
can also play a role in stabilisation of ITG turbulence [67, 68].
ratio across the core plasma, which results in an increased fraction of beam heating of the ions and is also stabilising to ITG turbulence and hence reinforces turbulence suppression by the E × B flow shear. As well as these effects, in high-power JET-ILW pulses, the fast particle pressure pfp
can also play a role in stabilisation of ITG turbulence [67, 68].
A 'virtuous circle' due to synergy between the increase in core confinement and pedestal stability was suggested in [69]. The proposed mechanism is that a larger Shafranov shift due to higher βN
favours pedestal stability [64], thereby allowing a higher pe,ped
, which can then lead to an improvement of core confinement if the core heat transport is 'stiff'. Note, however, that the time-averaged pedestal energy  is not significantly higher in the pellet + gas fuelled pulse #96 713 compared to that in the gas fuelled pulse #94 980 investigated here. Also, the improved core confinement in #96 713 is likely due instead to decreased stiffness [70] of ion heat transport due to the relatively higher rotational E × B shear in pulse #96 713.
There are other, more subtle and mainly beneficial effects of the ELM-pacing pellets. The change in ELM characteristics to typically smaller amplitude, compound ELMs reduces time-averaged ELM-sputtered impurity influxes. There is also a temporary effect of the pellets on the pedestal gradients, decreasing the impurity convection across the pedestal and increasing their localisation to the mantle. However, the effect of the subsequent small, rapid ELMs on the mantle gradients is to reduce the efficacy of neo-classical impurity screening from the core.
Further pulses are to be run during the C38 campaign on JET-ILW at higher plasma current  , so it will be of interest to determine whether this increase results in an overall improvement in energy confinement. Whereas the ITER − H98P(y, 2) scaling predicts increased energy confinement (
 ), this may be offset by a broader NBI power deposition profile with the increased pedestal density expected at high plasma current [11]. Higher ne,ped
will increase the outward neo-classical convection of the W impurities, hollowing their density profile, and hence promote their flushing from the confined plasma by ELMs. However, the fact that the L/H-threshold power PLH
also increases with Bt
[52] makes baseline scenario pulses more difficult to control at higher plasma current.
), this may be offset by a broader NBI power deposition profile with the increased pedestal density expected at high plasma current [11]. Higher ne,ped
will increase the outward neo-classical convection of the W impurities, hollowing their density profile, and hence promote their flushing from the confined plasma by ELMs. However, the fact that the L/H-threshold power PLH
also increases with Bt
[52] makes baseline scenario pulses more difficult to control at higher plasma current.
A risk with relying on pellet injection to control the W impurity content by promoting frequent ELMs is that any 'missing' pellets due to malfunction of the injector or pellets shattering in the flight tube would result in longer ELM-free phases, risking the occurrence of a radiation induced disruption. This places high demand on the reliability of the pellet injectors on ITER or a future fusion reactor.
It should be noted that high-performance H-mode operation is possible in JET-ILW without any gas or pellet fuelling during the ELMy H-mode phase. A new regime with small, high-frequency ELMs and neo-classical impurity screening due to the high core Ti gradient allows such pulses to run without severe W accumulation [71].
Data availability statement
The data that support the findings of this study will be openly available following an embargo at the following URL/DOI: https://git.ccfe.ac.uk/afield. Data will be available from 30 November 2021.
Acknowledgments
This work has been carried out within the framework of the EUROfusion Consortium and has received funding from the EURATOM Research and Training Programme 2014–18 and 2019–20 under Grant Agreement No. 633053 and from RCUK Energy Programme (Grant No. EP/T012250/1). To obtain further information on the data and models underlying this paper please contact PublicationsManager@ukaea.uk. The views and opinions expressed herein do not necessarily reflect those of the European Commission.
Footnotes
- 12
The H-mode confinement enhancement factor H98,y2 is defined as the ratio of the thermal energy confinement time τE,th to the energy confinement time τE,98y2 from the ITER
energy confinement scaling [21], i.e. . - 13
The Greenwald density is defined as
, where Ip
is the plasma current in MA and a is the geometrical minor radius in m. - 14
- 15
The parameter cs /a, where cs is the sound speed and a the minor radius, is an estimate for the typical growth rate γlin of ion-scale turbulence [40].
- 16
Here, the notation H* is used to refer to ELM-free H-mode rather than ELMy H-mode.
- 17
As the ion temperature from the edge CXRS system typically does not exhibit a clear 'knee' at the pedestal, we do not fit the profile with an
function [32] as is done for the Te
profile but instead take the pedestal value of Ti
to be that at the top of the ne
pedestal. - 18
Stability analysis reveals that at high puffing rates, when the pedestal collisionality
is higher, the ELMs are triggered at well below the peeling-ballooning boundary and have more the character of resistive, type-III than type-I ELMs [10]. - 19
The ionisation length is defined as
, where S0 is the ionisation rate coefficient of the W0 atoms and v0 is their speed. - 20
The normalised plasma pressure (toroidal beta) is defined as
, where is the volume-averaged total plasma pressure. - 21
Over the 3 s period of pulse #96 482, 10–13 s,
.


