
Abstract
Objective. The EPHNOGRAM project aimed to develop a low-cost, low-power device for simultaneous electrocardiogram (ECG) and phonocardiogram (PCG) recording, with additional channels for environmental audio to enhance PCG through active noise cancellation. The objective was to study multimodal electro-mechanical activities of the heart, offering insights into the differences and synergies between these modalities during various cardiac activity levels. Approach. We developed and tested several hardware prototypes of a simultaneous ECG-PCG acquisition device. Using this technology, we collected simultaneous ECG and PCG data from 24 healthy adults during different physical activities, including resting, walking, running, and stationary biking, in an indoor fitness center. The data were annotated using a robust software that we developed for detecting ECG R-peaks and PCG S1 and S2 components, and overseen by a human expert. We also developed machine learning models using ECG-based, PCG-based, and joint ECG-PCG features, like R–R and S1–S2 intervals, to classify physical activities and analyze electro-mechanical dynamics. Main results. The results show a significant coupling between ECG and PCG components, especially during high-intensity exercise. Notable micro-variations in S2-based heart rate show differences in the heart's electrical and mechanical functions. The Lomb-Scargle periodogram and approximate entropy analyses confirm the higher volatility of S2-based heart rate compared to ECG-based heart rate. Correlation analysis shows stronger coupling between R–R and R-S1 intervals during high-intensity activities. Hybrid ECG-PCG features, like the R-S2 interval, were identified as more informative for physical activity classification through mRMR feature selection and SHAP value analysis. Significance. The EPHNOGRAM database, is available on PhysioNet. The database enhances our understanding of cardiac function, enabling future studies on the heart's mechanical and electrical interrelationships. The results of this study can contribute to improved cardiac condition diagnoses. Additionally, the designed hardware has the potential for integration into wearable devices and the development of multimodal stress test technologies.
Export citation and abstract BibTeX RIS

Original content from this work may be used under the terms of the Creative Commons Attribution 4.0 licence. Any further distribution of this work must maintain attribution to the author(s) and the title of the work, journal citation and DOI.
1. Introduction
Cardiac auscultation is the oldest method for cardiac function assessment. Even in the modern cardiac monitoring and imaging era, the technique is a fundamental clinical skill taught in the medical curricula worldwide, as a preliminary step for screening cardiac anomalies (Mangione 2001, Mendis et al 2011, Liu et al 2016). Despite its long history and significance, the visualization, analysis, and interpretation of heart sounds acquired by the phonocardiogram (PCG) is underutilized in clinical training. A 2021 study showed that using PCGs as visual aids alongside audio cases can significantly improve the proficiency of first-year medical students in cardiac auscultation (Watsjold et al 2021). The study found that students who trained with both audio and visual representations had better diagnostic accuracy and were more adept at identifying heart sound features compared to those who trained with audio alone. Nonetheless, algorithmic PCG-based diagnosis is less established than its electrical counterpart—the electrocardiogram (ECG). With recent developments in mobile health and telemonitoring, the PCG and ECG are once more receiving increasing interest as low-cost complementary modalities for monitoring the mechanical and electrical functions of the heart (Liu et al 2016, Oliveira et al 2022aa, 2022bb). The research in this domain mostly acquire ECG and PCG in different sessions, or one after the other, which although useful for identifying persistent cardiac anomalies, they do not provide a beat-wise insight into the two cardiac modalities and the inter-relationships between the electro-mechanical functions of the heart.
In recent years, multimodal cardiac monitoring has received significant interest. Seismocardiogram (SCG) has been used to estimate the heart rate (Chan et al 2022b), stroke volume (Ganti et al 2022), respiratory rate (Chan et al 2022a), tidal volume (Soliman et al 2022) and changes in intracardiac hemodynamics (Shandhi et al 2022). Li et al have studied transfer learning from ECG to photoplethysmogram for sleep staging (Li et al 2021). Nemati et al used multimodality for respiratory rate estimation from multiple time-series including the ECG (Nemati et al 2010). Sheikh et al developed a data-driven approach for automatic detection of aortic valve opening from impedance cardiography (ICG) data (Sheikh et al 2022). Dia et al used ECG R-peaks as reference for denoising synchronously recorded PCG data (Dia et al 2018). Previous research on multimodal cardiac monitoring have addressed the technological barriers and demonstrated the feasibility of multimodal cardiac monitoring (Kimball et al 2023). They have also evaluated limited biomarkers extracted from these novel technologies versus a reference modality (commonly the ECG). Luo et al studied the association between phonocardiography and echocardiography in heart failure patients (Luo et al 2022). The study reveals that PCG features, such as heart sound frequencies and the presence of the fourth heart sound (S4), are closely associated with echocardiographic indicators of diastolic dysfunction in heart failure patients with preserved ejection fraction (HFpEF). Specifically, higher heart sound frequencies and more frequent S4 occurrences correlate with elevated ratios between early mitral inflow velocity and early diastolic mitral annular velocity, suggesting that PCG could provide a non-invasive and convenient method for evaluating HFpEF, with diagnostic capabilities comparable to those of N-terminal pro-brain natriuretic peptide (NT-proBNP), underscoring the potential of PCG in HFpEF patient monitoring and management. A simultaneous ECG (15–30 s) was recorded with the PCG to enable the accurate detection of the S1 and S2 sounds.
Most recently, a commercial device (Eko DUO ECG + Digital Stethoscope, Eko Devices Inc., USA, 2023) and a research-focused prototype (Monteiro and Silva 2023) have been developed for simultaneous ECG and PCG acquisition, demonstrating the trend and need for multimodal cardiac monitoring. However, to date, the data acquired by multimodal sensors have not yet been integrated together for multimodal analysis to benefit from both the common and exclusive features of the different modalities, as complementary modalities.
The electro-phono-cardiogram (EPHNOGRAM) project aimed at addressing this unmet need, by developing 'EPCG'—a portable low-power device for recording simultaneous ECG and PCG (Kazemnejad 2018). We used a research prototype of this device to collect a dataset consisting of simultaneous ECG and PCG of a group of healthy adults in a stress-test study. The developed hardware has various features including auxiliary channels for capturing environmental audio noise, which could be used for PCG quality enhancement through signal processing. The dataset is provided online on PhysioNet (Kazemnejad et al 2021), and the source codes for reading and analyzing the data are available in the Open-Source Electrophysiological Toolbox (OSET) (Sameni 2018). We provide sample processing and physical activity classification results to demonstrate the mutual and distinct information within both modalities. We also demonstrate the coupling between ECG-based and PCG-based features during different activities, which can be used in future research to study the electromechanical coupling of the heart.
In section 2, the architecture of the designed system is described. The stress-test dataset and its acquisition protocol are detailed in section 3. As proof of concept for the potential outcomes of this study, some of the basic analyzes and classification of physical activities from this dataset are presented in section 4. We have developed a robust algorithm for calculating the heart rate (HR) from the ECG and PCG. In the sample results, we demonstrate that, while the overall trend of the HR time-series obtained from both modalities is identical, there are minor differences and couplings between them, reflecting the differences and synergies between the mechanical and electrical systems of the heart during physical activities. The results show that the variations between the two HRs are not random but rather reflect the 'micro-dynamics' between the mechanical and electrical systems of the heart. The paper concludes with a discussion and future perspectives for simultaneous multimodal cardiac monitoring in section 7.
2. The EPCG device
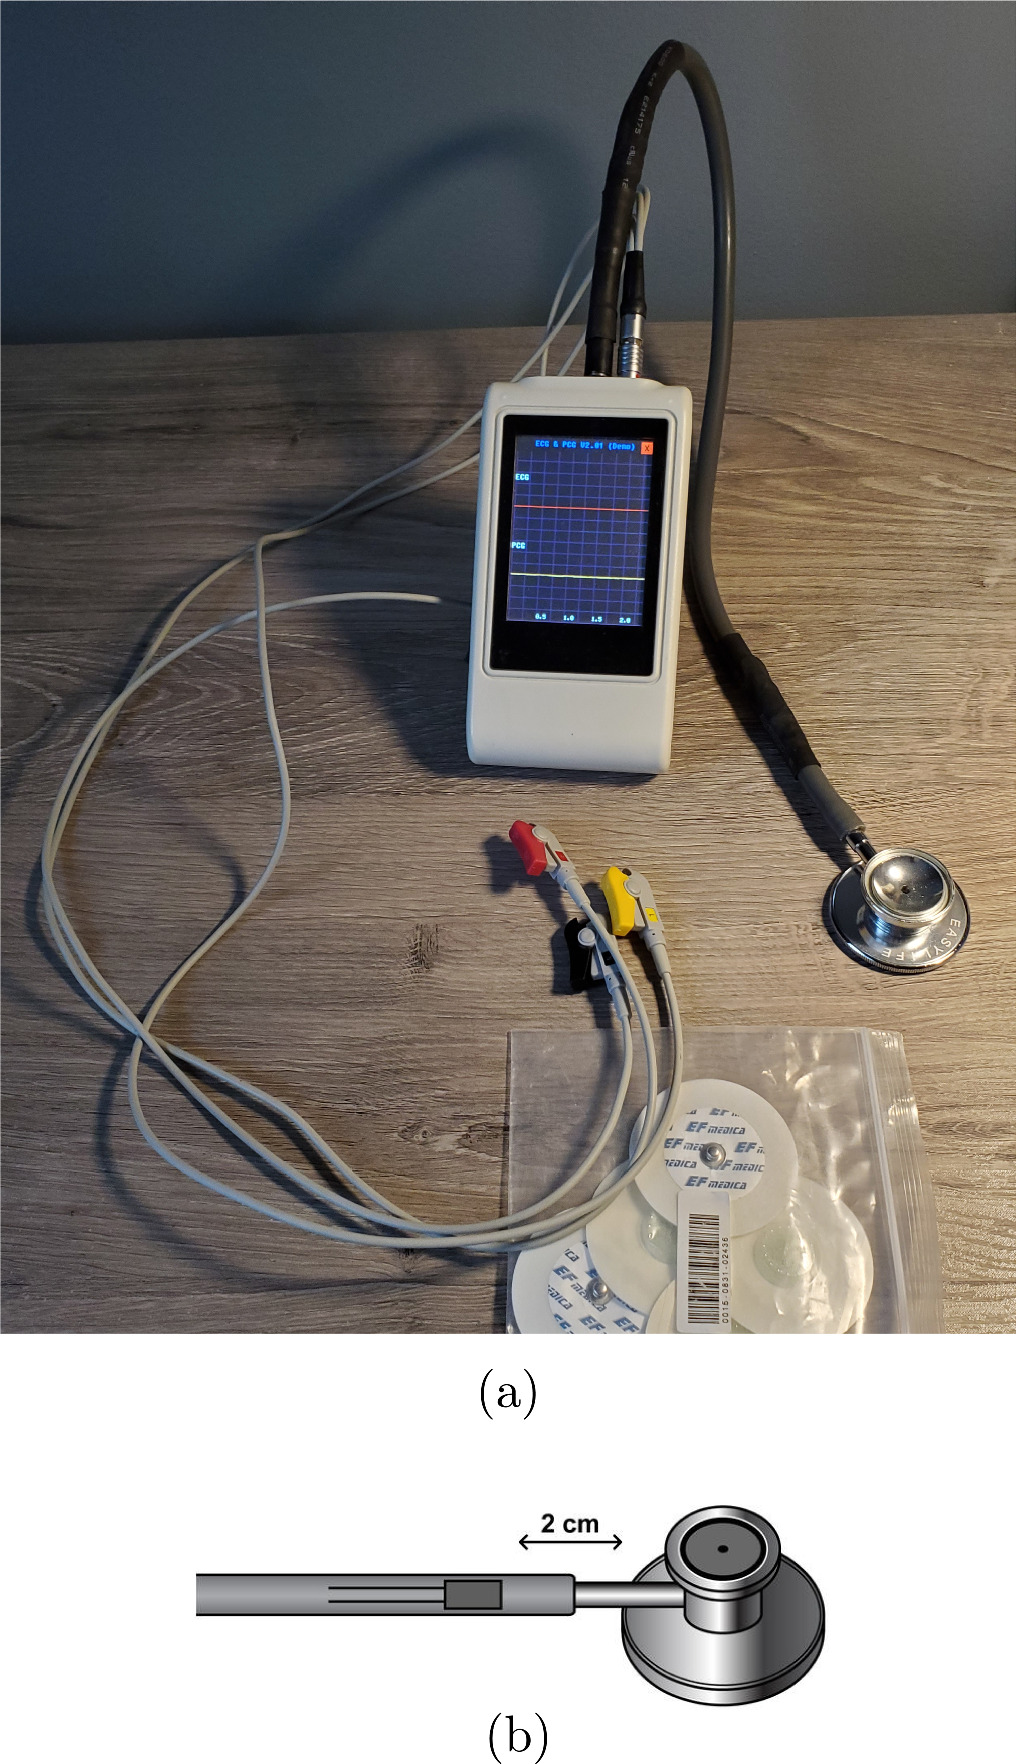
The commercialized version of the EPCG device designed as part of the EPHNOGRAM project is shown in figure 1(a). The device includes circuitry for single-channel (three-lead) ECG, two digital stethoscope channels for PCG acquisition, and two auxiliary channels to capture ambient audio noise. The auxiliary channels are used for digital active noise cancellation (ANC) from the primary PCG channels. The analog signals are filtered by an anti-aliasing analog filter and sampled at 8 kHz with a resolution of 12 bits (with 10.5 effective number of bits) and transferred to an on-board low-power microcontroller for minimal preprocessing and registration on a Secure Digital (SD) memory.

Figure 1. (a) The EPCG version 2.2 device, Vala-Andisheh Paya Ltd.; (b) a schematic of the designed stethoscope with a microphone embedded in the tubing close to the stethoscope head.
Download figure:
Standard image High-resolution imageThe device has an LCD and a keypad for basic file naming and controlling the recording duration by the user. Since the quality of the ECG highly depends on the connection of the chest leads, the device provides an online PC-based signal preview feature via Bluetooth, to prevent low-quality signal recordings due to poor body contact.
The analog front-end anti-aliasing and baseline wander rejection filter consists of a first-order passive high-pass filter with a –3 dB cutoff frequency of 0.1 Hz, followed by a fifth-order active low-pass Butterworth filter. The low-pass and high-pass cascaded filters form a bandpass filter that covers the major ECG and PCG spectral bands. For the ECG front-end circuitry, the upper –3 dB cutoff frequency is set to 150 Hz, with 30 dB of attenuation at 1 kHz and a 30 dB gain in the passband 4 . In PCG channels have the same active filter topology, but with an upper cutoff frequency of 1 kHz, 30 dB of attenuation at 5 kHz, and a passband gain of 5 dB. With this configuration, the ECG and PCG channel filter attenuations are respectively 90 dB and 25 dB at the Nyquist frequency of the digital front-end ADCs (4 kHz), which are practically sufficient to avoid aliasing. Note that although the front-end filters are generally nonlinear phase, their group delays are constant over the passbands of the front-end filters, ensuring that the ECG and PCG frequency components will not undergo notable phase distortions. Additional filtering, including powerline cancellation (50 Hz for the current dataset) is performed in the digital domain in our software pipeline. The ECG and PCG channels' filter responses are shown in figure 2.

Figure 2. Magnitude response of the ECG (a) and PCG (b) channel front-end filters.
Download figure:
Standard image High-resolution imageDuring the prototyping phase, various configurations of the hardware and several hand-made stethoscopes were developed and tested. The hardware design version 2.2 (licensed to Vala-Andisheh Paya, Ltd.) was the latest of several progressive improved redesigns, in which the auxiliary channels were added for software-based digital active noise cancellation, and the signal quality was significantly improved through the redesign of the analog front-end to minimize electromagnetic interference. The optimizations included the isolation of the analog and digital circuitry, using distinct common-ground filters for the analog and digital power circuitry, and printed circuit board (PCB) shielding and design optimization.
For the stethoscopes, since the primary target market was low- and middle-income countries (LMICs), the objective was to convert low-price off-the-shelf stethoscopes into high-quality digital ones with minimal engineering and fabrication effort, and emphasizing on software-based improvements, through advanced signal processing on the digital side. The different stethoscope designs that were prototyped and tested from versions 0.1–2.2 include: (1) embedding microphones inside standard stethoscope chest pieces, located directly under the stethoscope diaphragm; (2) embedding two microphones inside a standard microphone chest-piece, positioned back-to-back, one facing the diaphragm, the other one facing the bell hole; (3) embedding microphones by the end of the tubing, at the junction of the ear tubes; (4) embedding microphones inside the tube, approximately 2 cm after the stethoscope stem, in addition to auxiliary microphones embedded inside the mobile device case to record environmental audio interferences. Approaches 1, 2, and 3 captured high-amplitude PCG, but they also had caveats. It was noticed that embedding the microphones inside the mechanical parts of stethoscopes impacts the acoustic frequency response of the stethoscope. This resulted in a notable change in the acoustic signal quality, impacting the intelligibility and interpretation of the audio sounds. To note, computerized cardiac auscultation is much less established than electrocardiography. Therefore, it is important to maintain the PCG sounds similar to the descriptive characteristics of the PCG that physicians are more familiar with.
Overall, the fourth configuration (embedding microphones inside the tube, demonstrated in figure 1(b)), was found to be the most robust of all and resulted in high-quality sounds, with the following advantages:
- (i)Arbitrary stethoscope diaphragms can be used with this device and modifications are only applied to the tubing section.
- (ii)The acoustic frequency response of the mechanical parts of the chest-piece (diaphragm and bell) is not altered. In fact, the chest-piece is the most sophisticated piece of a stethoscope, in terms of its frequency response and the impact of its shape on the quality and intelligibility of the PCG. By embedding the microphone inside the tube (after the stem), the frequency response of the PCG undergoes minimal change, compared to what clinicians hear with a classical stethoscope.
- (iii)Along the stethoscope tube, the transfer function of the audio channel is approximately linear, mainly lowpass filter and attenuating the sounds. Therefore, the audio quality is less susceptible to the exact position of the microphone within an order of millimeters inside the tube, which is an important factor for mass production of the device in LMICs and other low-resourced areas. or adaptation based on commercial stethoscopes available in the market.
- (iv)
The various versions of the customized stethoscope were built, using capacitive, piezoelectric, and micro-electro-mechanical systems (MEMS) microphones. The gathered dataset introduced in this work was acquired by the capacitive microphone version of the stethoscope in combination with EPCG v2.2 hardware.
3. The dataset
The acquisition of signals with the developed device was approved by the Biomedical Engineering Review Committee (IRB equivalent) of Shiraz University School of Electrical and Computer Engineering. A total number of twenty-four male subjects aged between 23 and 29 (average: 25.4 ± 1.9 years) volunteered for this research. The individuals gave informed consent to participate in the study.
The gathered dataset consists of 68 simultaneous ECG and PCG recordings, each with a duration of 30 s (8 recordings) and 30 min (60 recordings) acquired simultaneously from a single-channel (three-lead) ECG and a single PCG stethoscope. Each volunteer performed a specific physical activity once, as detailed in section 3.1. In a few cases where the data quality was poor (due to electrode/stethoscope detachment and analog front-end saturation), the test was repeated to obtain acceptable data. However, even the poor-quality samples have been included in the provided dataset for noise research purposes and labeled as low quality in the spreadsheet accompanying the dataset. In addition to the main PCG channel, for some subjects the auxiliary audio channels PCG2, AUX1, and AUX2 were recorded for audio processing research purposes; although these auxiliary channels are mostly at quantization noise level for the majority of the recorded sessions.
Cardiac auscultation is commonly performed in four major chest areas (Dornbush S 2019). The Mitral valve (M) sound is heard better at the distal end of the heart, anatomically landmarked between the fifth and sixth ribs on the body surface. The Tricuspid valve (T) sound is heard well on the left side of the heart, between the fourth and sixth ribs (Liu et al 2016, Oliveira et al 2022aa). Therefore, we choose the location between the Tricuspid and Mitral landmarks to record the heart sounds to obtain both the first and second heart sounds with a good quality. The placement of the PCG stethoscope and the three ECG electrodes are shown in figure 3. The left chest/arm (LA) and right chest/arm (RA) leads are recorded differentially in reference to the lower right rib (or right leg: RL). The ECG is recorded as LA-RA, which is approximately equivalent to the standard lead I ECG.

Figure 3. ECG lead configuration and PCG stethoscope position for the dataset.
Download figure:
Standard image High-resolution image3.1. Acquisition protocol
The 30 s records were recorded during the development phase of the device as the participants were seated in an armchair during their acquisition.
The 30 min recordings (60 recordings) were acquired in an indoor sports center. A structured interview was conducted to confirm that the participants were in good physical condition and none reported symptoms of autonomic or cardiovascular disorder. In preparation for the experiment, volunteers refrained from consuming food, caffeine, alcohol, or smoking for three hours prior to the test. But they were permitted to drink water regularly. Each subject participated in one or a number of the following physical scenarios:
- (i)Scenario A—rest condition: the participant laid horizontally on a bed in a quiet room while the ECG and PCG were recorded for 30 min. A few short samples (30 s) have also been recorded from participants sitting in an armchair.
- (ii)Scenario B—walking condition: the participant walked on a treadmill at a constant speed of 3.7 km h−1 at an incline grade of 1%, where incline grade is:The process lasted 30 min at constant speed and incline grade.

- (iii)Scenario C—treadmill stress-test: the modified Bruce protocol was used for the treadmill stress-test (Bruce 1971), as shown in table 1. Our modified stress-test starts at a lower workload as compared to the standard test. Each session lasted 30 min and the increase in speed and treadmill incline grade continued until the subjects reached excessive fatigue, excessive heart rate, or chest pain. Whenever the subject reached this extreme point (subject-dependent), in order to avoid a sudden decrease in the heart rate, the speed was gradually decreased to 3 km h−1, and the incline grade was decreased to a horizontal position. After a few min of walking in this state, the participant stopped and sat in a chair until the end of the test. The signals were acquired up to the end of the acquisition session.
- (iv)Scenario D—bicycle stress-test: the bicycle stress-test protocol is detailed in table 2. Each test lasted 30 min. The participant first rested for 2 min on a stationary exercise bicycle without pedaling, then started pedaling at a workload of 25 Watts min−1. At the beginning of the test, according to table 2, the external load was gradually increased, and the subject was asked to match the power consumption to the power specified in the standard test. It is practically infeasible to pedal at a constant speed (at least for non-athletes). Therefore, the power consumption is only an approximation of the target power consumption. The participant continueed the test until reaching excessive fatigue, excessive heart rate, or chest pain. At this point, the external load level was gradually decreased to 25 Watts min−1 to avoid a sudden decrease in the heart rate. The subject remained in this state for several min, and then stopped and rested on the stationary bicycle until the end of the test session, while the signals were continuously recorded by the EPCG device.

Table 1. Modified Bruce treadmill stress-test protocol
| Stage | Speed (km h−1) | Incline grade (%) | Duration (min) |
|---|---|---|---|
| 0 | 2.7 | 0 | 3 |
| 0.5 | 2.7 | 5 | 3 |
| 1 | 2.7 | 10 | 3 |
| 2 | 4.0 | 12 | 3 |
| 3 | 5.4 | 14 | 3 |
| 4 | 6.7 | 16 | 3 |
| 5 | 8.0 | 18 | 3 |
| 6 | 8.8 | 20 | 3 |
| 7 | 9.6 | 22 | 3 |
Table 2. Bicycle exercise stress-test protocol.
| Stage | Power consumption (Watts min−1) | Duration (min) |
|---|---|---|
| 0 | 0 | 2 |
| 1 | 25 | 2 |
| 2 | 50 | 2 |
| 3 | 75 | 2 |
| 4 | 100 | 2 |
| 5 | 125 | 2 |
| 6 | 150 | 3 |
| 7 | 175 | 2 |
| 8 | 200 | 2 |
| 9 | 225 | 2 |
| 10 | 250 | 2 |
| 11 | 275 | 2 |
| 12 | 300 | 2 |
In total, ten subjects participated in the first scenario. Five of the participants of the first scenario did not attend the rest of the stages. With the addition of six new volunteers, a total number of eleven subjects contributed in each of the three other scenarios. Two volunteers failed the test due to physical fatigue in the bicycle exercise stress test (Scenario D).
3.2. Data files on PhysioNet
The EPHNOGRAM database is available online on PhysioNet (Kazemnejad et al 2021). The data files are provided in both MATLAB (ECGPCG00XY.mat where XY = 01, ..., 68) and WFDB (ECGPCG00XY.dat and ECGPCG00XY.hea) formats, with identical base names. The MATLAB files are in double-precision floating point format. Each file was converted into 16 bit WFDB format by using the mat2wfdb.m function from the WFDB Toolbox (Silva and Moody 2014, Moody et al 2022). The accuracy of conversion between MATLAB and WFDB formats was assessed per file and per channel, by comparing the signal-to-noise ratio (SNR) of the original double-precision floating-point MATLAB files versus the WFDB files read by the rdsamp function of WFDB. All 16 bit WFDB files had an SNR of above 60 dB per channel, as compared to the original MATLAB files. Although 60 dB is fully acceptable for most applications, researchers seeking double-precision floating-point accuracy may use the MATLAB files for higher precision.
The description of the corresponding physical activities and the unique IDs of the participants are listed in the spreadsheet ECGPCGSpreadsheet.csv, provided in the database. For basic heart rate extraction and analysis from the ECG and PCG channels a sample MATLAB script TestHeartRateCalculation.m is also provided online. Additional source codes for analyzing this data are available in the OSET (Sameni 2018).
4. ECG and PCG processing
The EPHNOGRAM database can be used to analyze ECG and PCG characteristics under physical activities. As proof of concept, we investigate interactions and variabilities across the ECG and PCG-based biomarkers (like the heart rate and fiducial points) during different levels of physical workloads. The hypothesis is that while the heart rate time-series obtained from the ECG and the PCG are coarsely identical, there are 'micro-deviations' between the two time-series, that appear in the fiducial points of the ECG and PCG beats. Hypothetically, disregarding the methodological differences of algorithms used for heart rate calculation from the ECG and PCG time-series (due to the difference in their time and frequency domain specifications), the micro-deviations between the two time-series reflect the interactions between the electrical and mechanical functions of the heart. These minor deviations are not random and vary from case to case and under different physical workloads. In order to assess this hypothesis, the signal processing steps shown in figure 4 were applied to the ECG and PCG channels. The outputs of the processing scheme of were the heart rate time-series from both ECG and PCG and the beat-wise annotations of both time-series. Each stage of the processing units is detailed below.

Figure 4. Signal processing block diagram for heart rate calculation from ECG and PCG signals.
Download figure:
Standard image High-resolution image4.1. Preprocessing
For the ECG channels, a cascade of a moving median filter of length 0.6 s, and a moving average filter of length 0.3 s are used to remove the baseline wander. This combination has been shown to be very effective and robust for ECG baseline wander removal (Sameni et al 2008, Jamshidian-Tehrani and Sameni 2018). As an acoustic signal, the PCG does not physically have a baseline drift, and any non-zero average is associated with electronic circuitry and may be safely removed with a DC blocker, without interfering with the PCG contents. However, to keep the ECG and PCG synchronous, the delay of the two-stage baseline wander filter in the ECG signal path (which is half the total window lengths, or 0.45 s) was added to the PCG signal path, by zero-padding the beginning of the PCG signals during preprocessing 5 .
Since the data have been acquired indoors, the power-line noise (50 Hz in this dataset) was inevitable and appeared in variable amplitude throughout the 30 min acquisition sessions, in some cases appearing as short burst noises. In the current study, a fixed second-order IIR notch filter was used to suppress the power-line noise. For more elaborate studies involving ECG morphology analysis, more advanced notch filters such as adaptive Kalman notch filters can be used (Sameni 2012), which adjust the notch filter's quality factor (Q-factor) over time based on the level of power-line interference. This adaptive approach is particularly beneficial for addressing varying levels of power-line interference across different recordings, ensuring more effective noise cancellation. The source code for the Kalman notch filter is online and available in OSET (Sameni 2018).
4.2. ECG R-peak detection
We used an ECG R-peak detector inspired by the Pan-Tompkins algorithm (Pan and Tompkins 1985). Accordingly, a bandpass FIR filter with a passband between 10 and 40 Hz was applied to the ECG. The filtered signal amplitude was next saturated by a hyperbolic tangent function:  , with α set to be k times the standard deviation of bandpass filtered signal (k = 10, for the later reported results). The saturation ensures that short-term burst/spike noises do not impact the subsequent peak detection and thresholding steps of the algorithm. Next, the filtered signal's power envelope was calculated over a sliding window of length 75 ms. Finally, the R-peaks were obtained by local peak detection of the power envelopes over windows of 0.5 s. Finally, we built a graphical tool using MATLAB's Signal Labeler app to visualize and tweak the automatically detected R-peaks. A biomedical engineer specializing in ECG analysis used this tool for beat-by-beat review of all the automatically detected R-peaks, making corrections to any missed or inaccurately detected R-peaks. The human overseen and corrected R-peak indexes are also provided the EPHNOGRAM database.
4.3. Detection of PCG components using ECG R-peak
PCG-based beat detection and annotation is more challenging and less-established than ECG annotation. One of the advantages of simultaneous ECG-PCG acquisition and processing is that the ECG-based R-peaks can be used as references for beat detection and segmentation of the PCG components (S1, S2, etc), which are otherwise not trivial to detect. For this study, the ECG R-peaks were first estimated from the ECG and used as initial reference points for estimating the S1 and S2 segments of the PCG, from the PCG power envelope as detailed below.
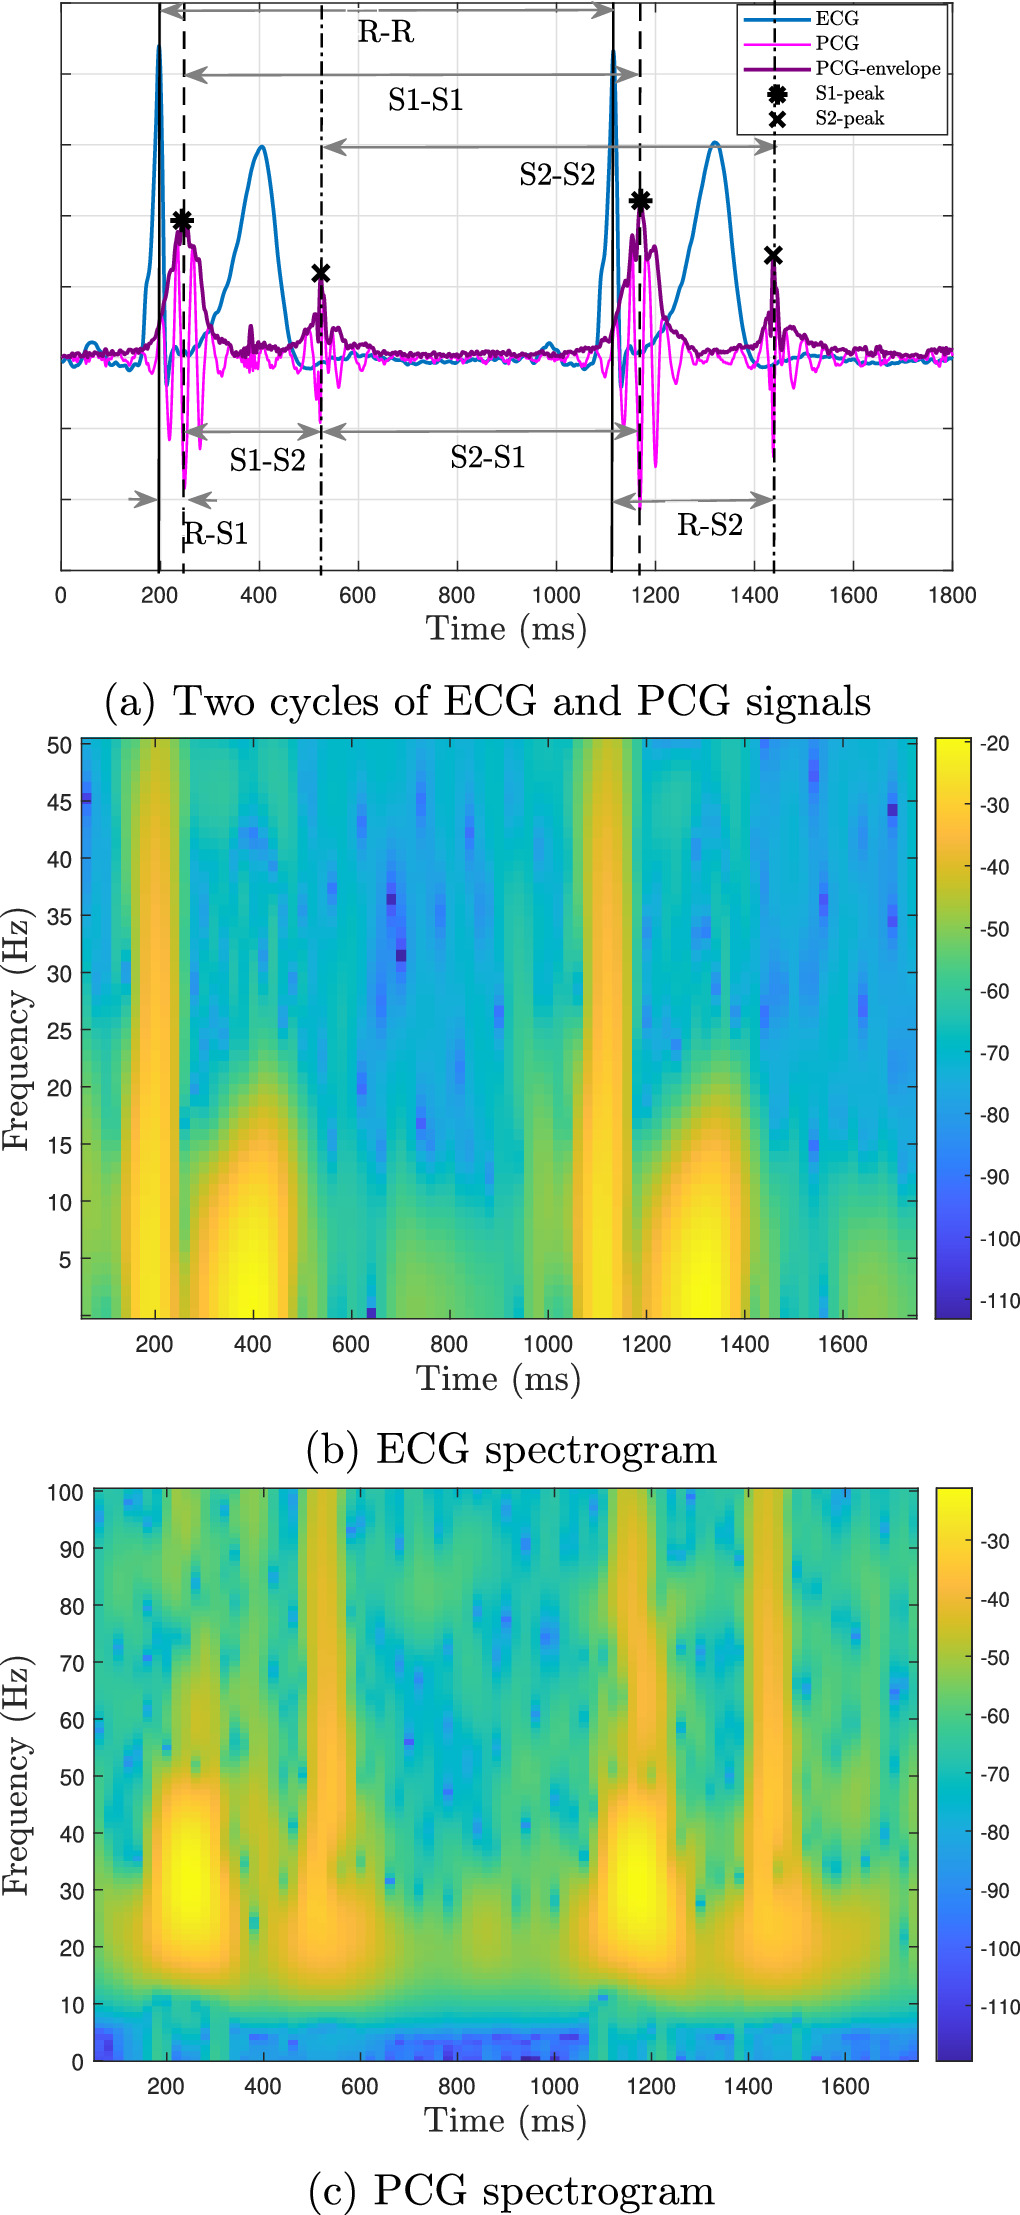
Typical simultaneous ECG and PCG records from the dataset are shown in figure 5(a). The first and second heart sounds in the PCG, respectively, S1 and S2 components, occur between successive R-peaks. From figure 5(a) that the S1 component is a PCG peak after the R-peak, and the S2 component is a PCG peak after the ECG T-wave, which matches the electrophysiology of the heart. In order to accurately delineate the S1 and S2 waves, we employed wavedet_3D—a wavelet-based algorithm that estimates the ECG fiducial points, like the peaks, onsets and offsets of the key ECG components, including the T-waves (Martínez et al 2004). The function is available online in the open-source ECG-KIT (Llamedo et al 2016). To note, wavedet_3D accepts pre-detected R-peaks as input, or internally detects the R-peaks if they are not provided. For robustness and consistency, we provided the function with the pre-calculated R-peaks that were human overseen by an expert, as detailed in section 4.2.

Figure 5. Matching two cycles of ECG, PCG signal and PCG envelop (PCG containing the S1 and S2 components) and their spectrograms from record ECGPCG0011.
Download figure:
Standard image High-resolution imageIn order to make the S1 and S2 components more prominent and easier to detect, the PCG was filtered with an FIR bandpass with a 20–200 Hz passband, which aligns with the literature that the dominant frequency components of the PCG are below 200 Hz (Mubarak et al 2018). This property was also confirmed through a visual inspection of the spectrograms of our PCG data. After applying this filter, the S1 and S2 components of the PCG manifest as bumpy shapes modulated over narrow-band oscillatory waves. Therefore, unlike the ECG, the local peaks of the PCG are not reliable indicators of the PCG component positions. Instead, we used the Hilbert transform envelope to facilitate the detection of the S1 and S2 components. A typical example of a simultaneous ECG and PCG records and their corresponding spectrograms are shown in figure 5(a). The S1 peak was next detected as the dominant PCG power envelope peak between the corresponding ECG beat's R- and T-wave peaks. Similarly, the S2 peak was identified as the dominant peak of the PCG envelope between the corresponding T-peak and the following R-peak. Similar to the R-peaks, all the detected S1 and S2 components of the PCG were overseen by a human annotator using the Signal Labeler app.
5. Results
The developed signal processing pipeline generates three sets of beat-wise annotations: the R-peak indexes, S1-peak indexes, and S2-peak indexes, as illustrated in figure 4. Having the R-peaks from the ECG and the S1 and S2 peaks of the PCG, the following time intervals are calculated per beat: (1) R–R: from one R-peak to the next R-peak, (2) S1–S1: from one S1-peak to the next S1-peak, (3) S2–S2: from one S2-peak to the next S2-peak, (4) S1–S2: from one S1-peak to the S2-peak of the same beat (systolic time interval), (5) S2–S1: from one S2-peak to the S1-peak of the next beat (diastolic time interval), (6) R-S1: from one R-peak to the S1-peak of the same beat, (7) R-S2: from one R-peak to the S2-peak of the same beat. These intervals are illustrated in figure 5(a). Accordingly, the first five are single-modality characteristics and the last two are multimodal. The R–R interval is used for ECG-based heart rate (HR) measurement. In contrast, S1–S1 and S2–S2 intervals are indicators for PCG-based HR estimation. The R-S1 and R-S2 reflect the electromechanical coupling of the heart.
In the sequel, we use these features to investigate some of the interesting interactions between the ECG and PCG-based components of the heart and the significance of each feature, during physical activities at different levels of workload.
5.1. ECG versus PCG heart rate parameters
Sample time-series of ECG and PCG-based time intervals are shown in figure 6, for one of the stationary biking tests and one of the treadmill stress tests of the dataset. The left vertical axis in this figure represents the time intervals in milliseconds (ms), and the right vertical axis indicates the equivalent heart rates in beats per minute (bpm). The background shades represent different levels of workload. As expected, the ECG-based, S1-based, and S2-based heart rates have similar trends, with their time-series graphs being superimposed. Upon zooming on the time-series of pedaling on a stationary bicycle in figure 7, it becomes apparent that S2-based heart rate has stronger high-frequency components and randomness compared to ECG-based and S1-based heart rates.

Figure 6. ECG and PCG-based event time intervals (a) pedaling on a stationary bicycle for record ECGPCG0001; (b) at Bruce treadmill stress test for record ECGPCG0038. Low-intensity activity: yellow; high-intensity activity: red; slowing down: purple; rest: green. Note that the S1-based heart rate is obscured by the S2-based heart rate. Refer to figure 7 for a zoomed-in version showing the intricate differences.
Download figure:
Standard image High-resolution image
Figure 7. Zooming in on the time-series in figure 6(a) to compare S2-based HR with ECG-based HR and S1-based HR.
Download figure:
Standard image High-resolution imageIn figure 6, we also see that during low-intensity workloads and rest periods, the heart rate exhibits more variability compared to the high-intensity exercise period. Another interesting observation is that heart rate variability (HRV) is more prominent in the S2–S1 (diastolic) interval as compared with the S1–S2, R-S1, or R-S2 intervals. According to figure 6, among the intra-beat intervals S1–S2, S2–S1, R-S1, and R-S2, the R-S1 interval exhibits the least variability during exercise, while the S2–S1 interval demonstrates the most variability. This suggests that the diastolic period, derived from the mechanical behavior of the heart, is the primary parameter that adjusts to the variations in the heart rate at different levels of workload.
There are of course additional observations regarding the heart rate fluctuations in figure 6 that require modeling and statistical analysis. For example, the zoomed-in HR fluctuations in figure 7, implies that S2-based HR has higher frequency fluctuations than ECG-based HR and S1-based HR. To assess this hypothesis, we can calculate the power spectrum and entropy to measure the frequency components and uncertainty in the different HR time-series. The Lomb-Scargle normalized periodogram is a standard method for measuring the power spectrum of HRV time-series, such as R–R intervals (Estévez et al 2016). It is particularly useful for analyzing HRV in cases where the data is irregularly sampled, noisy, or non-stationary (Stewart et al 2020). Figures 8(a) and (b) present the spectral analysis of R–R, S1–S1, and S2–S2 intervals from the sample records from figure 6, under various workload scenarios. Accordingly, the S2-based HR has stronger high-frequency components than ECG-based and S1-based HR, specifically in the higher frequency range (0.2–1 Hz).

Figure 8. Lomb-Scargle normalized periodogram of HRV for (a) pedaling on a stationary bicycle for record ECGPCG0001 and (b) Bruce treadmill stress test for record ECGPCG0038; and approximate entropy of HRV for (c) pedaling on a stationary bicycle for record ECGPCG0001 and (d) a Bruce treadmill stress test for record ECGPCG0038. The corresponding time-series are shown in figure 6.
Download figure:
Standard image High-resolution imageAs a sample nonlinear analysis, the approximate entropy (ApEn) of the HRV time-series was calculated for a range of tolerance parameters (r) to measure uncertainty and randomness (Richman and Moorman 2000). Intuitively, low ApEn values indicate that the system is very persistent, repetitive, and predictive, with apparent patterns that repeat throughout the time-series while higher values reflect independence between the data, fewer repeated patterns, and randomness (Delgado-Bonal and Marshak 2019). The parameter r sets a similarity threshold between data segments, determining whether two sequences are similar based on their differences. Typically, r is a fraction of the data's standard deviation. It highlights pattern regularity, where lower ApEn values suggest predictability and repetition, indicating consistent patterns. In contrast, higher ApEn values imply increased randomness and fewer repeated patterns. A plot of ApEn versus r demonstrates how variations in r affect the system's complexity, specifically showing the point where the signal transitions from predictable to more random patterns, thereby providing an understanding of the signal's structure relative to r.
The ApEn results of the samples of figure 6 are shown in figures 8(c) and 8(d). According to figure 5(a), the amplitude and power of S2 waves are weaker than those of S1. The SNR indeed impacts our precision in detecting these waves, as illustrated in figure 7, where the power spectral density (PSD) for S2 exhibits slightly higher frequency components compared to S1. This is also observed in figures 8(a) and (b). An alternative hypothesis is that there might be more intrinsic randomness in S2, than S1, which is beyond the scope of our current study.
Although the impact of SNR on approximate entropy is less evident, our findings in figures 8(c) and (d) show that ApEn peaks at a slightly higher tolerance parameter r for S2 than for S1, indicating more randomness in the S2 time series. This is consistent with the observed higher entropy in S2-based HRV compared to both ECG-based and S1-based HRVs, showing increased randomness in the S2-based HRV.
5.2. Studying the electromechanical coupling of the heart from ECG and PCG-based indexes
We employed the Pearson correlation coefficient, a widely recognized measure of coupling, to investigate the relationship between ECG and PCG-based indices as proxies for the interactions between the electrical and mechanical activities of the heart. The index was calculated for the R–R and R-S1 intervals of all recordings of the dataset, during different physical activities. We compared two categories of workloads: low-intensity activities including lying, sitting, and slow walk (at 3.7 km h−1 speed), and high-intensity activities including compound activity (slow walk, fast walk, sit-to-stand, followed by slow walk), treadmill test, and biking. Figure 9 presents the box plots of the calculated correlation coefficients for these categories. Accordingly, the coupling between R–R and R-S1 is significantly stronger in the high-intensity category compared to the low-intensity category (p-value <10−8). Specifically, in low-intensity workloads, the R-S1 interval exhibited a very small correlation with the R–R interval, with an average correlation coefficient of 0.04. However, in high-intensity workloads characterized by rapid heart rates, the R-S1 is positively correlated with R–R interval, with an average correlation coefficient of 0.65 across all records.

Figure 9. Box plots of the correlation coefficients between R–R and R-S1 intervals for all recordings in low-intensity (green) and high-intensity (red) workloads. Overall, there were 8 lying, 11 sitting, 13 slow walk (at 3.7 km h−1), 3 compound activities, 11 treadmill, and 22 bicycle records.
Download figure:
Standard image High-resolution image5.3. Significance of cardiac electromechanical time intervals
We can also study the relationship between the cardiac electromechanical time intervals and the different physical workloads. As proof of concept, we present the results for subject S009, from whom we have 30 min recordings in three different scenarios: rest (sitting on an armchair), rest (lying on a bed), and exercise (walking at different speeds) conditions. To study the significance of the different ECG-PCG time intervals, we studied the feature importance in classifying the data segments corresponding to sitting, lying, and walking from the combination of the ECG and PCG-based features. The 30 min recordings were divided into 30 s intervals with a sliding window of 5 s, resulting in a total of 1074 segments. Various features were extracted from R–R, S1–S2, S2–S1, R-S1, and R-S2 intervals, including HRV features: normal-to-normal beat intervals mean (NNmean) and standardard deviation (SDNN), and acceleration/deceleration capacity values using phase-rectified signal averaging (Kantelhardt et al 2007), resulting in a total of 20 features for every 30 s segment. The open-source PhysioNet-Cardiovascular-Signal-Toolbox was used to extract these features (Vest et al 2018, 2019).
To evaluate the relative importance of each feature, we used the minimal-redundancy-maximal-relevance (mRMR) criterion to select and rank the features (Peng et al 2005). mRMR is a well-established information-theoretical method for feature analysis, which has also been used for algorithmic heart disease diagnosis (Wang et al 2022). We used the function fscmrmr in MATLAB, setting the parameter corresponding to the prior probabilities for each class to 'empirical', which determines class probabilities from the class frequencies in the class labels. In total, 1074 thirty-second segments were used in the mRMR analysis. Table 3 shows the 10 most significant features out of a total of 20 features that selected and ranked based on mRMR. In this table, RS1-NNmean and RS2-NNmean denote the average of R-peak to S1 and S2 wave intervals of normal beats, respectively. RS2-acceleration and RS2-deceleration denote the acceleration/deceleration capacity values of the R-peak to S2-wave interval.
Table 3. Feature importance ranked by mRMR for classifying the physical workloads of record S009.
| Feature ranking | Feature ranking |
|---|---|
| 1- RS2-NNmean | 6- RR-deceleration |
| 2- RS2-deceleration | 7- S2S1-NNmean |
| 3- RS1-SDNN | 8- S1S2-NNmean |
| 4- RS1-NNmean | 9- S1S2-SDNN |
| 5- RS2-acceleration | 10- S1S2-deceleration |
Accordingly, the most significant feature is RS2-NNmean, which is derived from electro-mechanical intervals. This shows the importance of simultaneous ECG and PCG recording to extract hybrid features. The scatter plot in figure 10 displays the first three features selected by mRMR in three levels of workloads. It shows a clear separation between the physical activities, particularly between sitting and lying.

Figure 10. Scatter plot of the most significant features selected by mRMR in three workloads for record S009.
Download figure:
Standard image High-resolution imageWe further used the SHAP (SHapley Additive exPlanations) method to analyze the feature importances. The SHAP method calculates local feature importance for each data point, as opposed to traditional methods which calculate the importance of each feature globally (Lundberg and Lee 2017, Lundberg et al 2020). For feature analysis by the SHAP method, three binary random forest classifiers were used based on the one-vs-rest (OvR) method and applied to the 1074 thirty-second records. The beeswarm plot in figure 11 summarizes all SHAP values for the top 10 features based on their SHAP values. Accordingly, the electromechanical intervals rank higher than the R–R intervals in terms of feature importance. Specifically, figures 11(a) and (b) confirm that RS2-NNmean is the most significant feature for classifying sitting vs other classes and lying vs other classes, in the OvR method. This is consistent with the results of mRMR in figure 10, which identified RS2-NNmean as the most important feature.

Figure 11. Feature importance and ranking based on SHAP-values in a one-vs-rest binary classification of the different physical activities for record S009.
Download figure:
Standard image High-resolution image
In summary, both the mRMR and SHAP methods confirm the significance of inter-modal ECG and PCG features R-S1 and R-S2 intervals during different physical activities.
6. Discussion and future work
This EPHNOGRAM project demonstrated the intricate relationship between the cardiac electrical and mechanical functions, highlighting the benefits of analyzing both ECG and PCG data to enhance heart rate monitoring and cardiovascular diagnostics.
The results reveal a notable correlation between ECG and PCG heart rates across various physical activity intensities. The S2-based HR from PCG, in particular, showed increased high-frequency components and variability during intense activities like stationary bicycle pedaling. This insight is pivotal for comprehending HRV under different physiological workloads and paves the way for improved cardiovascular monitoring and diagnostics, including the development of combined ECG-PCG cardiac stress tests.
The analysis showed that the electromechanical coupling of the heart, represented by the correlation between ECG-based R–R and the combined ECG-PCG-based R-S1 intervals, is more pronounced during high-intensity activities. This finding not only emphasizes the cardiac dynamic response to varying demands but also suggests that simultaneous ECG and PCG monitoring could offer a more comprehensive multimodal understanding of cardiac function.
Feature importance analysis identified specific intervals, like the R-S2-interval mean, as crucial for differentiating various cardiac activity states, including resting, sitting, and walking. SHAP analysis also confirms these findings, underscoring their potential to enhance cardiac monitoring system accuracy.
These insights are invaluable for advancing cardiac monitoring and diagnostic technologies. The correlation and significance of multimodal ECG and PCG analysis could inform the creation of more precise heart rate monitoring algorithms, especially crucial in clinical settings for accurate cardiac assessments.
6.1. Future directions and limitations
While our study significantly contributes to the understanding of heart rate dynamics and electromechanical coupling, future research should extend these insights to more diverse populations, including both normal and pathological conditions of different sex, age and race groups.
Advancements in EPCG hardware could facilitate the integration of this technology into wearable cardiac monitoring devices. Such development could revolutionize real-time, non-invasive cardiac health assessments for outpatients in everyday life.
The methodological aspects of this research offer several avenues for expansion. Investigating the mutual information between ECG and PCG modalities, along with their unique contributions, is one such direction that can lead into multimodal cardiac monitoring (Lahat et al 2015). Utilizing a combination of time and frequency domain features, we anticipate uncovering detailed mutual and exclusive information between these two modalities. This could prove instrumental in examining micro-variations between the heart's electrical and mechanical mechanisms. Such findings are crucial not only for machine learning applications but also for understanding the cardiac function and its variation with different physical activity levels. This underscores the importance of simultaneous and multimodal heart monitoring for more accurate cardiac diagnosis.
Future research should also consider implementing active noise cancellation algorithms to enhance PCG data quality. As indicated in the EPHNOGRAM data description, certain channels (PCG2, AUX1, and AUX2) exhibit very low amplitude, often at the level of quantization noise. Despite their limited direct utility, these channels, which capture electronic device noises and faint environmental sounds, could be valuable for developing adaptive noise cancellers or multichannel blind and semi-blind source separation algorithms.
Additionally, the dataset could be leveraged to create mathematical ECG-PCG models and digital twins using simultaneous ECG and PCG channels. This approach builds on the past developments in electrocardiography, such as synthetic ECG generators (McSharry 2003), which facilitated the creation of algorithms for Kalman filtering and parameter extraction from noisy ECG recordings (Sameni et al 2007, 2008). Similarly, the present dataset could assist in developing algorithms for denoising and automatic parameter extraction from PCG, or simultaneous ECG and PCG recordings.
7. Conclusion
The EPHNOGRAM project and the EPCG prototype device for simultaneous ECG and PCG acquisition, marks a significant advancement in multimodal cardiac analysis. This integration allows for a comprehensive understanding of the heart's electrical and mechanical functions in various physical workloads. The collected dataset utilizing this technology, which is publicly available on PhysioNet, revealed crucial findings, such as 'micro-variations' in heart rate time-series and the distinct behavior of ECG and PCG data under different physical workloads. By identifying specific patterns in electromechanical time intervals and leveraging advanced analysis, we can move closer to understanding the interactions between the electrical and mechanical mechanisms of the heart.
This project underscores the importance of simultaneous and multimodal heart monitoring and sets the stage for future research to expand these findings to broader populations and integrate them into practical, wearable cardiac health assessment technologies and new multimodal stress-test systems, paving the way for more accurate, non-invasive, and real-time cardiac assessment tools in both clinical and everyday settings.
Acknowledgments
The EPHNOGRAM database was collected as a part of A Kazemnejad's master's thesis at the School of Electrical and Computer Engineering of Shiraz University, Shiraz, Iran (2016–2018). R Sameni acknowledges support from the American Heart Association Innovative Project Award 23IPA1054351, on 'developing multimodal cardiac biomarkers for cardiovascular-related health assessment.'
Data availability statement
The data that support the findings of this study are openly available at the following URL/DOI: http://doi.org/10.13026/kr2z-1881.
Ethical statement
This research, involving human participants, was approved by Shiraz University's Biomedical Engineering Review Board. The study was conducted in strict accordance with the principles of the Declaration of Helsinki and complied with local statutory requirements. Prior to participation, all participants, volunteered and provided informed consent for their involvement in the study. Additionally, consent for publication was obtained from all identifiable participants. This research did not involve animal experimentation.
Footnotes
- 4
Note that while the ECG contains diagnostic information from 0.5 to 150 Hz, according to the IEC standard (International Electrotechnical Commission 2016), if an ECG device is used for ST-segment measurements, a lower cutoff frequency of 0.05 Hz is advised.
- 5
The delay compensation was only performed in the software—the raw ECG and PCG available in the EPHNOGRAM PhysioNet project have not been altered.