
Abstract
Objective. The percentages of cardiac and sympathetic baroreflex patterns detected via baroreflex sequence (SEQ) technique from spontaneous variability of heart period (HP) and systolic arterial pressure (SAP) and of muscle nerve sympathetic activity (MSNA) burst rate and diastolic arterial pressure (DAP) are utilized to assess the level of the baroreflex engagement. The cardiac baroreflex patterns can be distinguished in those featuring both HP and SAP increases (cSEQ++) and decreases (cSEQ−−), while the sympathetic baroreflex patterns in those featuring a MSNA burst rate decrease and a DAP increase (sSEQ+−) and vice versa (sSEQ−+). The present study aims to assess the modifications of the involvement of the cardiac and sympathetic arms of the baroreflex with age and postural stimulus intensity. Approach. We monitored the percentages of cSEQ++ (%cSEQ++) and cSEQ−− (%cSEQ−−) in 100 healthy subjects (age: 21–70 years, 54 males, 46 females), divided into five sex-balanced groups consisting of 20 subjects in each decade at rest in supine position and during active standing (STAND). We evaluated %cSEQ++, %cSEQ−−, and the percentages of sSEQ+− (%sSEQ+−) and sSEQ−+ (%sSEQ−+) in 12 young healthy subjects (age 23 ± 2 years, 3 females, 9 males) undergoing incremental head-up tilt. Main results. We found that: (i) %cSEQ++ and %cSEQ−− decreased with age and increased with STAND and postural stimulus intensity; (ii) %sSEQ+− and %sSEQ−+ augmented with postural challenge magnitude; (iii) the level of cardiac and sympathetic baroreflex engagement did not depend on either the absolute value of arterial pressure or the direction of its changes. Significance. This study stresses the limited ability of the cardiac and sympathetic arms of the baroreflex in controlling absolute arterial pressure values and the equivalent ability of both positive and negative arterial pressure changes in soliciting them.
Export citation and abstract BibTeX RIS

Original content from this work may be used under the terms of the Creative Commons Attribution 4.0 licence. Any further distribution of this work must maintain attribution to the author(s) and the title of the work, journal citation and DOI.
1. Introduction
The cardiac baroreflex is responsible for adjusting heart period (HP) to limit the variability of arterial pressure (AP), and it was originally characterized by assessing the positive slope of the linear regression of HP on systolic AP (SAP) after the administration of a vasoactive drug (Smyth et al 1969, Pickering et al 1972). The baroreflex sequence (SEQ) method (Bertinieri et al 1985) is one of the most utilized time domain techniques for the characterization of the cardiac baroreflex from spontaneous variability of HP and SAP (Parati et al 1988, Steptoe and Vogele 1990, Blaber et al 1995, Parlow et al 1995, Porta et al 2000, Laude et al 2004, Porta et al 2013a). The SEQ method is based on the definition of patterns of cardiac baroreflex origin featuring concomitant parallel variations, either increases or decreases, of both HP and SAP (Bertinieri et al 1985). The sympathetic baroreflex varies sympathetic activity to buffer AP changes, and it was originally evaluated by assessing the negative slope of the linear regression of a suitable parameter derived from muscle sympathetic nerve activity (MSNA) on diastolic AP (DAP) both after pharmacological challenges (Ebert et al 1992, Rudas et al 1999) and in nonpharmacological condition (Sundlof and Wallin 1978, Kienbaum et al 2001, Hart et al 2010). The SEQ technique was adapted to typify the sympathetic baroreflex from spontaneous variability of MSNA burst rate, as defined in Marchi et al (2016a), and DAP (Marchi et al 2016b). Patterns of sympathetic baroreflex origin were defined as concomitant antiparallel sequences featuring MSNA burst rate increases and DAP decreases, or vice versa (Marchi et al 2016b). In the studies that originally proposed the SEQ technique for the characterization of the cardiac (Bertinieri et al 1985) and sympathetic (Marchi et al 2016b) arms of the baroreflex, it was suggested that the percentage of cardiac baroreflex sequences (%cSEQ) and of sympathetic baroreflex sequences (%sSEQ) could provide a measure of the degree of solicitation of the two baroreflex arms.
The advantage of the SEQ method with respect to the other analytical methods is the possibility of investigating the contribution of AP rises and falls separately. In the case of the cardiac baroreflex, it is possible to separate HP-SAP patterns featuring HP lengthening driven by SAP increase, referred to as cSEQ++, from those presenting HP shortening in response to SAP fall, labelled as cSEQ−− (Bertinieri et al 1985, Parati et al 1988, De Maria et al 2018, De Maria et al 2019b). In the case of the sympathetic baroreflex, it is possible to separate MSNA-DAP patterns featuring a DAP increase associated to a MSNA burst rate decrease, referred to as sSEQ+−, from those presenting the opposite combination, namely a DAP fall and a MSNA burst rate rise, labelled as sSEQ−+ (Marchi et al 2016b, De Maria et al 2019a).
Aging influences the functioning of the cardiac baroreflex (Laitinen et al 1998, Rudas et al 1999, Jones et al 2003, Laitinen et al 2004, Fauvel et al 2007, Milan-Mattos et al 2018). This result has been confirmed by the SEQ technique as well (Laitinen et al 2004, De Maria et al 2019b). Orthostatic stimulus affects the functioning of the cardiac baroreflex (Cooke et al 1999, Laitinen et al 2004, De Maria et al 2018, Milan-Mattos et al 2018, Porta et al 2023a) and sympathetic baroreflex (O'Leary et al 2003, Fu et al 2006, Ichinose et al 2006, Barbic et al 2015). This finding has been confirmed by the SEQ analysis as well (Steptoe and Vogele 1990, Laitinen et al 2004, Marchi et al 2016b, Porta et al 2016, De Maria et al 2019a, De Maria et al 2019b). However, the impact of aging and postural challenges on the functioning of the cardiac and sympathetic arms of the baroreflex has been assessed most in terms of influences on baroreflex sensitivity, but the effect on parameters describing their engagement, such as %cSEQ and %sSEQ, has not been reported, especially when separately considering the direction of the AP variations. Since similar cardiac and sympathetic baroreflex sensitivities might underlie dissimilar baroreflex engagements and the involvement of the cardiac and sympathetic arms of the baroreflex might be distributed differently to buffer positive and negative AP variations, this analysis might provide additional insight in the AP control.
Thus, the present study aims to compare %cSEQ++ with %cSEQ−− and %sSEQ+− with %sSEQ−+ in experimental conditions challenging the baroreflex, such as aging and postural stressors. The aging protocol enables us to monitor %cSEQ++ and %cSEQ−− in healthy subjects of different ages at supine resting (REST) and during active standing (STAND) (Catai et al 2014, Porta et al 2014). The incremental head-up tilt protocol allowed the monitoring of %cSEQ++ and %cSEQ−− and of %sSEQ+− and %sSEQ−+ in young, healthy subjects undergoing passive orthostatic challenges of various intensities (Lambert et al 2008). The two protocols were considered together in the present study to provide the most complete picture on the quantification of the engagement of the baroreflex in response to aging and postural stressors that we can provide according to the data we collected in the past. Since the degree of involvement of the cardiac and sympathetic arms of the baroreflex might be influenced by the level of AP (Hesse et al 2007, Hart et al 2011, Incognito et al 2020), we correlated the %cSEQ and %sSEQ with the SAP and DAP mean values, respectively.
2. Experimental protocol and data analysis
2.1. Aging protocol
This experimental protocol was designed to assess the effect of the aging process on the cardiac baroreflex in healthy subjects (Catai et al 2014, Porta et al 2014). In this study we retrospectively analyzed recordings prospectively collected from 2011 to 2012. The study adhered to the Principles of the Declaration of Helsinki and was approved by the Ethics Committee of the Federal University of São Carlos (173/2011). Subjects signed an informed consent upon enrollment. We refer to (Catai et al 2014, Porta et al 2014) for additional details. Briefly, participants to the study were non-smokers, free of any disease and not taking any medication. Subjects were invited to avoid caffeinated and alcoholic beverages in the 24 h preceding the test. The group consisted of 100 healthy subjects (age from 21 to 70 years, median = 45 years), divided into 5 groups according to their age: (i) group 21–30 (age from 21 and 30 years, median = 26 years, 10 males, 10 females); (ii) group 31–40 (age from 31 to 40 years, median = 34 years; 11 males, 9 females); (iii) group 41–50 (age from 41 and 50 years, median = 45 years, 10 males, 10 females); (iv) group 51–60 (age from 51 and 60 years; median = 55 years, 10 males, 10 females); (v) group 61–70 (age from 61 to 70 years; median = 65 years; 13 males, 7 females). Body mass index (BMI) and peak oxygen uptake of all the groups were reported in Catai et al (2014), Porta et al (2014).
For each subject an electrocardiogram (ECG), via a bioamplifier device (BioAmp FE132, ADInstruments, Sydney, Australia), and non-invasive AP, via a volume-clamp device (Finometer-PRO, Finapres Medical System, Amsterdam, The Netherlands) was available for analysis. Recordings were conducted at REST and during STAND, where STAND sessions always followed REST. Both REST and STAND recordings lasted 15 min. The test was performed in the morning after a good-slept night in a room with a comfortable temperature. The subjects breathed spontaneously during the test, but they were not allowed to talk. Signals were sampled at 400 Hz via a commercial analog-to-digital converter device (Power Lab 8/35, ADInstruments, Sydney, Australia).
2.2. Incremental head-up tilt protocol
This experimental protocol was designed to assess the effect of passive orthostatic challenge with incremental intensity on the cardiac and sympathetic arms of the baroreflex in young healthy subjects (Lambert et al 2008). In this study we retrospectively analyzed recordings prospectively collected from 2006 to 2008. The study adhered to the Principles of the Declaration of Helsinki and was approved by the Alfred Hospital Ethics Committee (144/06). Subjects signed an informed consent upon enrollment. We refer to Lambert et al (2008) for additional details. Briefly, participants in the study were free of any disease and not taking medications. Subjects were invited to avoid caffeinated and alcoholic beverages in the 24 h preceding the test. The group consisted of 12 young, healthy subjects (age: 23 ± 2 years, BMI: 24.3 ± 2.5 kg·m−2, 9 males, 3 females).
Each enrolled subject underwent an incremental head-up tilt test. The table was consecutively tilted at 0°, 20°, 30°, 40° and 60° (T0, T20, T30, T40 and T60, respectively), never returned to 0° and angle was incremented from the previous inclination. Each angle was maintained for 10 min. The recording at 60° was completed in 7 subjects, while the recordings of one subject during T30 and T40 were excluded from the analysis for poor quality. We recorded ECG (ADInstruments, Sydney, Australia), invasive AP from the radial artery (3F, 5 cm, Cook catheter), and MSNA acquired via a microneurographic device (IOWA Nerve Traffic Analyzer, model 662C-3, Department of Bioengineering, University of Iowa, Iowa) from postganglionic sympathetic fibers directed to the muscle vasculature (Vallbo et al 2004). Signals were recorded for the overall duration of the incremental challenge. The MSNA signal was acquired by inserting a tungsten microelectrode (FHC, Bowdoinham, Maine) in the peroneal nerve and adjusting the position to obtain a satisfactory signal. The raw MSNA signal was band-pass filtered (700–2000 Hz), amplified, rectified, and integrated (time constant of 0.1 s). The integrated MSNA signal was utilized for further analysis. The tests were performed in the morning after a good-slept night in a room with a comfortable temperature. The subjects breathed spontaneously but were not allowed to talk. The sampling rate was fixed at 1000 Hz via a commercial analog-to-digital converter device (PowerLab ML785/8SP, ADInstruments, Sydney, Australia).
2.3. Beat-to-beat variability series extraction
The software for the beat-to-beat variability series extraction was developed in-house and applied to the raw signals collected in both the protocols (Porta et al 1998; Porta et al 2013a). The software searches for the QRS complex via a method based on a threshold on the first derivative of the ECG signal. The position of the apex of the QRS complex was refined via parabolic interpolation. The ith HP, where i is the cardiac beat counter, was calculated as the temporal distance between two consecutive R-wave peaks detected on the ECG. The maximum of the AP within the ith HP was taken as the ith SAP value. The ith DAP was detected as the minimum of the AP found after the ith SAP. The MSNA burst rate series was derived as follows. The first step was the identification of the MSNA bursts using an automatic detection algorithm (Diedrich et al 2009). The method was based on an amplitude threshold set over the MSNA signal. The threshold was updated on a beat-to-beat basis and kept constant over the current HP. In agreement with the traditional setting of the MSNA burst latency, the MSNA burst was searched in a time window ranging from 0.9 to 1.7 s from each R peak (Sundlöf and Wallin 1978, Kienbaum et al 2001). The MSNA burst rate series was obtained by counting the MSNA bursts in a moving time window of 5 s, filtering the resulting stepwise signal with a low-pass filter with a cut-off frequency of 0.5 Hz, and sampling the filtered signal at the first R-wave peak delimiting each ith HP (Marchi et al 2016a). The obtained value was indicated as ith MSNA. All the MSNA values were divided by 5 s, thus obtaining mean MSNA burst rate values expressed in bursts·s−1 (Marchi et al 2016a). The detection of fiduciary points was visually checked. In the case of a misdetection, the correct event was identified and reinserted, thus allowing the automatic recalculation of all the associated values. In the case of ectopic beats, the series were corrected via cubic spline interpolation. The number of corrections was very limited and largely below 5%. In the aging protocol, we derived HP and SAP series, and in the incremental head-up tilt protocol, the HP, DAP and MSNA burst rate series. In the case of the aging protocol, segments of the HP and SAP series lasting 256 beats were selected in a random position at REST and during STAND. As to the incremental head-up tilt protocol, segments of HP, SAP, DAP and MSNA burst rate lasting 256 beats were selected in a random position during T0, T20, T30, T40 and T60. Stationarity of the mean and variance was tested according to Magagnin et al (2011). Trends of the mean and variance of HP, SAP, DAP and MSNA burst rate, namely μHP, μSAP, μDAP, μMSNA, and σ2 HP, σ2 SAP, σ2 DAP, σ2 MSNA, respectively, with age and experimental condition were already reported in Catai et al (2014), De Maria et al (2019b) and Marchi et al (2016b). Briefly, in the aging protocol at REST μHP did not vary with age, while σ2 HP decreased as aging progressed, and both μSAP and σ2 SAP were positively correlated with age. In the aging protocol, during STAND σ2 SAP did not vary with age, while σ2 HP was negatively associated with age, and both μHP and μSAP increased gradually as aging progressed. Briefly, in the incremental head-up tilt protocol, we observed a decrease of μHP with the magnitude of the postural challenge associated with an increase of μMSNA, σ2 SAP, σ2 DAP, and σ2 MSNA. Conversely, μSAP, μDAP, and σ2 HP did not change.
2.4. Definition of patterns of cardiac baroreflex origin
We followed the definition of the pattern of cardiac baroreflex origin given in (Bertinieri et al 1985) and subsequent modifications reported in (Porta et al 2000). Briefly, the method is based on the search of HP and SAP ordered sequences [HP(i), HP(i+1), HP(i+2), HP(i+3)] and [SAP(i), SAP(i+1), SAP(i+2), SAP(i+3)] formed by four consecutive HP and SAP values corresponding to three HP and SAP variations. The HP and SAP patterns that featured all positive or negative variations and occurred synchronously were referred to as cSEQ++ and cSEQ−−, respectively. All cSEQ++ and cSEQ−− were considered of cardiac baroreflex origin regardless of the magnitude of SAP and HP variations and the strength of their linear association (Porta et al 2013a). The %cSEQ++ and %cSEQ−− were computed by dividing the number of cSEQ++ and cSEQ−− patterns by the number of total patterns and multiplying the results by 100.
2.5. Definition of patterns of sympathetic baroreflex origin
We followed the definition of the pattern of sympathetic baroreflex origin given in (Marchi et al 2016b) that exploited the definition of MSNA burst rate variability given in (Marchi et al 2016a). Briefly, the method is based on the search of MSNA and DAP ordered sequences [MSNA(i), MSNA(i+1), MSNA(i+2), MSNA(i+3)] and [DAP(i), DAP(i+1), DAP(i+2), DAP(i+3)] formed by four consecutive MSNA burst rate and DAP values corresponding to three MSNA burst rate and DAP variations. The MSNA and DAP patterns that featured all antiparallel variations, with all positive DAP variations associated with negative MSNA burst rate changes, were referred to as sSEQ+−. The opposite situation with all negative DAP and positive MSNA burst rate variations led to the definition of sSEQ−+. sSEQ+− and sSEQ−+ were considered of sympathetic baroreflex origin regardless of the magnitude of DAP and MSNA burst rate variations and the strength of their linear association. The %sSEQ+− and %sSEQ−+ were computed by dividing the number of sSEQ+− and sSEQ−+ patterns by the number of total patterns and multiplying the results by 100.
2.6. Statistical analysis
As to the aging protocol, two-way repeated measures analysis of variance (one-factor repetition, Holm–Sidak test for multiple comparisons) versus control was applied to test the differences between %cSEQ markers within the same age group (i.e. 21–30, 31–40, 41–50, 51–60 and 61–70) and changes compared to 21–30 group within the same %cSEQ index (i.e. %cSEQ++ or %cSEQ−−). This analysis was carried out separately at REST and STAND. Two-way repeated measures analysis of variance (one-factor repetition, Holm–Sidak test for multiple comparisons) versus control was applied to test the differences between REST and STAND within the same age group and the impact of age compared to 21–30 group assigned the experimental condition (i.e. REST or STAND). This analysis was carried out separately over %cSEQ++ and %cSEQ−−.
As to the incremental head-up tilt protocol, two-way repeated measures analysis of variance (one-factor repetition, Holm–Sidak test for multiple comparisons) versus control was applied to test the differences between %cSEQ indexes within the same orthostatic challenge (i.e. T0, T20, T30, T40 and T60) and changes compared to T0 within the same %cSEQ marker (i.e. %cSEQ++ and %cSEQ−−). This analysis was carried out separately over %sSEQ indexes as well.
The linear regression analysis of %cSEQ−− on %cSEQ++, of %sSEQ−+ on %sSEQ+−, of %cSEQ++ on μSAP, of %cSEQ−− on μSAP, of %sSEQ+− on μDAP, and of %sSEQ−+ on μDAP was carried by pooling all the data regardless of the experimental condition and group. Linear regression analysis was performed separately in each experimental protocol. Pearson product-moment correlation coefficient r and type I error probability p were calculated. A p < 0.05 was always considered significant. The r and p of the linear regression analysis were reported when statistically significant. Statistical analysis was carried out using a commercial statistical program (Sigmaplot, Systat Software, Inc., Chicago, IL, version 11.0).
3. Results
3.1. Results relevant to the aging protocol
The vertical grouped error bar graphs of figure 1 show %cSEQ++ (black bars) and %cSEQ−− (white bars) as a function of the age groups (i.e. 21–30, 31–40, 41–50, 51–60 and 61–70) at REST (figure 1(a)) and during STAND (figure 1(b)). %cSEQ++ and %cSEQ−− were similar, and this finding held regardless of the age bin and experimental condition (figures 1(a), (b)). At REST, both %cSEQ++ and %cSEQ−− did not vary with age (figure 1(a)). During STAND, %cSEQ++ decreased in the 51–60 and 61–70 groups compared to the 21–30 one, while %cSEQ−− was lower in the 61–70 group compared to the 21–30 one (figure 1(b)).

Figure 1. The vertical grouped error bar graphs show %cSEQ++ (black bars) and %cSEQ−− (white bars) in the aging protocol as a function of the age groups (i.e. 21–30, 31–40, 41–50, 51–60 and 61–70 years) at REST (a) and during STAND (b). Data are reported as mean+standard deviation. Two-way repeated measures analysis of variance (one-factor repetition, Holm–Sidak test for multiple comparisons) versus control, namely %cSEQ++ and 21–30, is applied. The symbol * indicates p < 0.05 versus 21–30 group.
Download figure:
Standard image High-resolution imageFigure 2 shows %cSEQ++ (figure 2(a)) and %cSEQ−− (figure 2(b)) as a function of the age groups, while considering the position of the body as a part of the statistical model. Data are reported at REST (black bars) and during STAND (white bars). %cSEQ++ and %cSEQ−− increased during STAND compared to REST, and this difference was significant in the 21–30, 31–40 and 51–60 groups in the case of %cSEQ++ (figure 2(a)) and in 21–30, 31–40, 41–50 and 51–60 groups in the case of %cSEQ−− (figure 2(b)). Trends of %cSEQ++ and %cSEQ−− with age were the same as in figure 1.
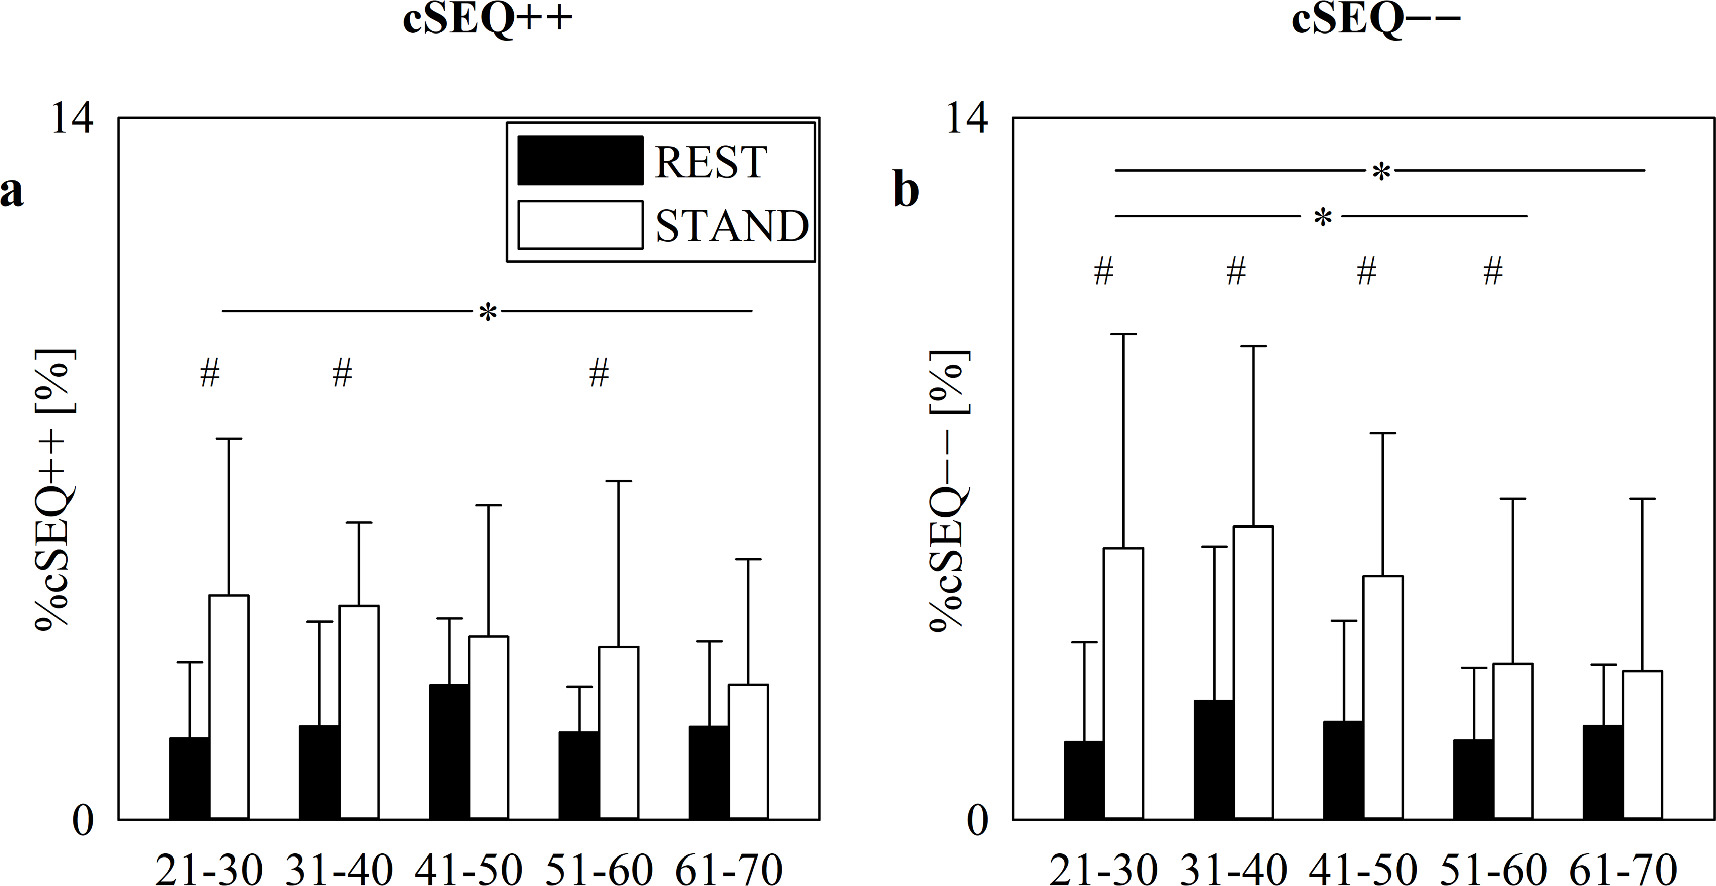
Figure 2. The vertical grouped error bar graphs show %cSEQ++ (a) and %cSEQ−− (a) in the aging protocol as a function of the age groups (i.e. 21–30, 31–40, 41–50, 51–60 and 61–70 years) at REST (black bars) and during STAND (white bars). Data are reported as mean+standard deviation. Two-way repeated measures analysis of variance (one-factor repetition, Holm–Sidak test for multiple comparisons) versus control, namely REST and 21–30), is applied. The symbols # and * indicate, respectively, p < 0.05 versus REST and versus 21–30 group.
Download figure:
Standard image High-resolution imageThe scatterplot of figure 3 shows the results of the linear correlation analysis of %cSEQ−− on %cSEQ++. %cSEQ−− and %cSEQ++ were found to be significantly correlated with r = 0.697 and p = 2.131 × 10⁻³⁰. After removing pairs with values of %cSEQ−− or %cSEQ++ below the 2.5th percentile or above the 97.5th percentile of their distribution (n = 4), %cSEQ−− and %cSEQ++ were still significantly correlated with r = 0.648 and p = 1.009·10–24.
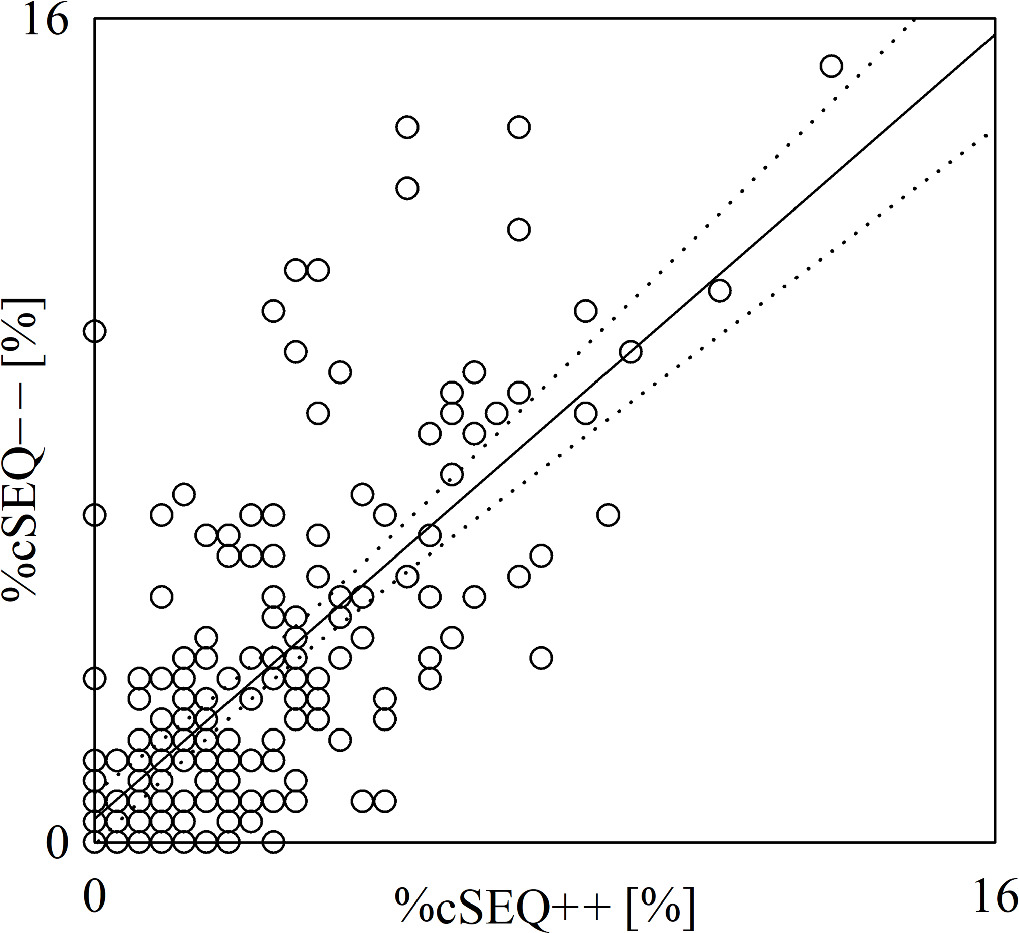
Figure 3. The scatterplot shows the results of the linear correlation analysis of %cSEQ−− on %cSEQ++ in the aging protocol. Each open circle represents a (%cSEQ++, %cSEQ−−) pair computed in an assigned subject. Data are pooled regardless of group (i.e. 21–30, 31–40, 41–50, 51–60 and 61–70) and the experimental condition (i.e. REST or STAND). The linear regression line (solid line) and its 95% confidence interval (dotted lines) are shown because the Pearson product-moment correlation coefficient is different from 0 with p < 0.05.
Download figure:
Standard image High-resolution imageThe scatterplots of figure 4 show the results of the linear correlation analysis of %cSEQ++ on μSAP (figure 4(a)) and %cSEQ−− on μSAP (figure 4(b)). %cSEQ and μSAP are not significantly associated and this result held regardless of the type of cardiac baroreflex pattern.
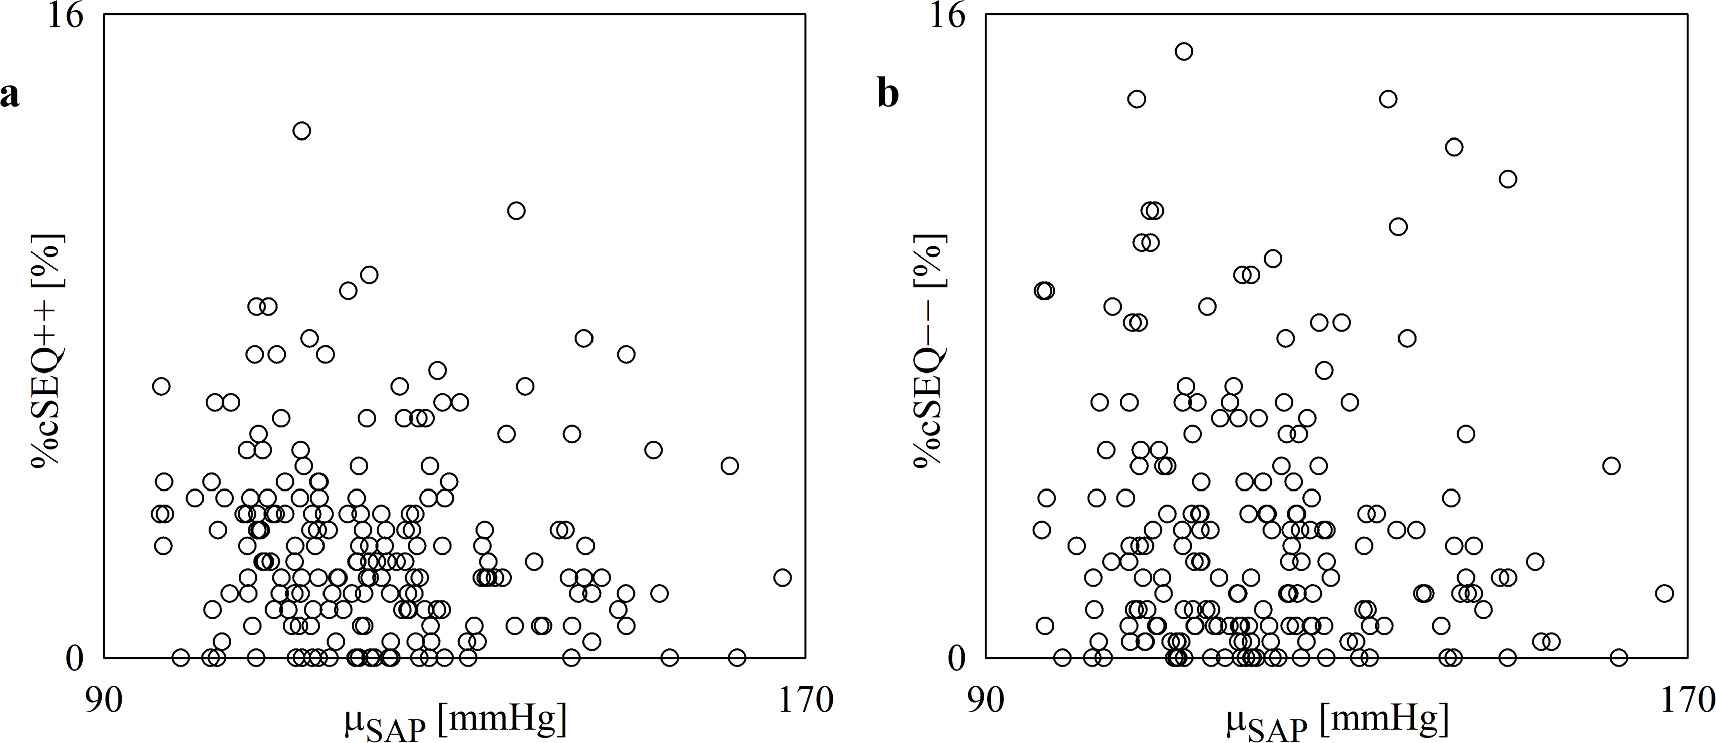
Figure 4. The scatterplot shows the results of the linear correlation analysis of %cSEQ++ (a) and %cSEQ−− (b) on μSAP in the aging protocol. Each open circle represents a (μSAP, %cSEQ++) and (μSAP, %cSEQ−−) pair computed in an assigned subject. Data are pooled regardless of group (i.e. 21–30, 31–40, 41–50, 51–60 and 61–70) and the experimental condition (i.e. REST or STAND). No significant association is detected via the Pearson product-moment correlation analysis with p < 0.05.
Download figure:
Standard image High-resolution image3.2. Results relevant to incremental head-up tilt protocol
The vertical grouped error bar graphs of figure 5 show %cSEQ (figure 5(a)) and %sSEQ (figure 5(b)) as a function of the experimental condition (i.e. T0, T20, T30, T40 and T60). %cSEQ were subdivided in %cSEQ++ (black bars) and %cSEQ−− (white bars) in figure 5(a) and %sSEQ were subdivided in %sSEQ+− (black bars) and %sSEQ−+ (white bars) in figure 5(b). Regardless of the arm of the baroreflex, the proportion of patterns belonging to the two families (i.e. %cSEQ++ and %cSEQ−− in the case of the cardiac baroreflex and %sSEQ+− and %sSEQ−+ in the case of the sympathetic baroreflex) were similar (figures 5(a), (b)). The %cSEQ tended to increase with the magnitude of the challenge but the increment was significant only in the case of %cSEQ−− during T60 compared to T0 (figure 5(a)). The trend toward a raise of %sSEQ with the magnitude of the postural challenge was more evident than that of %cSEQ: indeed, the increment was significant during both T40 and T60 compared to T0 and detected by both %sSEQ+− and %sSEQ−+ (figure 5(b)).
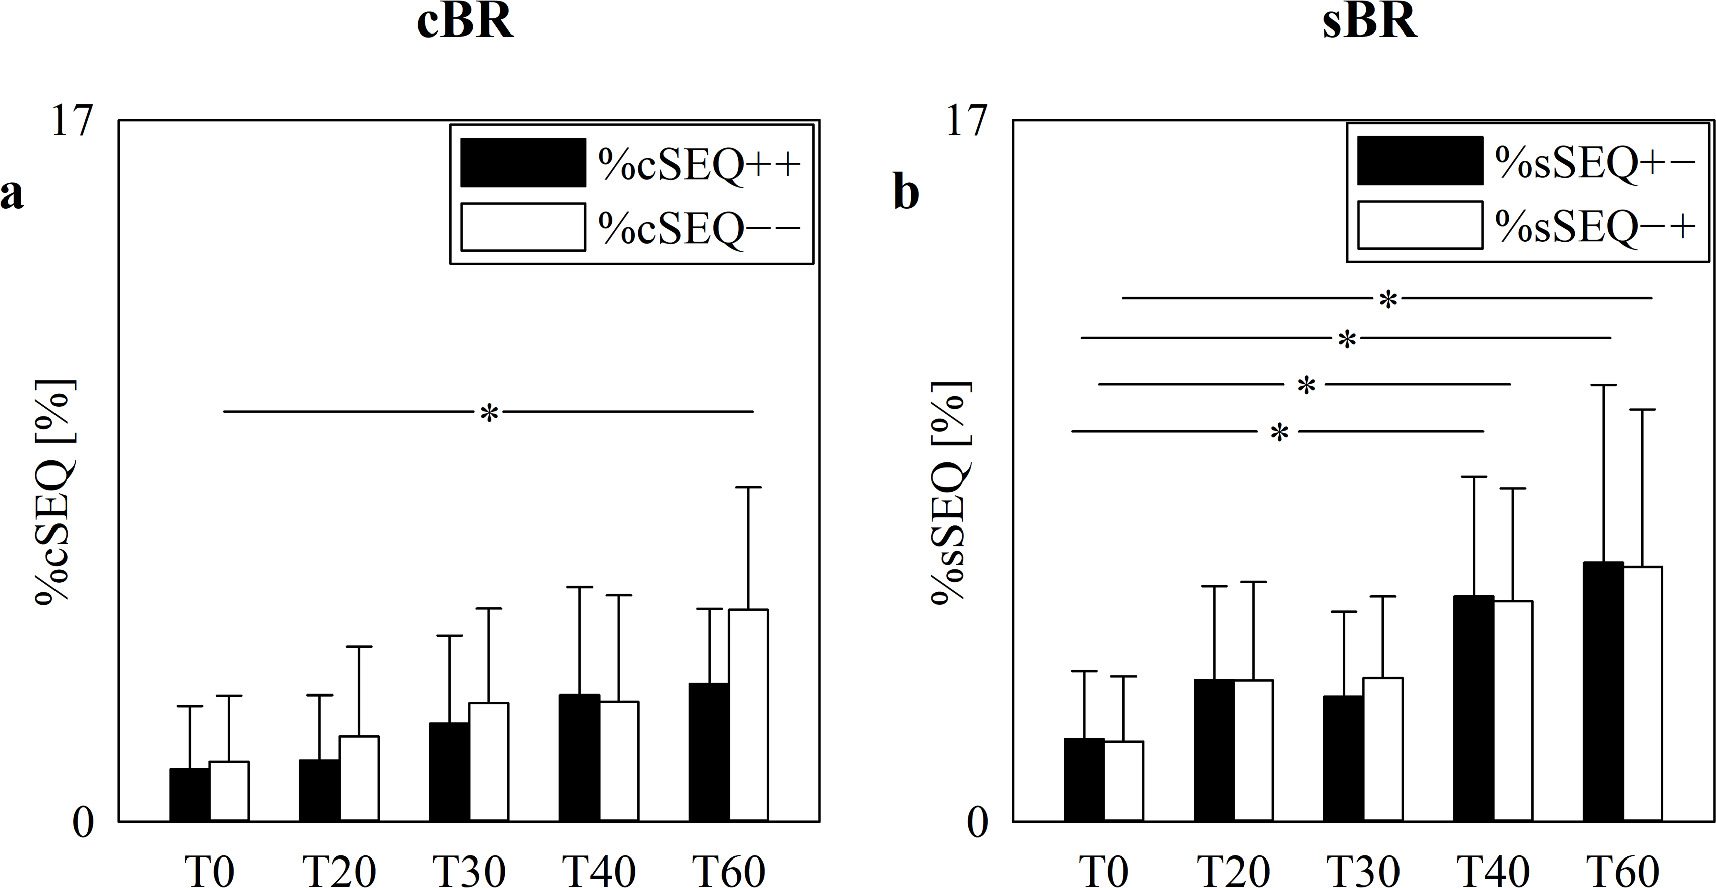
Figure 5. The vertical grouped error bar graphs show %cSEQ (a) and %sSEQ (b) in the incremental head-up tilt protocol as a function of the experimental condition (i.e. T0, T20, T30, T40 and T60). %cSEQ in (a) was divided into %cSEQ++ (black bars) and %cSEQ−− (white bars), while %sSEQ in (b) into %sSEQ+− (black bars) and %sSEQ−+ (white bars). Data are reported as mean+standard deviation. Two-way repeated measures analysis of variance (one-factor repetition, Holm–Sidak test for multiple comparisons) versus control, namely %cSEQ++ and T0 in (a) and %sSEQ+− and T0 in (b), is applied. The symbol * indicates p < 0.05 versus T0.
Download figure:
Standard image High-resolution imageThe scatterplots of figure 6 show the results of the linear correlation analysis of %cSEQ++ on %cSEQ−− (figure 6(a)) and of %sSEQ−+ on %sSEQ+− (figure 6(b)). %cSEQ++ and %cSEQ−− were found to be significantly correlated with r = 0.701 and p = 9.94 × 10⁻⁹, while %sSEQ+− and %sSEQ−+ were significantly associated with r = 0.78 and p = 1.46 × 10⁻¹¹. After removing pairs with values of %cSEQ−− or %cSEQ++ below the 2.5th percentile or above the 97.5th percentile of their distribution (n = 2), %cSEQ++ and %cSEQ−− were still significantly correlated with r = 0.602 and p = 9.65·10–6. The same procedure applied to the analysis of the correlation of %sSEQ−+ on %sSEQ+−, leading to the exclusion of 4 pairs, confirmed the significance of the correlation with r = 0.713 and p = 1.93 × 10⁻⁸.
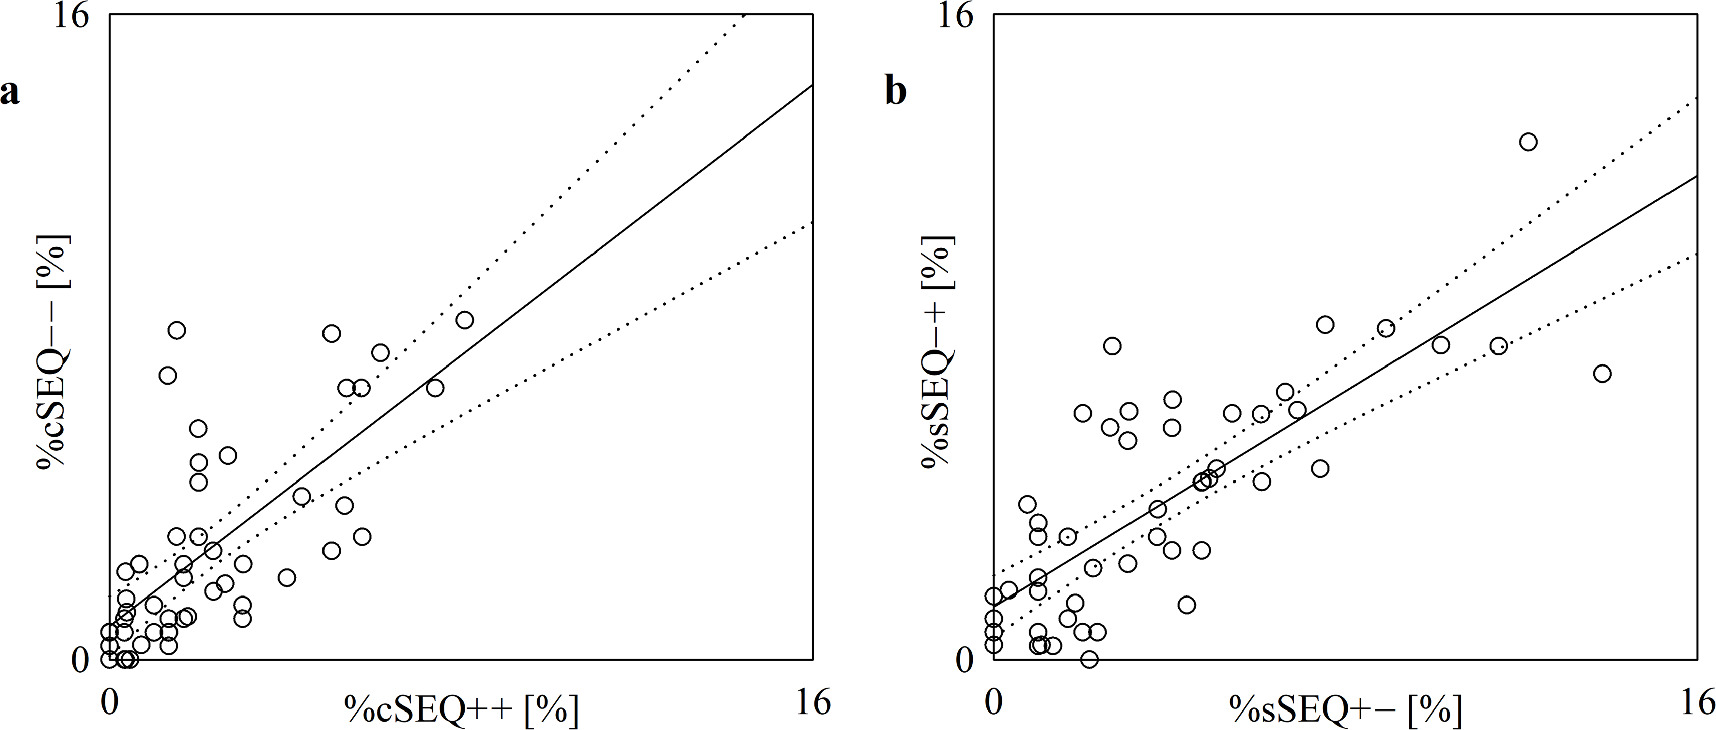
Figure 6. The scatterplot shows the results of the linear correlation analysis of %cSEQ−− on %cSEQ++ (a) and of %sSEQ−+ on %sSEQ+− (b) in the incremental head-up tilt protocol. Each open circle represents a (%cSEQ++, %cSEQ−−) and (%sSEQ+−, %sSEQ−+) pair computed in an assigned subject. Data are pooled regardless of the experimental condition (i.e. T0, T20, T30, T40 and T60). The linear regression line (solid line) and its 95% confidence interval (dotted lines) are shown as well because the Pearson product-moment correlation coefficient is different from 0 with p < 0.05.
Download figure:
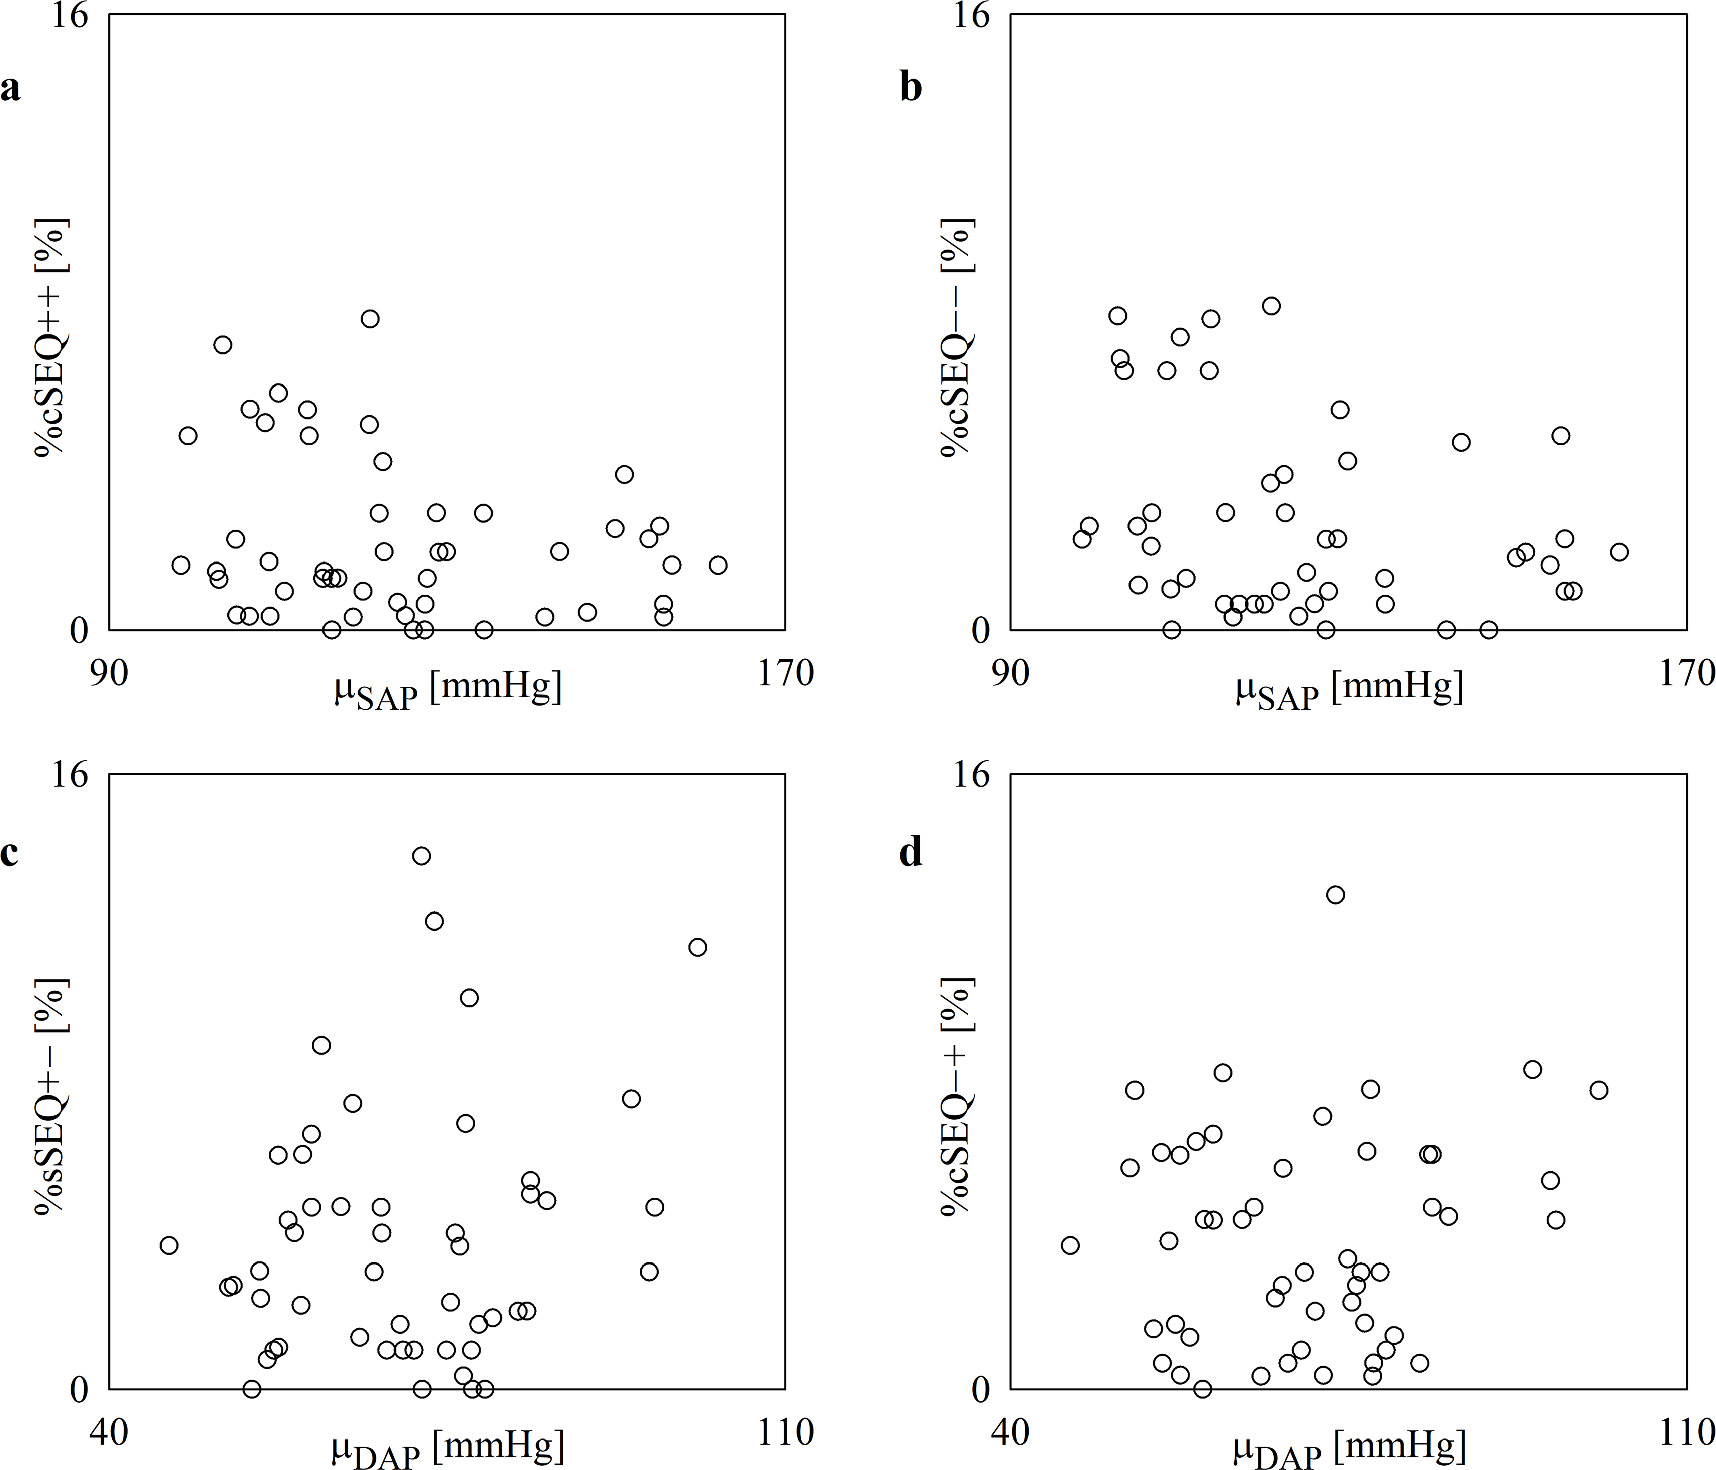
Standard image High-resolution imageThe scatterplots of figure 7 show the results of the linear correlation analysis of %cSEQ++ and %cSEQ−− on μSAP (figures 7(a), (b)) and of %sSEQ+− and %sSEQ−+ on μDAP (figures 7(c), (d)). The percentages of cardiac and sympathetic baroreflex patterns were not linearly correlated with the absolute AP value and this result held regardless of the cardiac and sympathetic baroreflex pattern types.
Figure 7. The scatterplot shows the results of the linear correlation analysis of %cSEQ++ (a) and %cSEQ−− (b) on μSAP, and of %sSEQ+− (c) and %sSEQ−+(d) on μDAP in the incremental head-up tilt protocol. Each open circle represents a (μSAP, %cSEQ++), (μSAP, %cSEQ−−), (μDAP, %sSEQ+−), and (μDAP, %sSEQ−+) pair computed in an assigned subject. Data are pooled regardless of the experimental condition (i.e. T0, T20, T30, T40 and T60). No significant association is detected via the Pearson product-moment correlation analysis with p < 0.05.
Download figure:
Standard image High-resolution image
4. Discussion
The main findings of the present study can be summarized as follows: (i) the SEQ method allows the separate evaluation of the degree of cardiac and sympathetic baroreflex involvement in controlling positive and negative AP variations; (ii) %cSEQ++ and %cSEQ−− decreased with age and increased with STAND and postural stimulus intensity; (iii) %sSEQ+− and %sSEQ−+ augmented with postural challenge magnitude; (iv) the level of cardiac and sympathetic baroreflex engagement did not depend on either the absolute value of arterial pressure or the direction of its changes.
4.1. SEQ method allows the evaluation of the degree of cardiac and sympathetic baroreflex involvement in controlling positive and negative AP variations
The baroreflex consists of several arms, all aiming at limiting AP variability with suitable modifications of various physiological variables (Karemaker and Wesseling 2008, Robertson et al 2012, Porta and Elstad 2020). For example, the cardiac and sympathetic arms of the baroreflex have as targets, respectively, the HP (Smyth et al 1969, Pickering et al 1972) and sympathetic traffic, the latter being usually characterized in humans via the total integrated value of MSNA, or MSNA burst amplitude or area, or probability of observing MSNA bursts associated with a cardiac beat in each bin of DAP (Sundlof and Wallin 1978, Ebert et al 1992, Kienbaum et al 2001, Hart et al 2010). The characterization of the baroreflex functioning is usually based on the assessment of baroreflex sensitivity defined as the variation of target variable per unit modification of an appropriate AP value. Originally, the evaluation of the baroreflex sensitivity requires the administration of a vasoactive drug evoking an important modification of AP (Smyth et al 1969, Pickering et al 1972, Ebert et al 1992, Rudas et al 1999, Hunt et al 2001, Tank et al 2005, Studinger et al 2007, Studinger et al 2009). The exploitation of spontaneous fluctuations of physiological variables allowed the estimation of the baroreflex sensitivity in absence of an artificial modification of AP and in more physiological conditions (Laude et al 2004, Sundlof and Wallin 1978, Kienbaum et al 2001). One of the most utilized techniques allowing the computation of the baroreflex sensitivity from spontaneous variability of physiological variables is the SEQ technique, originally proposed to typify the cardiac baroreflex (Bertinieri et al 1895) and adapted for the analysis of the sympathetic baroreflex (Marchi et al 2016b). The SEQ method is based on the definition of patterns of baroreflex origin and its search within the recorded variability series. This characterization makes possible the assessment of the strength of activation of the baroreflex via the percentage of baroreflex patterns (%SEQ): the greater the %SEQ, the more involved the baroreflex is in regulating a physiological variable. The %SEQ complements the baroreflex sensitivity given that the same value of baroreflex sensitivity can be obtained from different %SEQ values. In addition, the identification of the pattern of baroreflex origin allow one to separate the response of the target variability to AP rises and falls, namely, respectively, cSEQ++ and cSEQ−− in the case of the cardiac baroreflex and sSEQ+− and sSEQ−+ in the case of the sympathetic baroreflex, thus making more specific and more insightful the characterization of baroreflex functioning. It is worth noting that the degree of engagement of the baroreflex was assessed in the original papers via the computation of the total number of baroreflex sequences instead of using percent values because those studies considered baroreflex patterns of different lengths (Bertinieri et al 1985, Parati et al 1988). The possibility of assessing %SEQ is favored by a constant pattern length, namely L = 4 or 3 variations in the present study (Porta et al 2000, Marchi et al 2016b). The advantage of using %SEQ instead of the cumulative amount of the baroreflex patterns is that %SEQ is normalized between 0 and 100, thus becoming independent of the frame length. Differences between %SEQ and the cumulative amount of baroreflex patterns could explain the opposite conclusions about the effect of STAND that can be found in (Steptoe and Vogele 1990) compared to those of the present study.
4.2. %cSEQ++ and %cSEQ−− decreased with age while remaining balanced
It is well known that aging affects the cardiac baroreflex, given that its sensitivity decreases with age (Laitinen et al 1998, Rudas et al 1999, Jones et al 2003, Laitinen et al 2004, Fauvel et al 2007, Milan-Mattos et al 2018). SEQ analysis was able to detect this trend as well (De Maria et al 2019b). In addition, no cardiac baroreflex sensitivity differences were detected when cSEQ were separated into cSEQ++ and cSEQ−− and this finding held regardless of the age groups, even though the association of cardiac baroreflex sensitivity computed in response to SAP rises and falls with some asymmetric behaviors of HP variability (De Maria et al 2019b) suggested a more efficient ability of the cardiac baroreflex in limiting SAP elevations compared to drops (Pickering et al 1972, Eckberg 1980, Rudas et al 1999, Studinger et al 2007, Young et al 2008). However, no studies reported the trend of %cSEQ with age, especially when cSEQ++ and cSEQ−− were separately considered. The present study originally found that the degree of solicitation of the cardiac baroreflex, assessed via %cSEQ, decreased with age, even when cSEQ++ and cSEQ−− were separated. Accounting for posture did not modify conclusions on the impact of age given that we observed similar trends regardless of the direction of the AP variations. In addition, the proportion of cSEQ++ and cSEQ−− remained balanced, thus suggesting a similar level of involvement of the cardiac baroreflex in governing SAP rises and falls. This result suggests that the greater instability of the cardiac baroreflex observed in advanced age might be related to its reduced global degree of involvement more than a diminished activity of the cardiac baroreflex in reacting to SAP changes in a particular direction. The progressive decrease of the cardiac baroreflex involvement with age has been suggested by the gradual decrease with age of the HP-SAP squared coherence in the low frequency bands (Milan-Mattos et al 2018). However, cross-spectral analysis cannot investigate separately the responses of HP to positive and negative SAP variations, because it provides an average value of association computed over rising and falling portions of the sinusoidal oscillations forming the HP and SAP variability series.
4.3. %cSEQ++ and %cSEQ−− increased during postural stimuli while remaining balanced
It is well known that the cardiac baroreflex was affected by postural stimuli as suggested by the decrease of the cardiac baroreflex sensitivity during head-up tilt or active standing (Steptoe and Vogele 1990, Cooke et al 1999, Laitinen et al 2004, Porta et al 2016, De Maria et al 2018, Milan-Mattos et al 2018). The SEQ analysis detected the progressive decline of the cardiac baroreflex sensitivity toward 0 with tilt table inclination during incremental head-up tilt (Marchi et al 2016b, De Maria et al 2019a). This decline was evident regardless of the type of cardiac baroreflex patterns and no significant differences between cardiac baroreflex sensitivity computed over cSEQ++ and cSEQ−− were detected at any tilt table angle (De Maria et al 2019a). It is well known the %cSEQ increased with tilt table angles (Marchi et al 2016b, Porta et al 2016) likely as an effect of the engagement of the cardiac baroreflex to cope with the reduced venous return associated with the posture modification (Karemaker and Wesseling 2008, Robertson et al 2012, Porta and Elstad 2020). However, no studies reported the trend of %cSEQ with the magnitude of the postural challenge when cSEQ++ and cSEQ−− were separately considered. The present study originally found that the degree of cardiac baroreflex activation, assessed via %cSEQ, increased with tilt table angle, even when cSEQ++ and cSEQ−− were separated, thus suggesting an involvement of the cardiac baroreflex independent of the direction of the SAP variation. The relationship between %cSEQ++ and %cSEQ−− was also corroborated by the high correlation between the two variables. Remarkably, the increase of %cSEQ++ and %cSEQ−− compared to REST was observed during STAND in the aging protocol as well. The effect of STAND on %cSEQ was lost solely in 61–70 decade in keeping with a reduced response of the cardiovascular system to external stimulation in advanced age (Laitinen et al 1998, Rudas et al 1999, Jones et al 2003, Laitinen et al 2004, Fauvel et al 2007, Milan-Mattos et al 2018). Taken all the results together, the increase of %cSEQ++ and %cSEQ−− with an orthostatic challenge appears to be robust and could be utilized to detect the derangement of the cardiac baroreflex. Since a missing increase, or even a decrease, of the coupling strength between HP and SAP during a postural challenge is a distinctive feature of subjects prone to postural syncope (Ocon et al 2011, Bari et al 2017, Reulecke et al 2018, Porta et al 2023b), the possibility of separately analyzing the contribution of positive and negative SAP variations to the HP-SAP coupling strength appears to be particularly valuable. Indeed, orthostatic intolerance and baroreflex failure might be linked to a disproportionate response to SAP changes of different sign. The increase of the association between HP and SAP during head-up tilt was detected via cross-spectral analysis as well: indeed, the HP-SAP squared coherence in the low frequency band was positively linked with tilt table angles (Porta et al 2016), but this tool cannot separate the contribution of positive and negative SAP changes. Causal tools in the information domain assessing the degree of association in the specific time direction from SAP to HP provided similar conclusions (Porta et al 2011, Porta et al 2013b, Porta et al 2015, Bari et al 2017), but again its generalization to positive and negative SAP changes is less immediate than in the SEQ technique.
4.4. %sSEQ+− and %sSEQ−+ increased during incremental head-up tilt while remaining balanced
Head-up tilt decreased the sympathetic baroreflex sensitivity, namely it became less negative and migrated toward 0, and this decrement was significant in the case of prolonged head-up tilt (Ichinose et al 2006). This result was also confirmed by the SEQ analysis (Marchi et al 2016b, De Maria et al 2019a). Remarkably, a significant positive relationship between the sympathetic baroreflex sensitivity and the magnitude of the postural stressor was detected (Marchi et al 2016b). This trend was visible only on sympathetic baroreflex sensitivity computed over sSEQ−+, while it was absent over sSEQ+− (De Maria et al 2019a). The observed trend was compatible with the more negative values of sympathetic baroreflex sensitivity computed over sSEQ−+, compared to sSEQ+− (De Maria et al 2019a), thus stressing the more important ability of the sympathetic baroreflex to limit DAP drops with suitable increases of the MSNA burst rate (Sundlof and Wallin 1978, Studinger et al 2009, Hart et al 2011). This result is supported by the consideration that, while increasing the magnitude of the postural challenge, DAP exhibited a constant rise, and this induces an MSNA inhibition in proportion with tilt table angles (Marchi et al 2016b). It is well known that %sSEQ increased with tilt table angles (Marchi et al 2016b). The new finding of this study is that the proportion of sSEQ, when separated in sSEQ+− and sSEQ−+, increases at a similar pace, thus suggesting that the sympathetic baroreflex was activated equally by positive and negative DAP changes even though with a different sympathetic baroreflex sensitivity in the youngest group as demonstrated in (De Maria et al 2019a). The high correlation between the two variables supported the link between %sSEQ+− and %sSEQ−+. The notion that the sympathetic baroreflex is activated equally by positive and negative DAP variations is important because it suggests that, not only the decoupling between MSNA markers and DAP is one of the determinants of orthostatic syncope (Schwartz et al 2013, Barbic et al 2015), but also an imbalance of the proportions of the responses to positive and negative DAP variations might play a role.
4.5. %cSEQ and %sSEQ are independent of the AP mean value
In hypertensive patients, a high AP is associated with a reduced cardiac baroreflex sensitivity and scarce control of AP variability (Mancia et al 1986, Coats et al 1991, Ziegler et al 1995). It has been demonstrated that the cardiac baroreflex function depends on the level of AP given that the cardiac baroreflex sensitivity is inversely correlated with mean AP (Hesse et al 2007). Similarly, a dependence of the MSNA responses of the sympathetic baroreflex on AP rises and falls has been linked to DAP baseline levels (Incognito et al 2020) and took the form of a reduced possibility of increasing MSNA burst rate when DAP was high (Hart et al 2011). Since μSAP increases and %cSEQ decreases with age, even when cSEQ++ and cSEQ−− were separated, we would expect a significant inverse relationship between μSAP and %cSEQ++, or %cSEQ−−. This relationship might be suggested even by the decrease of the number of cardiac baroreflex patterns in hypertensive patients (Parati et al 1988). Contrary to our expectations, we found no association between μSAP and %cSEQ++, or %cSEQ−−. This result confirms the weak link of the cardiac baroreflex, when assessed over spontaneous variations, to the absolute value of AP, while its relevance in controlling dynamical fluctuations of SAP is stressed by the gradual increase of the %cSEQ++ and %cSEQ−− with the magnitude of the postural stimulus. Since a tendency toward a rise of μDAP (Marchi et al 2016b) and %sSEQ with tilt table angles was observed, even when sSEQ+− and sSEQ−+ were separated, we would expect a significant direct relationship between μDAP and %sSEQ+−, or %sSEQ−+. Contrary to our expectations, we found no association between μDAP and %sSEQ+−, or %sSEQ−+. This result confirms that even the sympathetic baroreflex, when evaluated over physiological variability, has little to do with DAP, while its relevance in controlling dynamical fluctuations of DAP is stressed by the gradual increase of %sSEQ+− and %sSEQ−+ during incremental head-up tilt. We attribute the discrepancies with the literature to the different methods utilized to characterize the behavior of the cardiac and sympathetic arms of the baroreflex, namely the pharmacological technique in Hesse et al (2007), Incognito et al (2020) and the static approach over spontaneous fluctuations in Hart et al (2011).
5. Conclusion
In the present study, we investigated for the first time the degree of solicitation of the cardiac and sympathetic arms of the baroreflex assessed via the SEQ method using %cSEQ and %sSEQ from spontaneous fluctuations of HP and SAP, and of MSNA burst rate and DAP by separately considering the direction of the SAP and DAP variations. The degree of engagement of the cardiac baroreflex was assessed at REST and during STAND in healthy subjects featuring different ages and in a young, healthy group undergoing incremental head-up tilt. The degree of solicitation of the sympathetic baroreflex was evaluated solely in the group undergoing incremental postural challenge. The results of the aging protocol showed that the degree of engagement of the cardiac baroreflex decreased with age and increased during active orthostatic challenge. The results of the incremental head-up tilt protocol showed that the degree of solicitation of the cardiac and sympathetic arms of the baroreflex progressively augmented with the magnitude of the passive orthostatic challenge. These results suggests that simple markers based on classification of patterns of baroreflex origin can be usefully exploited to detect the activation of different baroreflex arms and to quantify their degree of solicitation. In addition, we found that the degree of engagement of both arms of the baroreflex did not depend on the absolute AP values and the direction of their variations. This finding stresses the limited ability of the cardiac and sympathetic arms of the baroreflex in controlling absolute AP values and the equivalent ability of both positive and negative AP changes in activating them. The present findings call for the use of markers of baroreflex engagement derived from the SEQ technique to typify patients with orthostatic intolerance of various etiology and postural disturbances associated with the missing ability to induce suitable adjustments of heart rate and peripheral resistances. As a future development the size of the groups should be enlarged to assess whether the degree of solicitation of the baroreflex could be different between males and females.
Data availability statement
The data cannot be made publicly available upon publication because they contain sensitive personal information. The data that support the findings of this study are available upon reasonable request from the authors.
Author contributions
BDM and AP conceived and designed the research; JCM-M, VM , PR-S, ME, and EL performed experiments; BDM analyzed the data; BDM and AP drafted the manuscript; BDM and AP prepared the figures; BDM, LADV, VB, BC, FG, FP, ACMT, JCM-M, VM, PR-S, ME, EL, MB, AMC, and AP interpreted the results; BDM, LADV, VB, BC, FG, FP, ACMT, JCM-M, VM, PR-S, ME, EL, MB, AMC, and AP edited and revised the manuscript; BDM, LADV, VB, BC, FG, FP, ACMT, JCM-M, VM, PR-S, ME, EL, MB, AMC, and AP approved the final version of the manuscript.
Funding
No specific support was received for this research.
Conflict of interest
The authors declare that the research was conducted in the absence of any commercial or financial relationships that could be construed as a potential conflict of interest.