
Abstract
Objective. Upcoming missions of the National Aeronautics and Space Administration (NASA) to the Moon will include extensive human exploration of the lunar surface. Walking will be essential for many exploration tasks, and metabolic cost during ambulation on simulated complex lunar surfaces requires further characterization. In this study, ten healthy subjects (6 male and 4 female) participated in three simulated lunar terrain walking conditions at the NASA Johnson Space Center's planetary 'Rock Yard': (1) flat terrain, (2) flat terrain with obstacles, and (3) mixed terrain. Approach. Energy expenditure and gait were quantified with a wearable metabolic energy expenditure monitoring system and body-worn inertial measurement units (IMUs), respectively. Main results. It was found that participants walking on the mixed terrain, representing the highest workload condition, required significantly higher metabolic costs than in other terrain conditions (p < 0.001). Additionally, our novel IMU-based gait variables discriminated different terrains and identified changes in gait in simulated lunar terrain environments. Significance. Our results showed that the various surface irregularities and inconsistencies could cause additional physical effort while walking on the complex terrain. These findings provide insight into the effects of terrain on metabolic energy expenditure during simulated lunar extravehicular activities.
Export citation and abstract BibTeX RIS

Original content from this work may be used under the terms of the Creative Commons Attribution 4.0 licence. Any further distribution of this work must maintain attribution to the author(s) and the title of the work, journal citation and DOI.
1. Introduction
The Artemis Lunar program plans to return humans to the lunar surface, establishing a long-term presence on the Moon and enabling future exploration missions. During lunar extravehicular activities (EVAs), walking and exploring various terrains and slopes will be among the most common tasks (Smith et al 2020). Walking on the lunar surface is a challenging environment because of reduced gravity (1/6 g), limited mobility due to the spacesuit, and low phase angle of sunlight that can result in significant disorientation (Heiken et al 1991).
Twelve Apollo astronauts walked on the lunar surface, and most of them adopted a hopping 'lunar gait' as a preferable way to move on the lunar surface. They reported that heel-to-toe 'Earth gait' was more challenging and energy-consuming under the 1/6 g due to the limited mobility of the Apollo spacesuit (Heiken et al 1991). Unlike Apollo astronauts who never experienced steep slopes, crater walls, or steep hills, Artemis astronauts will explore more of the non-uniform lunar surface than ever before. Moreover, the next-generation exploration spacesuits will provide Artemis astronauts with an improved range of motion (Ross et al 2018, Bekdash et al 2020) and may allow a more natural gait. Although it is unclear if the Apollo hopping gait will still be the best walking strategy for the lunar surface, Artemis astronauts may need to utilize 'Earth gait' on complex terrain to prioritize safety over using the least energy-consuming gait mechanics. Accurately estimating these energy expenditure costs across various lunar walking scenarios will be necessary for mission planning and for determining required spacesuit consumables. However, the effect of how terrain, and resulting gait adaptation, impacts metabolic cost under simulated and actual lunar surface conditions is not well understood.
Traditionally, physiological changes while walking have been quantified in laboratories located in clinical environments and research facilities with simulated rough terrain or outdoor conditions (Lejeune et al 1998, Starholm et al 2010, Voloshina et al 2013, Panizzolo et al 2017, Padulo et al 2023). Recently, the availability of portable and body-worn sensing systems allows shifting the analysis to real-world terrains. For example, portable methods for assessing energy expenditure outside the laboratory are becoming more widely used (Toulouse et al 2022). Also, it was reported that the foot's path and placement measured from foot-mounted wireless inertial measurement units (IMUs) can be used to roughly predict metabolic cost and reasonably discriminate between outdoor surfaces (e.g. sidewalk versus dirt, gravel versus grass) (Kowalsky et al 2021). However, there is also a need for adaptive control of dynamic balance as well as proper foot placement to maintain stable ambulation while walking on uneven terrain (Vervoort et al 2020). The upper body lateral sway may increase as a result of randomly changing foot placement to avoid obstacles on the ground. Understanding adaptive control during walking on uneven terrain, therefore, requires an understanding of changes in the variables that can influence lateral sway of the upper body. Additionally, although it is clear that walking on uneven terrain causes gait modification and requires more energy, there is relatively little data on how the energetics can be quantified during walking on simulated lunar terrains using wearable solutions. Investigating these mechanisms could be helpful not only for increasing the understanding of adaptation strategies of the musculoskeletal system on simulated complex lunar surfaces but also for predicting metabolic burden in variable terrains (Faraji et al 2018). Consequently, there is a need for a comprehensive characterization of the metabolic cost of walking by combining upper body dynamics and foot clearance (or occasionally with body weight support).
In this study, we aimed to quantify gait on simulated lunar terrains to compare the metabolic cost of walking on those different terrain conditions. Specifically, we examined how the body-worn IMU metrics of dynamic upper body sway and gait regularity change to different terrains with irregularly placed obstacles and how these changes affect energy expenditure. We hypothesized that natural strategies used to maintain stability and adapt to different walking environments or terrain conditions would affect gait and energy expenditure. The results from this analysis will help determine the physical workloads associated with the lunar surfaces and to quantify the interdependencies between terrain and crew capabilities.
2. Methods
2.1. Subjects
Ten healthy adult subjects (6 male and 4 female, mean age ± standard deviation [SD]: 37.7 ± 9.7 years, mean height ± SD: 170.8 ± 12.9 cm, mean weight ± SD: 76.7 ± 14.3 kg) were recruited to partake in the study at National Aeronautics and Space Administration (NASA) Johnson Space Center (JSC). Subjects in this study were recruited from the NASA test subject facility, were required to pass a modified class III physical, and were physically active healthy adult volunteers representative of the astronaut population. Written informed consent was provided by all subjects before enrollment, and the study was approved by the NASA JSC Human Subjects Institutional Review Board.
2.2. Testing environment and equipment
The Lunar terrain consists of rocks, boulders, hills, and craters generated by meteoritic impacts, and the surface is covered by a soil-like layer above the bedrock (Heiken et al 1991). The 'Rock Yard' at JSC provides a multi-acre test area that simulates general features of the lunar surface terrain environments (figure 1). The Rock Yard allows for smaller, leaner evaluations of science sampling tools, tool and sample management, and operations for conducting science during EVA excursions on lunar surface missions. The Rock Yard consists of four distinct simulated regions: Shallow Craters; Sand Dunes; Hill; and Rock Field. 'Shallow Craters' is a region with one larger crater (∼18 m inner diameter) and two smaller craters, consisting of gravel. 'Sand Dunes' is a soft sand dune area of ∼42 × 42 m, with a few, short, beach-type dunes. 'Hill' is a mound of earth covered with gravel and coarse sand, with a sloped hill (∼15 degree grade and a maximum altitude of ∼9 m) leading up to a flat region at the apex, with a driving area of ∼30 × 6 m. 'Rock Field' is a flat field (∼40 × 40 m) strewn with volcanic rocks/boulders, ranging from fist-sized to ∼0.9 m in diameter. In this study, subjects underwent testing in three terrain conditions in random order: (1) walking on 'flat terrain' (Shallow Craters region), (2) walking on 'flat terrain with obstacles' (Rock Field region) and (3) walking on 'mixed terrain' (Sand Dunes and Hill region). Figure 1 shows the path taken along the terrain. Flat terrain consisted of the path as flat as possible to represent the low workload condition (green dashed line). The path for flat terrain with obstacles was chosen in Rock Field only (red dashed line). Mixed terrain included three craters, sand dunes, and a sloped hill (yellow dashed line).
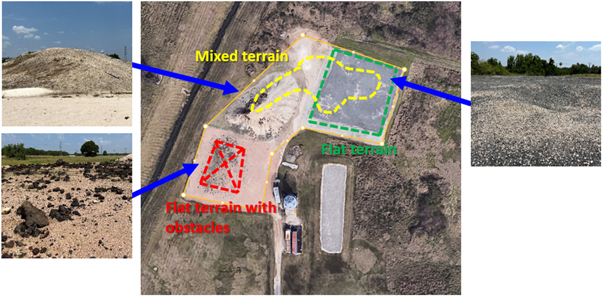
Figure 1. A. Overall layout of the Rock Yard and path along the terrain (colored dashed lines) (photo credit: NASA).
Download figure:
Standard image High-resolution imageSubjects were instrumented with the K5 wearable metabolic system (COSMED, Rome, Italy) and five wireless Opal IMUs (APDM, Portland, OR, USA). The K5 is a battery-operated and wireless metabolic system measuring gas exchange breath-by-breath. The Opal IMU is a wireless motion capture sensor about the size of a wristwatch, including triaxial accelerometers, gyroscopes, and magnetometers. All wearable systems were calibrated prior to each use. For each test condition, subjects were tasked with navigating and traversing the terrain continuously with durations up to 20 min at a self-paced walking speed. Metabolic rate data were monitored continuously via a wirelessly connected laptop throughout each run. Once the metabolic steady state was reached (changes ≤10% in 30 s), the test conductor started a timer for 30 s. After this time, the test condition concluded, and the subject was prescribed a period of rest and recovery before starting the following condition.
2.3. Energy expenditure
The K5 metabolic system (figure 2) collected volumes of oxygen and carbon dioxide (i.e. VO2 and VCO2) (ml min−1) by taking an average of the breaths over 10 s intervals. Then, using the Peronnet equation (Peronnet and Massicotte, 1991, Kipp et al 2018), we calculated energy expenditure (BTU h−1) as follows:

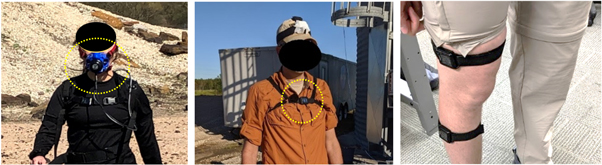
Figure 2. Instrumentation (left: K5 metabolic system, middle: chest IMU, right: lower limb IMUs).
Download figure:
Standard image High-resolution image
The K5 metabolic system is a valid and reliable system for metabolic measurements across a variety of walking speeds (Guidetti et al 2018, Perez-Suarez et al 2018, Toulouse et al 2022), and the built-in GPS can also be used to determine walking speed (km h−1) (Maddison and Mhurchu 2009).
2.4. Gait variables
Five Opal IMUs were placed on the subject, including one on the chest and four on the lower limb segments (left and right thighs, left and right shanks), recorded 3-axis accelerations (g) and 3-axis angular velocities (degree/second) with a 120 Hz sampling rate (figure 2). In this study, IMU-based gait variables included (1) step-by-step upper body sway displacement (cm), (2) segmental symmetry score (SSS, %), (3) segmental repeatability score (SRS, %), and (4) stride time (s).
The step-by-step upper body sway displacement variable was determined by estimating the lateral sway displacement of the trunk from the IMU on the chest (Kim et al 2018a, 2018b, Kim et al 2019). The maximum amplitude of lateral sway displacement per stride during walking was measured. Specifically, the IMU data was first processed through an attitude and heading system (Madgwick et al 2011) to calculate the orientation of the IMU relative to the Earth. The resultant measurement of acceleration was then double-integrated to yield displacement, also including high-pass filtering of the resulting velocity and position respectively to remove any drift. The resultant position tracking can track the oscillatory motion of the chest IMU but slowly pulls the IMU back to the origin when it is stationary. An increase in the metric may indicate that terrain becomes more challenging or a subject needs increased body sway to maintain stability control.
Gait regularity can be evaluated by the SSS, similarity of contralateral steps (i.e. gait symmetry across both lower limbs) and the SRS, similarity of consecutive strides (i.e. repeatability within a single lower limb). Specifically, the definition of gait symmetry is the similarity of sagittal angular velocities of the thighs and shanks between contralateral strides during walking, and gait repeatability is the similarity of sagittal angular velocities of the thighs and shanks from consecutive strides of the same lower limb during walking (Clemens et al 2020). The gait scores (SSS and SRS) were calculated as follows: score = 100 − (100 ∗ x/y) (%) where x is the average values of angular velocity difference-symmetry or -repeatability, and y is the threshold of symmetry or repeatability level, respectively (Clemens et al 2020). The scores can represent gait outcomes from 0% to 100% as gait symmetry and repeatability measures. An SSS equal to 100% is the highest possible symmetry between limbs, and an SRS equal to 100% is the highest possible repeatability within the same limb. Periodic changes to SSS and/or SRS over time may indicate a changing terrain as unexpected and random gait strategies may be needed to maintain continuous stability and safety during walking on uneven terrain. For the SSS and SRS variables, the sagittal plane angular velocities from the gyroscope of Opal IMUs donned on each lower-limb segment were measured.
Finally, stride time was calculated using mid-swing gait events detected from the maximum peaks of the sagittal shank angular velocity waveform (Allseits et al 2019). IMU data were processed using MATLAB software (MathWorks, Natick, MA, USA).
2.5. Statistical analysis
Generalized estimating equation (GEE) models were used to assess the influence of terrain conditions on variables. GEE models addressed the repeated measures within individuals, and robust standard errors were used to address the non-homogeneous variance. For variables measured by the independent side (left or right), the nesting of the side within a person was included in the GEE model random effects. Expected marginal means were used to estimate condition-level mean response. When the overall F-test was significant for differences amongst conditions, pairwise comparisons were conducted on the marginal mean differences. Statistical analyses were conducted in SAS v9.4 (SAS Institute, Cary, NC, USA) using the GLIMMIX procedure (Schabenberger 2005). Marginal means were estimated and compared with the least squares means (LS-Means) statement. For gait regularity measures on the percent scale (%), those were modeled through beta regression after converting to a proportion (/100).
3. Results
The mean and standard error values of all dependent variables are presented in table 1. Table 2 shows between-conditions comparisons. In the field of developing thermal heat offloading characteristics and requirements for the spacesuit portable life support system, our general practice is to express energy expenditure in BTU h−1 as an engineering unit.
Table 1. Mean and standard error of energy expenditure and gait variables for all 10 subjects walking under three terrain conditions: flat terrain, flat terrain with obstacles, and mixed terrain.
| Condition | |||
|---|---|---|---|
| Metric | Flat terrain | Flat terrain with obstacles | Mixed terrain |
| Energy expenditure | 1311 (135) (BTU h−1) 331 (34) (kcal h−1) | 1439 (183) (BTU h−1) 363 (46) (kcal h−1) | 2071 (207) (BTU h−1) 522 (52) (kcal h−1) |
| Segmental symmetry score thigh | 0.98 (0.00) | 0.97 (0.00) | 0.95 (0.01) |
| Segmental symmetry score shank | 0.97 (0.01) | 0.96 (0.01) | 0.93 (0.02) |
| Segmental repeatability score thigh | 0.93 (0.01) | 0.84 (0.02) | 0.65 (0.01) |
| Segmental repeatability score shank | 0.92 (0.01) | 0.85 (0.02) | 0.68 (0.01) |
| Upper body sway displacement (cm) | 7.14 (0.52) | 8.91 (0.65) | 9.49 (0.45) |
| Walking speed (km h−1) | 5.18 (0.18) | 4.96 (0.32) | 4.84 (0.22) |
| Stride time (s) | 1.14 (0.02) | 1.20 (0.03) | 1.14 (0.02) |
Table 2. Comparison of different walking conditions for energy expenditure and gait variables.
| Metric | Condition | Condition | Estimate | Pr > |t| | Lower | Upper |
|---|---|---|---|---|---|---|
| Energy expenditure (BTU h−1) | Flat terrain | Mixed terrain | −759 | <0.0001 | −918 | −601 |
| Flat terrain | Flat terrain with obstacles | −128 | 0.1280 | −296 | 41 | |
| Mixed terrain | Flat terrain with obstacles | 631 | <0.0001 | 453 | 810 | |
| Segmental symmetry score thigh | Flat terrain | Mixed terrain | 0.81 | 0.0032 | 0.31 | 1.31 |
| Flat terrain | Flat terrain with obstacles | 0.26 | 0.0643 | −0.02 | 0.54 | |
| Mixed terrain | Flat terrain with obstacles | −0.55 | 0.0045 | −0.91 | −0.19 | |
| Segmental symmetry score shank | Flat terrain | Mixed terrain | 0.80 | <0.0001 | 0.50 | 1.10 |
| Flat terrain | Flat terrain with obstacles | 0.10 | 0.5037 | −0.20 | 0.39 | |
| Mixed terrain | Flat terrain with obstacles | −0.71 | <0.0001 | −0.96 | −0.45 | |
| Segmental repeatability score thigh | Flat terrain | Mixed terrain | 1.90 | <0.0001 | 1.68 | 2.13 |
| Flat terrain | Flat terrain with obstacles | 0.84 | <0.0001 | 0.54 | 1.15 | |
| Mixed terrain | Flat terrain with obstacles | −1.06 | <0.0001 | −1.32 | −0.80 | |
| Segmental repeatability score shank | Flat terrain | Mixed terrain | 1.65 | <0.0001 | 1.46 | 1.85 |
| Flat terrain | Flat terrain with obstacles | 0.66 | <0.0001 | 0.36 | 0.95 | |
| Mixed terrain | Flat terrain with obstacles | −1.00 | <0.0001 | −1.22 | −0.77 | |
| Upper body sway displacement (cm) | Flat terrain | Mixed terrain | −2.34 | <0.0001 | −3.00 | −1.68 |
| Flat terrain | Flat terrain with obstacles | −1.77 | 0.0002 | −2.55 | −0.99 | |
| Mixed terrain | Flat terrain with obstacles | 0.57 | 0.2171 | −0.37 | 1.52 | |
| Walking speed (km h−1) | Flat terrain | Mixed terrain | 0.34 | 0.0010 | 0.16 | 0.53 |
| Flat terrain | Flat terrain with obstacles | 0.22 | 0.3959 | −0.31 | 0.76 | |
| Mixed terrain | Flat terrain with obstacles | −0.12 | 0.6055 | −0.61 | 0.36 | |
| Stride time (s) | Flat terrain | Mixed terrain | 0.004 | 0.6659 | −0.02 | 0.02 |
| Flat terrain | Flat terrain with obstacles | −0.05 | 0.0021 | −0.09 | −0.02 | |
| Mixed terrain | Flat terrain with obstacles | −0.05 | 0.0009 | −0.09 | −0.03 |
3.1. Energy expenditure
Energy expenditure was compared to verify whether walking on different terrains caused a change in physical workload. Statistically significant differences in steady-state metabolic rate were found between flat terrain and mixed terrain (p < 0.001) and between flat terrain with obstacles and mixed terrain (p < 0.001); however, there was no significant difference between flat terrain and flat terrain with obstacles (p = 0.13). This finding suggests that subjects who traversed the mixed terrain consumed significantly more energy than the flat terrain (with or without obstacles) conditions.
3.2. Segmental symmetry and repeatability scores
Regarding the SSS thigh and shank variables, there were also significant differences between flat terrain and mixed terrain (thigh: p = 0.003, shank: p < 0.001) and between flat terrain with obstacles and mixed terrain (thigh: p = 0.005, shank: p < 0.001). However, no differences were found between flat terrain and flat terrain with obstacles in SSS variables (thigh: p = 0.064, shank: p = 0.5). Significant differences were exhibited in all terrain conditions when comparing the performance of segmental repeatability (p < 0.001). Together, these results suggest that subjects demonstrated asymmetric and irregular gait on the mixed terrain. The SSS and SRS values decreased as the energy expenditure value in the relationship increased and vice versa. Conceptually, this suggests that as subjects traversed the simulated lunar environments, their steady gait was disrupted due to the various surface irregularities and inconsistencies, thus requiring additional physical effort to maintain stability while walking.
3.3. Upper body sway displacement
Statistically significant changes in the upper body sway displacement parameter were found between flat terrain and mixed terrain (p < 0.001) and between flat terrain and flat terrain with obstacles (p < 0.001); however, no significant difference was found between flat terrain with obstacles conditions and mixed terrain (p = 0.217). This result showed that walking on mixed terrain and surface with obstacles caused a significant increase in upper body sway to maintain dynamic stability across uneven ground.
3.4. Typical gait variables: walking speed and stride time
Temporal gait parameters (e.g. walking speed and stride time) are classically reported values used to describe someone's gait. Walking speed was found to be significantly different between conditions flat terrain and mixed terrain (p = 0.001); however, no significant difference was found between conditions flat terrain and flat terrain with obstacles (p = 0.396) and flat terrain with obstacles and mixed terrain (p = 0.606). However, stride time was not found to be significantly different between flat terrain and mixed terrain (p = 0.666), but it was significantly different between flat terrain and flat terrain with obstacles (p = 0.002) and flat terrain with obstacles and mixed terrain (p < 0.001). These results indicate that the addition of obstacles or difficult terrain features may alter the time taken to safely navigate obstacles.
4. Discussion
One of the aims of the Artemis program is to return humans to the Moon to explore diverse locations that will require human exploration of crater walls, steep hills, and challenging terrains that may increase the metabolic burden of locomotion. Prior research in the Earth gravitational environment (1 g) has shown that when terrain becomes more complex or includes obstacles, subjects modify their gait dynamics (Kowalsky et al 2021), guided foot placement by tilting their heads down and visually observing steps (Bejek et al 2006), and/or relying on somatosensory inputs to maintain balance during walking (Matthis et al 2018). Notably, all of these changes can be associated with increased energy consumption (Rogers et al 2008, Kowalsky et al 2021). We simulated general features of the lunar surface terrain environments and used the variables of gait regularity and lateral trunk sway to observe the effect of lunar surface ambulation irregularities and inconsistencies, which were shown to require additional metabolic consumption. In this study, we found that participants' gait and balance were disrupted while walking on the mixed terrain due to the various surface irregularities and inconsistencies, thus this activity required additional physical effort to maintain walking stability.
When healthy adults walk on flat terrain in the 1 g condition, they generally create similar, repetitive lower limb motions with a small lateral trunk sway to minimize energy expenditure (Kowalsky et al 2021). However, this regularity is usually compromised in pathological gait or because of an underlying impairment or limb loss (Clemens et al 2020); thus, assessing gait variability has been considered a tool for evaluating qualified locomotion and determining the effects of therapeutic interventions. The results from this study showed that both SSS and SRS variables were significantly altered to meet the demands of walking on mixed terrain at the JSC Rock Yard. The mixed terrain, which included hills, craters, and other obstacles, demanded a more adaptive and changeable gait. An increase in dynamic upper body sway was also observed while traversing the mixed terrain, indicating that subjects needed greater body sway to maintain stability. Moreover, SRS variables were significantly different between flat terrains with no obstacles and flat terrains with obstacles; however, there was no significant difference in SSS. Although the presence of obstacles on flat terrain increased walking variability, as seen in the decreased repeatability between consecutive strides, subjects efficiently identified the locations of safe footholds to maintain their current, altered gait, resulting in a symmetrical pattern throughout an individual gait cycle comparable to flat ground walking with no obstacles. No significant difference between walking in mixed terrain and on flat terrain with obstacles was found in dynamic upper body sway, although both SSS and SRS variables were different. Although subjects placed their feet carefully to maintain regular gait patterns, increased upper body sway may still be needed to maintain the line of gravity of a body within the base of support on uneven ground.
Likewise, we observed that energy expenditure significantly increased while walking on mixed terrain compared to the other walking conditions. Specifically, energy expenditure in the mixed terrain condition was 58% and 44% greater than the flat terrain and flat terrain with obstacles conditions, respectively. Although the mixed terrain consisted of more variability including hills, craters, and other obstacles than other conditions, the time to reach a steady state after the initial increase was relatively consistent among subjects (mean time ± standard deviation = 6.72 ± 0.92 min, min = 4.9, max = 8.02). Next, there was no observed significant difference in energy expenditure between the flat terrain and flat terrain with obstacles. However, limited visibility and reduced somatosensory response inside a spacesuit may require additional challenges and increase the metabolic cost significantly in the obstacle-added terrain. For example, the geometry of the helmet, the position of the display and control unit on the spacesuit or an object carried by the crewmembers may all interfere with full-range downward visual perception. Additionally, walking on non-uniform surfaces may be further challenged by long-duration spaceflight-induced decrements in fitness and sensorimotor performance (Kim et al 2018a). The additional strain of the suit (weight, stiffness, pressure) on the body movements would also increase energy expenditure in lunar (1/6 g) and Mars (3/8 g) gravitational environments and terrains (e.g. walking up a slope and over rocks). Analog studies have reported that ambulation in a pressurized spacesuit under simulated lunar and Mars gravity is a physically demanding task (Vos et al 2007). Therefore, it is also essential to investigate and quantify changes in gait in planetary EVA training environments with a spacesuit.
There was a difference in walking speed between flat and mixed terrain walking but not between flat terrain and flat terrain with obstacles. While walking speed did not significantly vary between flat terrain and flat terrain with obstacles, the standard error in the flat terrain with obstacles condition increased by 84%. This could be due to the fact that the flat terrain with obstacles condition involved starting, stopping, and changing speeds due to obstacles and contributed to significantly deteriorated SRS variables. Interestingly, there was no significant difference in stride time between flat terrain and mixed terrain. Both typical gait parameters, walking speed and stride time, could not distinguish differences in terrain in comparison to the SRS variables. Neither typical gait parameters could be matched with the changes in energy expenditure variables depending on terrain conditions when compared to the SSS variables.
We acknowledge several limitations of the present study. The primary objectives of our test series were to characterize the voluntary metabolic rate and gait parameters during EVA-like traverses and to provide preliminary analysis to either manipulate parameters to match metabolic rate across analog environments or apply correction factors to adjust for differences. The JSC Rock Yard was one of the multiple simulated lunar surface environments investigated as part of this test series, and comparisons between test environments were prioritized with small sample sizes (n = 10) which may produce inconclusive results (Billingham et al 2013). Nevertheless, the metabolic expenditures and changes in gait between terrain conditions at the Rock Yard provided valuable insights, and additional field testing and simulated lunar surface ambulation will further investigate these relationships. Future work should investigate estimating workloads during the traverse in the Rock Yard or alternative field tests with a spacesuit simulator (Hew et al 2023). Future work is also needed to characterize the workload of ambulating in simulated lunar and Mars environments while wearing a spacesuit and apply it to workload modeling and prediction efforts. NASA is developing a Crew State and Risk Model, which is a physiological signal-based modular framework of individual models intended to provide prediction and real-time monitoring of crew physical and cognitive state and associated risk implications during the execution of EVAs. Gait and balance variation measured from IMUs can be integrated with the traverse model to provide estimated metabolic rate, inspired carbon dioxide, consumables usage, and other crew state and life support predictions depending on changes in terrain information (e.g. terrain slope, roughness). Including gait metrics from IMUs might estimate physical workload and related crew status sooner than other physiological data and improve energy expenditure estimations during time-varying activities (Slade et al 2021).
5. Conclusion
Lunar activities will occur in complex terrains; thus, it is vital to conduct EVA simulations and monitor the changes in gait and physical states of crewmembers in various lunar walking scenarios. In this study, applying wearable technology, we verified that walking on 1 g, simulated lunar terrain caused a significant change in physical workload. We also identified that the gait regularity and upper body sway parameters are more sensitive than total energy expenditure in discriminating between different terrain environments. Wearable technologies can be essential tools in planetary EVA simulations that aid in characterizing physical workloads for future lunar EVAs, inform crewmembers of potentially hazardous movements, and allow the prediction of metabolic burden. These functions will be necessary for future autonomous operations and decision-making when communication delays prevent real-time communications with mission control, as with missions to Mars.
Data availability statement
The data cannot be made publicly available upon publication because they contain sensitive personal information. The data that support the findings of this study are available upon reasonable request from the authors.
Trademark statement
Trade names and trademarks are used in this journal article for identification only. Their usage does not constitute an official endorsement, either expressed or implied, by the National Aeronautics and Space Administration.