
Abstract
Objective: Phase angle (PA), a bioelectrical impedance analysis (BIA) parameter, has proven to be a proxy of body cell mass in athletes, but very few data are available on its segmental evaluation (upper and lower limbs). Therefore, we aimed to assess whether whole-body and segmental PA varied among elite male athletes of different sports and compared these to control groups. Additionally, we investigated its relationship with anthropometric and body composition parameters. Approach: Elite athletes practicing cycling, water polo and ballet dance aged 18–40 years underwent anthropometric and BIA measurements. PA (whole-body and upper and lower limbs) was considered as raw BIA variable. Data were also compared with healthy subjects with similar characteristics who served as control groups. Main results: Participants included three groups of male athletes: 18 cyclists (age 28.6 ± 3.4 years; weight 70.6 ± 5.4 kg; BMI 21.5 ± 1.4 kg m2), 20 water polo players (age 23.9 ± 4 years; weight 89.0 ± 5.2 kg; BMI 25.9 ± 1.9 kg m2) and 18 ballet dancers (age 19.2 ± 1.3 years; weight 63.3 ± 5.8 kg; BMI 20.8 ± 1.0 kg m2) and three groups of healthy control subjects each of which similar for general characteristics (one to one) to the previous ones. Both whole-body and limb PAs were significantly higher in athletes compared to their respective controls, whereas no differences were found among sport groups. PA was positively correlated with BMI and fat-free mass (FFM) more in athletes than in controls and FFM was the main determinant. Significance: PA may represent a useful proxy parameter of soft tissue mass quality, directly related to physical activity level. Furthermore, the direct evaluation of segmental PA among athletes practicing different sports may be useful for assessing and monitoring the differences among athletes and changes due to training.
Export citation and abstract BibTeX RIS

Original content from this work may be used under the terms of the Creative Commons Attribution 4.0 license. Any further distribution of this work must maintain attribution to the author(s) and the title of the work, journal citation and DOI.
1. Introduction
Assessing body composition (BC) in the field of sport has proven to be crucial in detecting individual characteristics critical to performance, evaluating the effects of training and managing weight strategies in weight-category sports (Turnagöl 2016, Fields et al 2018, Sonksen 2018). Therefore, its evaluation may interest athletes involving in different sport disciplines, because of their different training programs and energy requirements. Bioelectrical impedance analysis (BIA) is a portable, non-invasive, easy-to-use and inexpensive method widely used in the field of sport for assessing BC by means of predictive equations (Moon 2013). Specifically, BIA measures impedance (Z), the opposition of the body to an alternating current resulting from resistance (R) and reactance (Xc), while phase angle (PA) is identified as the arctangent of the Xc to R ratio (Norman et al 2015).
An increasing amount of evidence has focused on the health significance of raw bioimpedance data. PA has gained attention because it has proven to be a proxy of water distribution (extracellular/intracellular water ratio) and body cell mass (BCM) (Campa et al 2020, Marini et al 2020). Thus, high PA suggests greater cellularity (e.g. more BCM relative to fat-free mass (FFM)), cellular integrity and adequate cell functions (Norman et al 2012, Stobäus et al 2012, Beberashvili et al 2014, Zhang et al 2014). While several studies have evaluated PA in the clinical setting, fewer (Carrasco-Marginet et al 2017, Silva et al 2019, Di Vincenzo et al 2019) have explored its role in sport, as a helpful proxy parameter in evaluating changes in water distribution and in monitoring FFM hydration status.
PA values varies depending on gender, age or BMI ranging in healthy subjects from 5 to 7.5 degrees (Kyle et al 2001, Barbosa-Silva et al 2005, Bosy-Westphal et al 2006), whereas in trained athletes it may reach 8.5 degrees (Marra et al 2016). In this context, a recent systematic review evaluated the variability of PA among athletes and its relationship with sports performance (Di Vincenzo et al 2019). Only a few studies showed that PA was higher in athletes vs controls and it appears still uncertain to what extent PA differs among various sports. Additionally, there were no clear relationships of PA with sport performance or the level of training. Moreover, although these investigations reported data on whole-body PA values, to date, limited data are available concerning the segmental assessment (whole-body and limbs) that in the field of sport could be useful for assessing differences among athletes and slight variations due to training in specific body segments.
Cycling, water polo and ballet dance are very different sport specialties and the type of physical exercise and training varies among these disciplines. To the best of our knowledge, no studies have examined differences on total and segmental PA among these athletes.
Based on this background, the objectives of the present study were as follows: (a) to assess whether whole-body and segmental PA varied among elite male athletes practicing cycling, water polo and ballet dance; (b) to assess whether PA differed between elite athletes and healthy control subjects; and (c) to explore the relationship between PA and anthropometric and BC variables.
2. Methods
2.1. Subjects
In the present study we have retrospectively analyzed data of elite athletes practicing cycling, water polo and ballet dance, collected between 2011 and 2019. Subjects with the following inclusion criteria: males, age between 18 and 35 years, and at least 16/18 h of training a week, were selected for this study. Subjects affected by metabolic and/or endocrine diseases and/or regularly taking any medications or using any drugs, were excluded. Data of athletes were compared to healthy non-athletic males, who served as controls.
Data from professional endurance cyclists of the Pro Cycling Team Liquigas Cannondale were collected during the Giro D'Italia 2011–2012 races. Ballet dancers of the ballet school of the Teatro San Carlo of Naples used to train from Monday to Saturday for about 4 h per day and were studied during the 2012/2013 ballet season. Water polo players were evaluated during the competitive season of the 2018/2019 national championship A1 series (Canottieri Napoli and Carpisa Yamamay Acquachiara teams). They train for about 16–18 h per week including sessions of aquatic endurance, technical word and resistance training. Control males were selected among the Federico II University students and they did not follow physical activity programmes. After having been informed about the objectives and the procedures of the research, the participants gave their informed consent. The study was carried out in conformity with the ethical standards laid down in the 1975 declaration of Helsinki and was approved by the Ethics Committee of Federico II University (n. 42/17).
2.2. Anthropometric and BIA measurements
All participants were studied in the morning (8.30 a.m.) after an overnight fast (12 h fast) by the same operator. Body weight was measured to the nearest 0.1 kg using a platform beam scale, and body height was measured to the nearest 0.5 cm with a stadiometer (SECA 711 and SECA 220, respectively; Hamburg—Germany). BMI (body mass index) was calculated as body weight (kg) height2 (m)2. BIA was performed by a phase-sensitive device (Human IM Plus II, DS Medica S.r.l., Milan, Italy). Data for Z, R and PA at 50 kHz were considered for the present paper (dominant and non-dominant sides of the body).
Measurements were carried out in standardized conditions (i.e. ambient temperature between 23 °C and 25 °C, fast >3 h, empty bladder, supine position for at least 10 min before starting the measurement). In addition, after cleaning skin surface, patients were asked to lay with upper and lower limbs slightly abducted, so there was no contact between the extremities and trunk.
The measuring electrodes were placed on the anterior surface of the wrists and ankles, and the injecting electrodes were placed on the dorsal surface of the hands and the feet, respectively (overall, eight electrodes). For the right body side, the injecting electrodes were always those on the dorsal surface of the right hand and foot, while the measuring electrodes were placed as follows: right and left wrists for right upper limb, right and left ankles for right lower limb. A symmetrical placement of the electrodes was used for left upper or lower limbs. Z, R and PA were measured injecting an imperceptible electrical current of 800 mA. This evaluation was conducted in accordance with the segmental approach suggested by Organ et al (1994).
Finally, FFM were estimated using the mean value of R for dominant and non-dominant sides and using the predictive equations developed by Sun et al (2003). Fat mass (FM) was given by the difference between body weight and FFM.
2.3. Statistical analysis
Data were analyzed using SPSS IBM Statistics software (version 22). Data for PA was obtained by calculating the mean of dominant and non-dominant sides of the body.
The Kolmogorov–Smirnov test was used to perform the normality of all numerical continuous variables. The test showed a normal distribution; therefore, a parametric analysis was performed.
The Student's unpaired t-test was used to analyze differences between each sport group and its control group. Comparisons between groups were conducted by analysis of variance and post hoc tests for multiple comparisons were performed. Values were reported as mean ± standard deviation unless otherwise specified.
Linear correlation was applied for evaluating associations between variables. Multiple linear regression analysis was used to identify independent variables able to predict PA, including anthropometric (age, body weight, stature, BMI) and BC variables (FFM, FM, FM%). P values below 0.05 were considered as statistically significant.
3. Results
Participants included three groups of male athletes (18 cyclists, 20 water polo players, 18 ballet dancers) and three groups of healthy control subjects, each of which similar for general characteristics (one to one) to the previous ones (15, 15 and 22 subjects, respectively). Individual characteristics of the participants are presented in table 1; BC variables and PA are summarized in table 2.
Table 1. Characteristics of athletes and their respective control groups.
| Cyclists | Control group | Water polo players | Control group | Ballet dancers | Control group | |
|---|---|---|---|---|---|---|
| (n = 18) | (n = 15) | (n = 20) | (n = 15) | (n = 18) | (n = 22) | |
| Age (years) | 28.6 ± 3.4a | 26.7 ± 3.3 | 23.9 ± 4a | 24.4 ± 1.3 | 19.2 ± 1.3a | 18.6 ± 2.3 |
| Weight (kg) | 70.6 ± 5.4 | 70.5 ± 5.3 | 89.0 ± 5.2a , c | 83.5 ± 3.4 | 63.3 ± 5.8 | 65.4 ± 7.5 |
| Stature (cm) | 182 ± 5 | 177 ± 5 | 185 ± 3c | 182 ± 5 | 174 ± 5 | 176 ± 7 |
| BMI (kg m2) | 21.5 ± 1.4 | 22.3 ± 1.2 | 25.9 ± 1.9b , c | 25.4 ± 1.4 | 20.8 ± 1.0 | 21.0 ± 1.3 |
BMI = body mass index. Data are expressed as mean ± standard deviation. a Indicates differences to other athletes (comparison between sports). b Indicates differences to cyclists (comparison between sports). c Indicates differences to ballet dancers (comparison between sports).
Table 2. Body composition characteristics and phase angle of athletes and their respective control groups.
| Cyclists | Control group | Water polo players | Control group | Ballet dancers | Control group | |
|---|---|---|---|---|---|---|
| (n = 18) | (n = 15) | (n = 20) | (n = 15) | (n = 18) | (n = 22) | |
| FFM (kg) | 61.5 ± 5.6 | 59.9 ± 4.8 | 73.5 ± 5.6*, § | 68.3 ± 3.6 | 58.9 ± 5.5 | 56.4 ± 5.7 |
| FM (kg) | 9.0 ± 2.0° | 11.2 ± 3.4 | 15.5 ± 3.0° | 15.5 ± 3.9 | 4.4 ± 2.3# ,° | 9.1 ± 3.1 |
| FM (%) | 12.8 ± 2.6§ | 15.9 ± 4.6 | 17.5 ± 3.4§ | 18.6 ± 4.0 | 6.8 ± 3.3# | 13.6 ± 4.1 |
| Whole-body PA (degrees) | 7.70 ± 0.54¥ | 6.86 ± 0.45 | 8.28 ± 0.61† | 7.09 ± 0.60 | 7.74 ± 0.57# | 7.02 ± 0.59 |
| Upper limb PA (degrees) | 5.89 ± 0.53 | 5.68 ± 0.61 | 6.39 ± 0.62† | 5.54 ± 0.59 | 6.09 ± 0.64# | 5.19 ± 0.68 |
| Lower limb PA (degrees) | 9.27 ± 0.52¥ | 7.94 ± 0.75 | 9.49 ± 0.54† | 8.14 ± 0.95 | 9.38 ± 0.52# | 8.49 ± 0.78 |
FFM = fat-free mass; FM = fat mass; PA = phase angle; Data are expressed as mean ± standard deviation Indicates differences to other athletes (comparison between sports).* Indicates differences to cyclists (comparison between sports).
§ Indicates differences to ballet dancers (comparison between sports).
# Indicates differences to their control group.
¥ Indicates differences to their control group.
† Indicates differences to their control group.
Indicates differences to other athletes (comparison between sports).* Indicates differences to cyclists (comparison between sports).
§ Indicates differences to ballet dancers (comparison between sports).
# Indicates differences to their control group.
¥ Indicates differences to their control group.
† Indicates differences to their control group.
3.1. Cyclists vs control group
Individual characteristics and BC variables were similar between the groups (table 1). Otherwise, whole-body and especially lower limb PAs values were higher in cyclists than in controls (+12.2% p = 0.023 and +16.8% p = 0.002, respectively), but upper limb values were similar (table 2).
3.2. Water polo players vs control group
No significant differences were found for individual and BC characteristics (tables 1 and 2). Both whole-body and limb PAs were substantially higher in water polo players than in controls (whole-body +16.8% p = 0.001; upper limb +15.3% p = 0.012 and lower limb +16.8% p = 0.001) (table 2).
3.3. Ballet dancers vs control group
Individual characteristics did not differ between dancers and controls (table 1). Regarding BC, both absolute and percentage FM were markedly lower in ballet dancers than in controls (−51.6% p = 0.003 and −50% p < 0.001, respectively), whereas FFM was similar (table 2). Both whole-body and limb PAs were higher in ballet dancers compared to controls (whole-body +10.3% p = 0.026; upper limb +17.3% p = 0.003 and lower limb +10.5% p = 0.041) (table 2).
3.4. Cyclists vs water polo players vs ballet dancers
Among the athletes, body weight was higher in water polo players than the other groups (p < 0.05), whereas stature was lower (p < 0.05) in ballet dancers compared to water polo players. Additionally, water polo players had the highest FFM (p < 0.05) while there was no difference between ballet dancers and cyclists. FM (both in absolute and percent values) was the lowest in ballet dancers and the highest in water polo players (p < 0.05). Finally, whole-body and limb PAs did not differ among the three sport groups (table 2), also after adjusting for FFM.
3.5. Correlations between anthropometric and body composition variables and phase angle
Pearson's correlation coefficients assessed the association of both whole-body and limb PA with both anthropometric and BC variables in athletes and controls (table 3).
Table 3. Pearson's correlation for the association of phase angle with both anthropometric and body composition variables.
| Whole-body | Upper limb | Lower limb | ||||||
|---|---|---|---|---|---|---|---|---|
| Athletes (n = 56) | ||||||||
| r | p | r | p | r | p | |||
| Age | −0.122 | 0.537 | −0.175 | 0.372 | −0.006 | 0.974 | ||
| Weight | 0.508 | 0.006 | 0.372 | 0.051 | 0.238 | 0.222 | ||
| Stature | 0.069 | 0.726 | −0.069 | 0.726 | −0.098 | 0.621 | ||
| BMI | 0.639 | 0.000 | 0.527 | 0.004 | 0.371 | 0.052 | ||
| FFM | 0.651 | 0.000 | 0.629 | 0.000 | 0.347 | 0.070 | ||
| FM | 0.417 | 0.027 | 0.245 | 0.209 | 0.213 | 0.275 | ||
| FM% | 0.325 | 0.091 | 0.150 | 0.445 | 0.154 | 0.434 | ||
| Controls (n = 52) | ||||||||
| Age | 0.099 | 0.503 | 0.402 | 0.002 | −0.181 | 0.218 | ||
| Weight | 0.284 | 0.050 | 0.417 | 0.003 | −0.041 | 0.782 | ||
| Stature | 0.113 | 0.443 | 0.288 | 0.047 | −0.082 | 0.580 | ||
| BMI | 0.280 | 0.042 | 0.365 | 0.011 | 0.016 | 0.915 | ||
| FFM | 0.212 | 0.149 | 0.479 | 0.001 | −0.143 | 0.332 | ||
| FM | 0.270 | 0.062 | 0.153 | 0.298 | 0.145 | 0.326 | ||
| FM% | 0.242 | 0.097 | 0.016 | 0.915 | 0.210 | 0.153 | ||
BMI = body mass index; HGS = handgrip strength; FFM = fat-free mass; FM = fat mass.
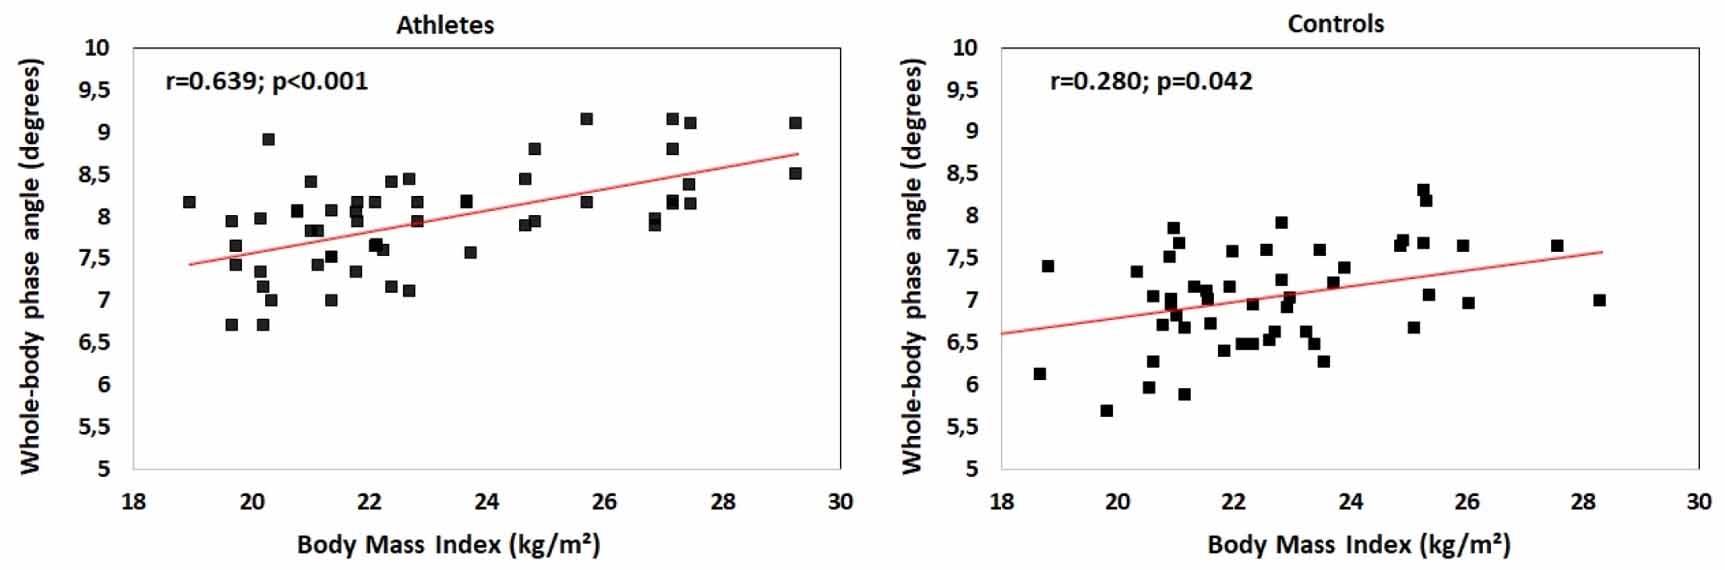
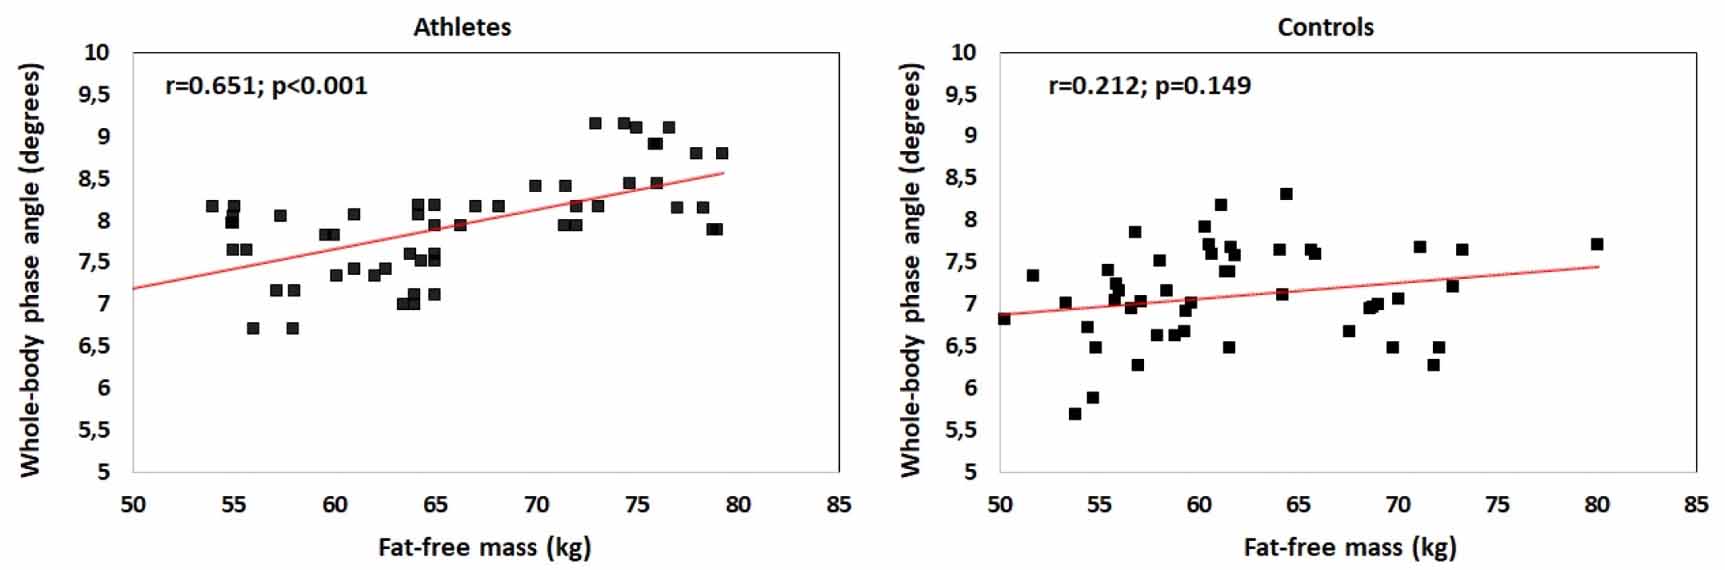
We found that in athletes whole-body PA had a strong association with body weight (r = 0.508; p = 0.006; figure 2), BMI (r = 0.639; p < 0.001) and FFM (r = 0.651, p < 0.001; figure 1). Findings in controls showed a weak correlation with body weight (r = 0.284, p = 0.050; figure 2) and BMI (r = 0.280; p = 0.042).

Figure 1. Relationship between body mass index and whole-body phase angle.
Download figure:
Standard image High-resolution image
Figure 2. Relationship between fat-free mass and whole-body phase angle.
Download figure:
Standard image High-resolution imageUpper limb PA in athletes was positively associated with BMI (r = 0.527, p = 0.004; figure 3) and FFM (r = 0.629, p < 0.001; figure 4) whereas in controls it was correlated with age (r = 0.402; p = 0.002), body weight (r = 0.417; p = 0.003), stature (r = 0.288; p = 0.047), BMI (r = 0.365; p = 0.011) and FFM (r = 0.479; p = 0.001). No correlations were found between lower limb and the studied variables in both groups.

Figure 3. Relationship between body mass index and upper limb phase angle.
Download figure:
Standard image High-resolution image
Figure 4. Relationship between fat-free mass and upper limb phase angle.
Download figure:
Standard image High-resolution image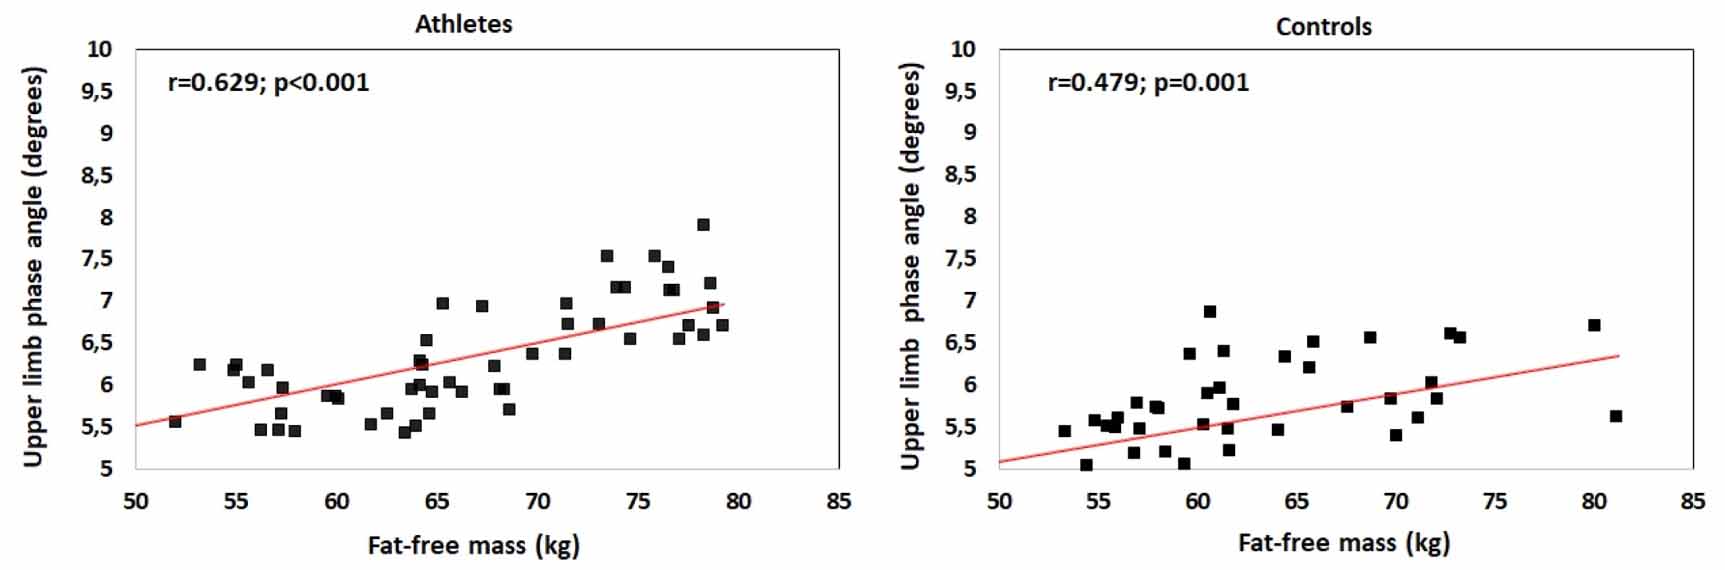
3.6. Variables influencing phase angle
As further step, a multiple regression analysis was performed to determine the influence of age and basic anthropometric (weight, stature and BMI) or BC (FFM, FM and FM%) measures, considering whole-body and upper limb PA of athletes or controls, as dependent variables (no significant correlations were found between lower limb PA and the studied variables in both groups). In athletes, when whole-body PA was set as a dependent variable, regression analysis showed that FFM (β = 0.844; p < 0.001) and stature (β = −0.370; p = 0.031) were the strongest determinants. Also, when upper limb PA was the dependent variable, FFM (β = 0.912; p < 0.001) and stature (β = −0.544; p = 0.001) were the main predictors. Otherwise, in controls, when whole-body PA was set as a dependent variable, regression analysis showed that BMI was the strongest determinant (β = 0.323; p = 0.025). Conversely, FFM (β = 0.361; p = 0.011) and age (β = 0.288; p = 0.041) were the main determinants of upper limb PA.
4. Discussion
The main purpose of the present study was to assess whether segmental PA differed among elite male athletes practicing cycling, water polo and ballet dance. To our knowledge, this is the first study to focus on the differences in PA values among these groups of athletes. Previously, limited cross-sectional studies have compared PA among athletes practicing different sports but none of them have focused on the segmental PA evaluation (Kim et al 2010, Koury et al 2014, Galanti et al 2015). The development of muscle mass varies depending on sport type; the morphological characteristics of athletes are different mostly due to the specific requirements of each sport. The major muscles involved in cycling are leg muscles (especially quadriceps and thigh muscles) (Mujika et al 2016), whereas in water polo and dance training involves upper and lower muscle groups, with a more balanced distribution of increased muscle mass (Koutedakis and Jamurtas 2004, Lozovina 2009, Ferrari et al 2013, Cox et al 2014).
Our findings did not show any significant differences between the three groups of athletes, even after adjusting for FFM, although whole-body and limb PAs were slightly higher, albeit not significantly, in water polo players. That may be due to the small groups of participants.
As another aim, we evaluated whether PA differed between athletes and control subjects, since current data are limited (Di Vincenzo et al 2019). Only few papers have addressed this issue: a marked increase in whole-body PA was observed in bodybuilders (Piccoli et al 2007), dancers (Marra et al 2009), ballet dancers (Marra et al 2018b), cyclists (Marra et al 2018b), marathon runners (Marra et al 2018a) and volleyball players (Di Vincenzo et al 2020). The results of this study are in line with literature data. Additionally, in our study interesting evidence emerged with the segmental evaluation. Specifically, we found that lower limb PAs were higher in all groups of athletes than in controls, probably due to the severe involvement of the lower limbs in sport activity. Similar results emerged for upper limb PA values in water polo players and ballet dancers but not in cyclists who, surprisingly, showed similar upper limb PA values compared to their controls. We attributed these results to the relatively less development of the arms during training and competitions.
Furthermore, an interesting issue was to explore whether and to what extent anthropometric and BC parameters were related to PA in elite athletes. As far as we know, no consistent data are available in the literature on the topic (Di Vincenzo et al 2019). Based on our results, anthropometric and BC variables such as body weight, BMI and FFM were stronger associated with whole-body and upper limb PA in athletes than in controls.
Additionally, the multivariate regression model showed that FFM was the strongest determinant of both whole-body and upper limb PA, followed by stature. Surprisingly, no associations were found for lower limb PA in both athletes and controls.
Despite the useful information that the segmental PA evaluation could provide in sport science, very few studies focused on changes in body segments due to training. Specifically, a study by Marra et al (2016) on professional cyclists, suggested the use of segmental PA measurements to monitor athletes' FFM modifications during medium- and long-term competitions. They have demonstrated a clear reduction in lower limb PA accompanied by a substantially unmodified upper limb PA values during the same assessment and period of time. Conversely, resistance-trained females showed increased both whole-body and limb PA values after a 8 weeks training programme (Tinsley et al 2019). These contrasting results may be explained by the different type of sport activity: a strenuous exercise about 200 km cycling per day for 20 consecutive days (Marra et al 2016) vs a training programme for three times per week for 8 weeks (Tinsley et al 2019).
Finally, we evaluated and compared BC variables (such as FFM and FM) in the three groups of athletes and between athletes and controls. We found that water polo players had a substantially higher amount of FM than cyclists and ballet dancers and similar to their control group, probably because water polo players may retain slightly more fat to assist with floating during training and match (Andreoli et al 2003, Lozovina 2009, Cox et al 2014). On the other hand, as expected, ballet dancers had both absolute and percentage FM clearly lower than other athletes (possibly due to reduced dietary energy/calorie intake, high performance and because of body image issues) and, especially, than their control group. These results demonstrate that specific training for several years has influenced BC of ballet dance athletes, in line with previous evidence reported from the latest literature (Ferrari et al 2013, Stokic et al 2016, Kruusamäe et al 2016, Amorim et al 2017, Marra et al 2019). Indeed, it should be reminded that the Sun equation, used to predict FFM in all the participants, was derived using a four compartment model and is usually considered very reliable for the general population (Caucasians) but so far it has not been specifically validated in athletes.
The strength of this study are the assessment of segmental BIA and the use of a single BIA device, which limits the device-related PA variability. This study suffers from a few limitations such as being retrospective and the low number of participants because of the difficulty to enroll elite athletes.
5. Conclusions
This study further supports the idea that PA is directly related to the level of physical activity. The novelty of this study is represented by the direct evaluation of segmental PA among athletes practicing different sports, which can be employed by researchers and specialists in assessing variations in physiological variables, for example in response to interventions.
In fact, while whole-body PA could represent a proxy parameter of soft tissue mass quality of the overall body, the limbs evaluation can be useful for monitoring the condition of the athlete preparing for the competition, for assessing differences among athletes and slight variations due to training in specific body segments.
While our results are promising, large cross-sectional studies and, possibly, longitudinal studies (both also considering the size of major muscle groups) are needed to confirm that the current use of BIA is valuable in assessing muscle quality, and in evaluating differences due to gender, training volume, playing position, levels, etc.
Conflict of interest
The authors have no affiliations with or involvement in any organization or entity with any financial interest or non-financial interest in the subject matter or materials discussed in this manuscript.