
Abstract
Objective. Lutetium yttrium oxyorthosilicate (LYSO) scintillation crystals are used in positron emission tomography (PET) due to their high gamma attenuation, fair energy resolution, and fast scintillation decay time. The enduring presence of the 176Lu isotope, characterized by a half-life of 37.9 billion years, imparts a consistent radiation background (BG) profile that depends on the geometry and composition attributes of the LYSO crystals. Approach. In this work, we proposed a methodology for estimating the composition of LYSO crystals in cases where the exact Lutetium composition remains unknown. The connection between BG spectrum intensity and intrinsic radioactivity enables precise estimation of Lutetium density in LYSO crystal samples. This methodology was initially applied to a well-characterized LYSO crystal sample, yielding results closely aligned with the known composition. The composition estimation approach was extended to several samples of undisclosed LYSO crystals, encompassing single crystal and crystal array configurations. Furthermore, we model the background spectrum observed in the LYSO-based detector and validate the observed spectra via simulations. Main results. The estimated Lutetium composition exhibited adequate consistency across different samples of the same LYSO material, with variations of less than 1%. The result of the proposed approach coupled with the simulation successfully models the background radiation spectra in various LYSO-based detector geometries. Significance. The implications of this work extend to the predictive assessment of system behaviors and the autonomous configuration parameters governing LYSO-based detectors.
Export citation and abstract BibTeX RIS

Original content from this work may be used under the terms of the Creative Commons Attribution 4.0 licence. Any further distribution of this work must maintain attribution to the author(s) and the title of the work, journal citation and DOI.
1. Introduction
Lutetium yttrium oxyorthosilicate (LYSO) scintillation crystals have gained significant recognition within clinical medical systems, particularly in the context of positron emission tomography (PET). Their attributes include high intrinsic detection efficiency and rapid decay scintillation properties, rendering them well-suited for precise imaging and diagnostics in the field of nuclear medicine. While this intrinsic radiation is often perceived as background noise, shown in Yoshida et al (2014), it holds significant potential for providing valuable insights and information, as evidenced by previous studies.
The decay spectrum of the 176Lu isotope within LYSO crystals has been successfully modeled using both Monte Carlo (MC) simulations, Gate-Geant4, (McIntosh et al 2011), and discrete analytical methods, (Ko et al 2021). These models exhibit a high level of agreement with measured spectra and serve as reliable tools for studying LYSO background (BG) radiation properties. Furthermore, (Alva-Sánchez et al 2018, Alva-Sánchez 2022) investigated into the BG spectrum of LYSO crystals to explore the effects of different crystal geometries, and sizes. Addesa et al (2022) have expanded this exploration by investigating the correlation between BG signal intensity and crystal density. The pioneering work of Knoess et al (2002) and Watson et al (2004) suggested the utilization of radiation signals from 176Lu to monitor daily performance in LYSO-based PET detectors. Subsequent efforts have further exploited the intrinsic radiation of LYSO crystals for monitoring and calibrating LYSO-based PET systems, as evidenced by Knoess et al (2002), Wei et al (2012), Freire et al (2021), and Afanaciev et al (2015). Calibration of LYSO crystal alignment within the PET system and the alignment of the PET system with respect to a phantom, as elucidated by Wei et al (2016) and Wei et al (2018), relies exclusively on BG radiation measurements. Furthermore, the intrinsic radiation of LYSO has been proposed as a tool for calibrating parameters including depth of interaction (DOI) (Bircher and Shao 2012), flood map estimation, detector sensitivity (Chen et al 2021, Freire et al 2021), timing calibration, and synchronization (Rothfuss et al 2014a, Enríquez-Mier-y Terán et al 2020). Another approach to correctly update for energy calibration drifting via a linear shifting methodology has also been investigated to maintain detector uniformity response, (Conti et al 2010). In addition, (Rothfuss et al 2014b) and (Omidvari et al 2022) explore the use of lutetium background radiation for attenuation correction in total-body PET scans. Their research discusses the challenges of implementing lutetium background radiation for attenuation correction in clinical settings and the potential opportunities it presents for improving PET imaging quality.
The material compositions of LYSO crystals, defined as L2x Y2(1−x)SiO5 where 'x' represents the Lutetium fraction variable, have historically relied on manufacturer-provided values in previous studies involving LYSO intrinsic radiation. The variability in this composition value has introduced a substantial level of uncertainty into studies employing LYSO-based detectors. Obtaining the true Lutetium concentration in the utilized LYSO crystals provides essential information for accurately modeling the LYSO-based detector in simulation and for monitoring the detector's performance in daily operation.
To our knowledge, the material composition 'x' value has not been investigated for unknown LYSO crystals in previous studies. In this study, we present a measurement approach to accurately estimate the Lutetium concentration in unknown LYSO crystals. The workflow of the estimation method is shown in section 2.2.1. The intrinsic radioactivity of the investigated LYSO crystal sample is obtained through parallel measurements of the target crystal and a reference well-defined crystal on a PMT. In section 2.2.2, the precision of the method is demonstrated for different crystal dimensions and compositions. Section 2.2.3 shows that simulation (using GEANT4 library v10.07.p02) for 176Lu decay in the LYSO crystal, employing the estimated 'x' values, finds good agreement with the measurement spectrum of the investigated crystal. The established method was tested on several LYSO samples in section 2.2.4.
Furthermore, we offer an in-depth analysis of the distinct energy spectra shapes from LYSO crystal arrays (section 3.2) and examine background radiation signals in simulated PET detector configurations (section 3.3). Our result has profound implications for image correction methods, provides a reliable standard for daily detector performance monitoring, and aids in correcting PET images for background signal contributions, enhancing image quality for low-intensity sources.
2. Instruments and method
2.1. LYSO intrinsic radiation
2.1.1. Energy spectrum measurements for lutetium decays
The β decay of 176Lu is accompanied by one or more prompt γ-ray emissions, each with distinctly associated probabilities, as illustrated in figure 1(a), (Lara 2023). These emissions occur nearly simultaneously (within approximately 1 ns) within the scope of energy spectra measurements, as a scintillation pulse of a typical LYSO crystal decays in about 40 ns. The measurement approach in this study is shown in figures 1(b) and (c). The LYSO crystal sample is directly coupled to a photomultiplier tube (PMT-Hamamatsu R-329-02) to measure the total photon integration from the scintillation events of the crystal. The PMT is biased to 1000 V and the output signal is directly fed to the multichannel analyzer (MCA-DT5780P). The magnitude of the signal pulse is recorded in the energy spectrum and saved in the laptop computer for later analysis. The energy axis presented in the dimension of ADC (analog to digital conversion unit) from the MCA is calibrated and converted to keV dimension using gamma standard sources.
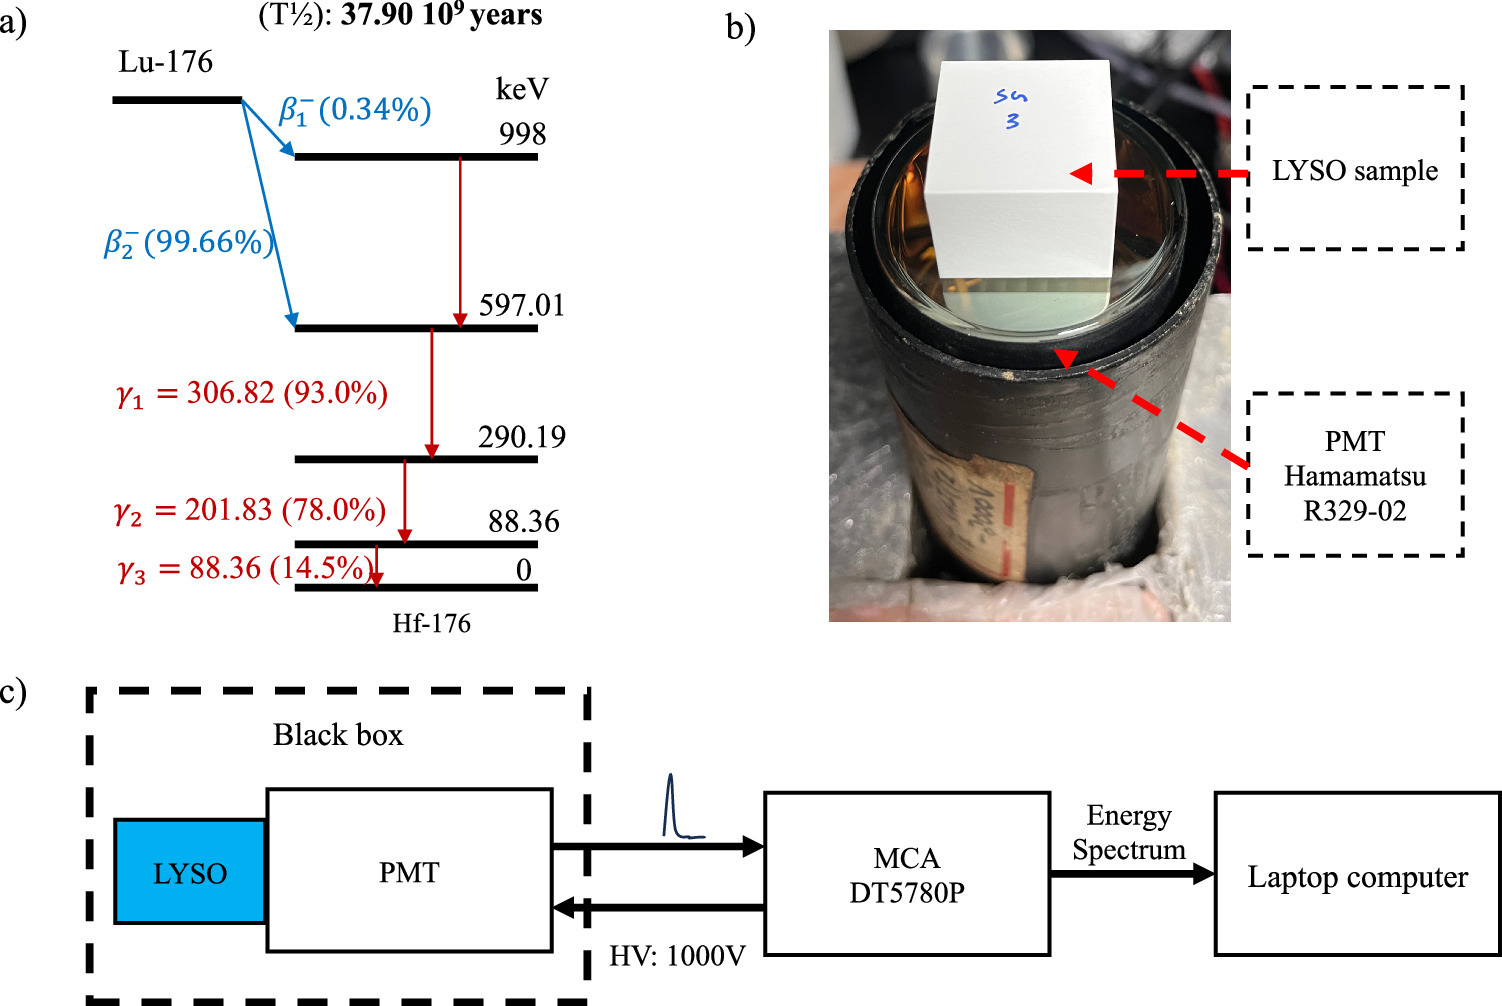
Figure 1. (a) Schematic diagram of 176Lu decay, (Adapted with permission from Lara 2023. CC BY-SA). (b) figure of A LYSO crystal sample on a PMT. (c) Schematic diagram for measurement of LYSO crystals by using PMT.
Download figure:
Standard image High-resolution image2.1.2. Simulation for lutetium decays in LYSO crystal
To understand and analyze the complex behavior of lutetium decays in LYSO crystal and crystal array of any dimension, MC simulations are executed using Gate—GEANT4 library v10.07.p02. The decay of 176Lu ions are generated and attached to the investigated LYSO crystals with the physics library of QGSP-BIC-HP-EMZ. The total energy deposited in the observed LYSO crystal from gamma rays and electron of each 176Lu decay event is collected in the energy spectrum.
2.2. Method for obtaining Lutetium concentration of LYSO crystals
2.2.1. Estimating LYSO material composition method
The composition structure of the LYSO crystal is represented as Ce: Lu2x Y2(1−x)SiO5, where the value of 'x' varies depending on the manufacturer (Liu et al 2022). Considering that 176Lu maintains a constant natural abundance of 2.599% of Lutetium within the LYSO crystal, the intrinsic radioactivity stemming from the LYSO background measurement can offer a precise means to compute the 'x' value.
The measurement method for estimating the 'x' value from an investigated LYSO crystal is demonstrated by a flowchart shown in figure 2. The LYSO intrinsic radioactivity in conjunction with the total count rates derived from the BG measurement of the LYSO crystal (utilizing a 100 keV threshold), is depicted in figure 3(a). When verified with the reference LYSO crystal from Saint Gobain, the radioactivity and total count rate exhibit close alignment, revealing a slight discrepancy of 2.5%, which is designated as the 'ExCount'.

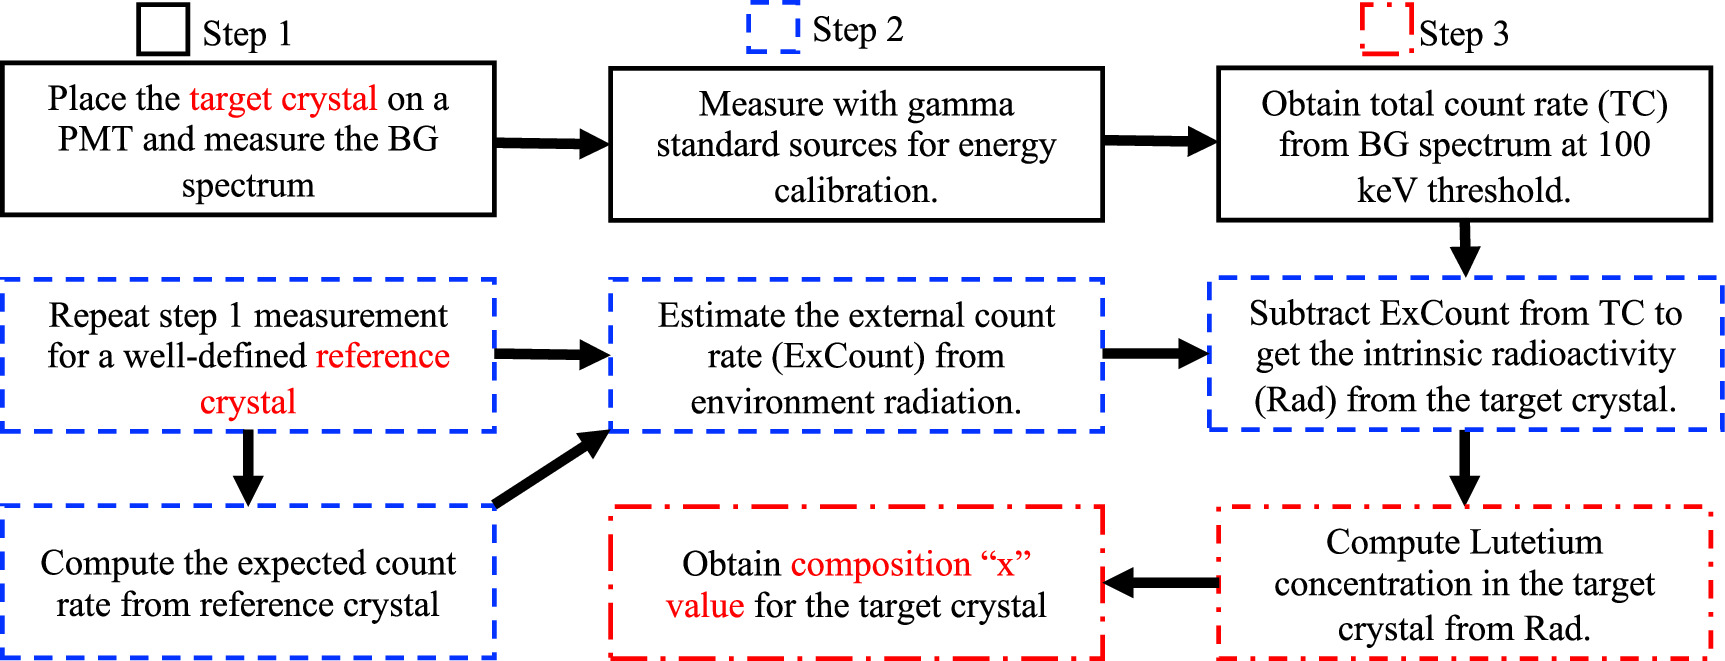
Figure 2. Work flow for obtaining composition 'x' value from an unknown LYSO crystal. The BG spectrum of the LYSO sample is measured using PMT in step 1. In step 2, the count rate from the environment is approximated using a well-defined reference crystal. Finally, composition 'x' is estimated in step 3.
Download figure:
Standard image High-resolution image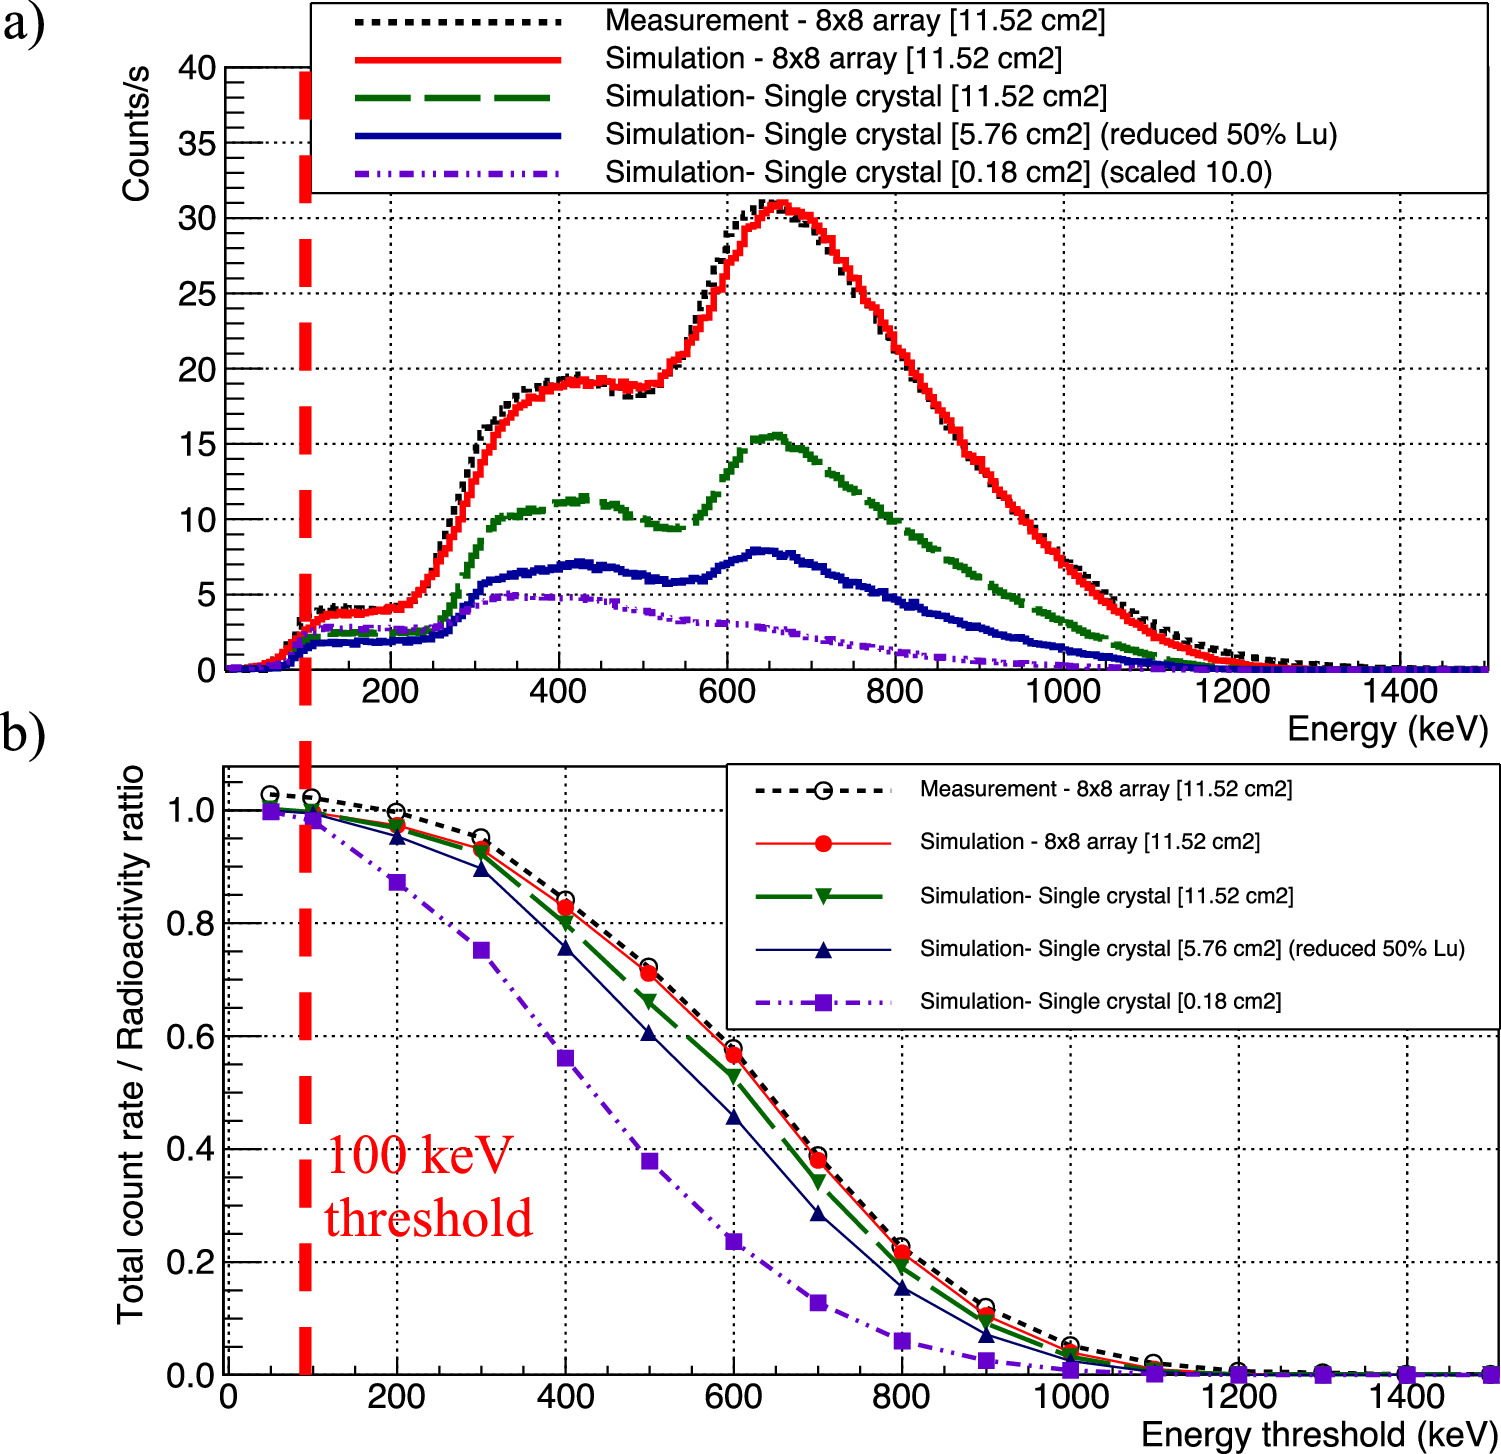
Figure 3. (a) BG energy spectra (with the absence of external gamma source) from various LYSO crystal dimensions and compositions generated by simulations (using GEANT4 library v10.07.p02) and compared with that of a measurement. (b) Ratio between total count rate, obtained from various energy threshold cuts of the spectra in (a), and the radioactivity of the corresponding LYSO crystals.
Download figure:
Standard image High-resolution imageIn equation (1), the total measured count rate (TC) of the LYSO BG spectrum comprises two distinct components: the intrinsic radioactivity (Rad) stemming from 176Lu, and an external signal (ExCount) from the surrounding environment. This external signal is proportionate to the volume of the LYSO crystal and holds true for LYSO crystals that exhibit comparable densities. The 'ExCount' from the reference LYSO crystal (LYSO-ref) is 78.0 counts s−1, which is equivalent to 6.8 counts s−1 cm−3. An accurate estimation of the intrinsic radioactivity can be obtained, with uncertainty less than 1%, for the investigated LYSO crystal by approximating and subtracting the external signals using the 'ExCount' value from the reference crystal from Saint Gobain. The method is determined on two tested LYSO samples (LYSO-S1-1 and LYSO-S1-2) which are the same LYSO material as the reference sample from Saint Gobain. The result of the determination, shown in table 1, gives a consistent output for 'x' value with deviation from the expected value of about 0.1%.
Table 1. Estimated composition 'x' values from the tested LYSO sample.
| LYSO samples | Expected 'x' | Estimated 'x' |
|---|---|---|
| LYSO-Ref | 0.900 | |
| LYSO-S1-1 | 0.900 | 0.900 (±0.0%) |
| LYSO-S1-2 | 0.900 | 0.901 (±0.1%) |
The 'x' value is directly computed from the obtained intrinsic radiation 'Rad' from the measurement. First, the radioactivity is converted into the number of 176Lu using NLu−176 = λ*Rad. Second, from the natural abundance of 176Lu (2.599%), the total number of lutetium atoms is derived and the mass ratio of lutetium in the LYSO crystal is obtained by dividing the total lutetium mass with the density and total volume from table 2. Finally, this ratio is equivalence to the mass ratio of the lutetium in the constraint of Lu2x Y2(1−x)SiO5, so the 'x' value can be extracted from such equivalence.
Table 2. Dimensions and densities of the LYSO crystal samples investigated in figure 4. There are 64 units for the 8 × 8 array and 1 unit for the single crystal.
| LYSO samples | Dimension | Density (g cm−3) |
|---|---|---|
| LYSO-Ref | 8 × 8 array [0.3 × 0.3 × 2 cm3 per unit] | 7.1 |
| LYSO-S1-1,2 | 8 × 8 array [0.3 × 0.3 × 2 cm3 per unit] | 7.1 |
| LYSO-S2-1,2,3 | 8 × 8 array [0.3 × 0.3 × 2 cm3 per unit] | 7.4 |
| LYSO-S2-4 | Single crystal [1.2 × 1.2 × 4 cm3 per unit] | 7.4 |
| LYSO-S3-1,2 | Single crystal [0.3 × 0.3 × 2 cm3 per unit] | 7.4 |
2.2.2. Variation of crystal dimensions and compositions
The energy spectra resulting from the total light integration BG measurements exhibit notable variations across different crystal dimensions and LYSO material compositions, as depicted in figure 3(a). Despite the disparities in the shapes of these energy spectra, a consistent trend emerges: the count rate intensity consistently mirrors the intrinsic radioactivity of the investigated LYSO crystals. This relationship is illustrated in figure 3(b), where the total count rate, measured with a 100 keV energy threshold applied to the energy spectra, approximates the intrinsic radioactivity of the corresponding crystals across all crystal configurations (>99.5%). The utilization of a 100 keV energy threshold provides conformity in the measurements as effectively mitigates low-energy noise.
2.2.3. Background energy spectra of individual crystal channels from a 2D array LYSO
In previous sections, the scintillation light output from the array samples is summed up as the samples are coupled the the PMT. In this section, the light signals are recovered for individual channels separately. The BG energy spectrum stemming from the intrinsic radiation of 176Lu, when measured independently for each single channel of a 2D LYSO array, exhibits differences compared to that of a total light integration spectrum shown in section 2.2.2. This dissimilarity arises from the fact that the signals measured from each channel not only originate from the respective crystal but also emanate from neighboring crystals. The simulation aims to model the BG signals resulting from the intrinsic radiation of 176Lu within LYSO crystals as observed within a large array crystal module of a PET detector. The radioactivity and material composition, as obtained from the method in section 2.2.1, are employed as inputs for the simulation.
In the simulation, the decay of 176Lu is replicated within a solitary crystal situated at the center of a 8 × 8 crystal array. Subsequently, energy-deposited spectra are recorded independently for each channel. This recorded data is visually presented in figure 4(a). The energy spectrum observed at the source channel, where 176Lu ions are generated, comprises a combination of electrons and one or more gamma particles. Meanwhile, the energy spectra from neighboring channels, located in proximity to the source channel, exhibit distinct 307 keV and 202 keV gamma lines, with the combined 509 keV peak being of negligible intensity. The disparities in energy spectrum shapes, figure 4(a), between the source channel and the others arise because electrons emitted during β decay, with a maximum energy of approximately 600 keV, remain confined nearly 100%, to the source channel and release their entire energy within it. Thus, only the gamma rays can escape the source crystal and arrive in the neighbor crystals by chance depending on the crystal size and position in the array.
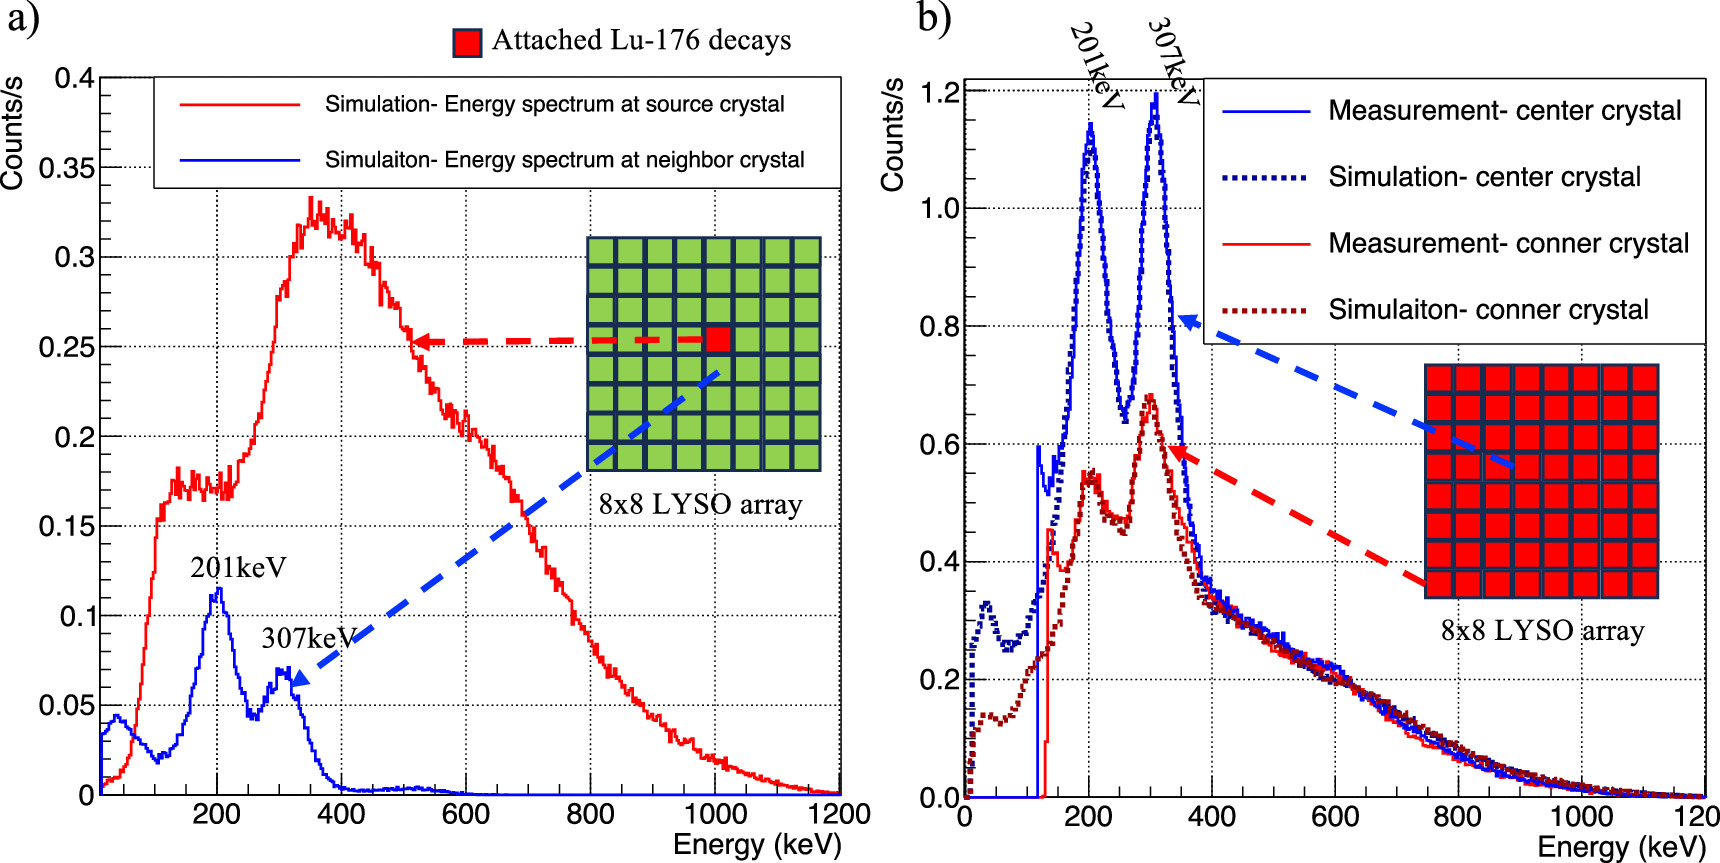
Figure 4. BG energy spectra from simulation of LYSO-S2 crystal array. (a) The decay of 176Lu is only attached to one crystal at the center of the array. (b) 176Lu decays are attached to all crystals of the array. Spectra from the simulation are compared with that of measurements.
Download figure:
Standard image High-resolution imageThis simulation analysis enables the classification of the BG signals into two categories: 'local' signals (originating from the LYSO crystal attached to the same channel) and 'neighbor' signals (emanating from nearby LYSO crystals). A similar simulation is carried out with 176Lu ions connected to all LYSO crystals in the array. The resulting energy spectra in the single mode configuration, as shown in figure 4(b), exhibit the 'neighbor' signals characterized by discrete 307 keV and 202 keV gamma lines, superimposed on continuous 'local' signals. The intensity of the 'neighbor' signals is notably influenced by the relative positions of the channels within the crystal array. In contrast, the intensity of the 'local' signals remains constant across all channels. This spectral shape is in strong agreement (less than 3% discrepancy) with the measured BG spectra obtained in the single mode (energy spectrum acquired from a single individual crystal channel). The energy spectrum measurement from one single channel in the crystal array was enabled by using a thin aluminum mask (0.5 mm in thickness). On the mask, a hold of the size and position of the interested crystal was manufactured. There are two masks for measuring one crystal at the corner and the other at the center of the 8 × 8 crystal array.
To further explore the capabilities of our simulation model, we have extended it to investigate the behavior of a larger crystal array (16 × 32 arrays, dimension of an individual channel is 3 × 3 × 20 mm3), representing a compact LYSO-based dual PET system, as depicted in figure 5. This PET detector comprises a total of 1024 channels, evenly distributed across two opposing boards. This detector geometry, referred to as the 'AS-PET' detector, aligns with the configuration employed in prior studies, (Nemallapudi et al 2021, Rahman et al 2022). The 176Lu decays are distributed across all channels, with radioactivity tailored to the specific LYSO material under consideration, S1, S2, and S3 alternately. Simulation outputs are collected independently for each crystal ID in single and coincidence detection modes. In the single mode, all detected events in each channel are recorded with an energy threshold of 100 keV. The coincident mode only accepts coincidences between the two boards within a 10 ns window and an energy threshold of 200 keV.

Figure 5. Simulation of a palm size LYSO-based PET detector (Gate—GEANT4 library v10.07.p02). The LYSO crystals are attached with 176Lu intrinsic radiation. The radiation events deposited energy in each crystal are read out independently. The events are recorded in both single mode and coincidence mode (10 ns coincident window).
Download figure:
Standard image High-resolution image2.2.4. Application for unknown 'x' LYSO samples
The material composition verifying method is applied to several LYSO samples with different dimensions and material compositions. The investigated samples are depicted in figure 6 and the corresponding dimensions and densities of these samples are provided in table 2. For the large size LYSO sample (LYSO-S2) 20 min of measurement provide a sufficient statistic for the estimation (about 3 kHz count rate). The measurements of small samples (LYSO-S3) require an extension to 1 h measurement to obtain the adequate spectrum for estimation (∼50 Hz count rate). The composition 'x' values resulting from the estimations are reported in section 3.1.

Figure 6. LYSO crystal samples in different dimensions and compositions are investigated in this study.
Download figure:
Standard image High-resolution image3. Results
3.1. Estimated material composition for unknown LYSO samples
The outcomes of the composition measurements for the unknown LYSO crystal samples are presented in table 3. There are two different types of LYSO materials from the investigation marked as LYSO-S2 and LYSO-S3. The computed composition 'x' values are obtained directly from the intrinsic radiation (Rad) in equation (1), which takes into account the small contribution (about 2.5%–6.8 counts s−1 cm−3) of the external count rate stemming from environmental radiation. This comprehensive calculation enhances the accuracy of the estimated composition 'x' values to be less than 1%.
Table 3. Estimated composition 'x' values from the investigated unknown LYSO sample.
| LYSO samples | Estimated 'x' | Average 'x' |
|---|---|---|
| LYSO-S2-1 | 0.917 | |
| LYSO-S2-2 | 0.923 | |
| LYSO-S2-3 | 0.925 | |
| LYSO-S2-4 | 0.927 | LYSO-S2: 0.923 (±0.7%) |
| LYSO-S3-1 | 0.988 | |
| LYSO-S3-2 | 0.962 | LYSO-S3: 0.975 (±1.3%) |
The resulting estimated 'x' values consistently converge to an average of 0.923 for the LYSO-S2 and 0.975 for the LYSO-S3, with a deviation of ±0.6% and ±1.3% respectively. This consistency in the estimated 'x' values, was observed across varying samples and dimensions. The larger uncertainty of the estimated 'x' value from the LYSO-S3 sample is due to the low statistic count rate of the small LYSO crystal samples. For the large-size crystal sample, the uncertainty is within a range of ±0.7%, underscores the precision inherent in the estimation process. This level of accuracy further enhances the reliability of the established method.
3.2. 2D background map from single mode detection of a PET system
In figure 7(a), we present the 2D count rate map of the 16 × 32 array derived from a 20 min BG simulation measurement of LYSO-S2. This measurement excludes external gamma standard sources, relying solely on the intrinsic radiation of 176Lu. The count rate maps are depicted for different energy threshold cuts of 100 keV, 250 keV, and 350 keV. In figure 7(b), we further illustrate the count rate distributions for all channels of the detector in the single mode under various energy threshold settings and different LYSO materials of LYSO-S1, S2, and S3.
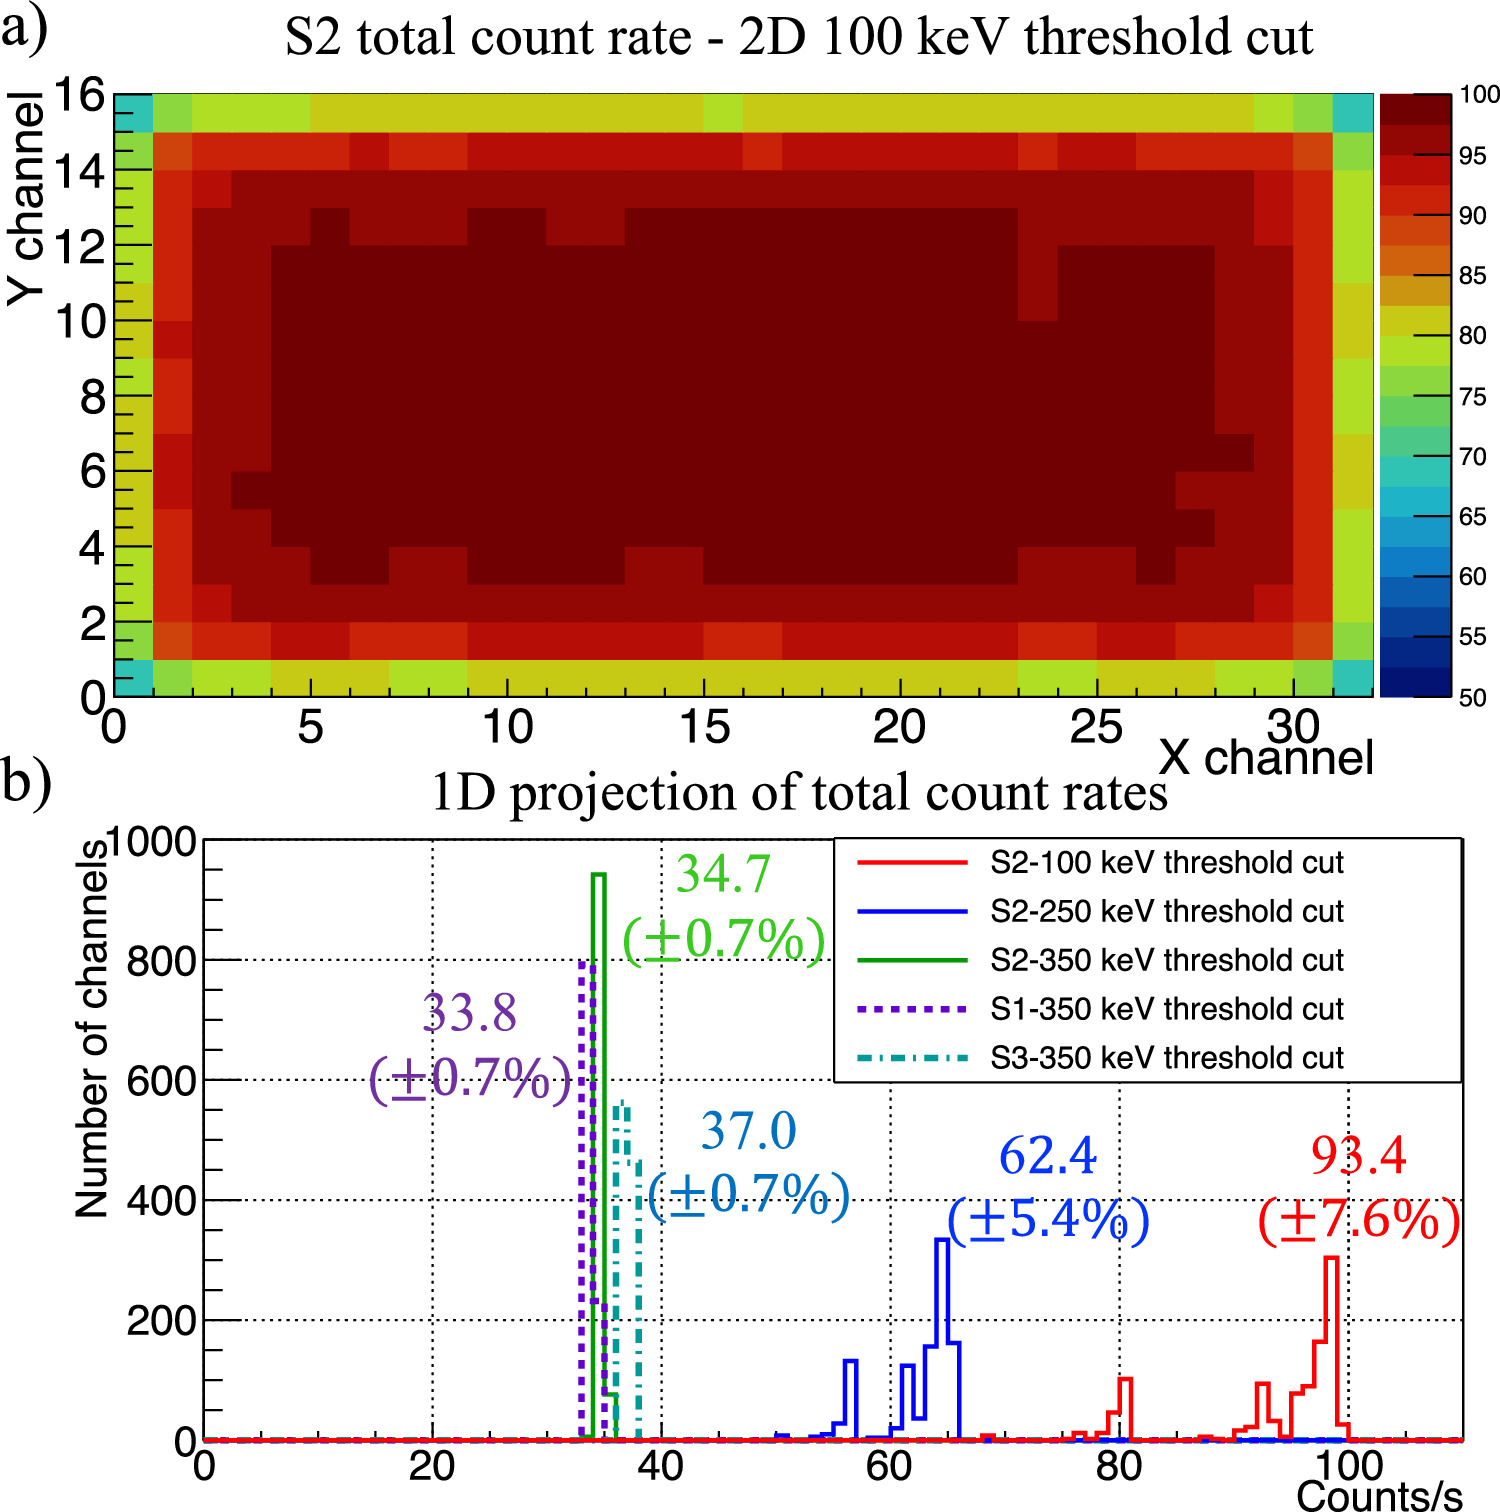
Figure 7. (a) 2D count rate map of from 1 board the LYSO-based 16x32 array PET detector in single mode operation of BG simulation shown in figure 5 using energy threshold cut of 100 keV. (b) 1D distribution of the count rate for all channels under different energy threshold cuts and different LYSO materials.
Download figure:
Standard image High-resolution imageThe signal intensities observed across all detector channels exhibit non-uniform distributions when energy threshold cuts of 100 keV and 250 keV are applied, showing standard variations of 7.6% and 5.4%, respectively. The signal intensity is stronger at the central regions of the detector array and gradually diminishes towards the detector's edges. These variations can be attributed to the contribution of 'neighbor' signals, whose intensity strongly depends on the specific channel's location within the detector array. Crystal channels positioned centrally receive a higher influx of 'neighbor' signals due to their proximity to surrounding crystals, whereas those on the detector's periphery encounter fewer 'neighbor' signals.
In contrast, under the energy threshold cut of 350 keV, the signal intensity across all channels becomes notably uniform, with a negligible variation of 0.7%. The implementation of a 350 keV energy threshold in the ASPET single mode effectively mitigates the contribution of 'neighbor' signals in the spectrum, preserving only the 'local' signals. Since the 'local' signals are independent of channel positions, this threshold setting results in a consistent BG signal count rate of 34.7 counts s−1 measured across all channels of the investigated PET detector, LYSO-S2. The BG count rates of each channel for LYSO-S1 and S3 under similar configurations are 33.8 counts s−1 and 37.0 counts s−1 respectively. The differences in the single-mode BG count rates between LYSO-S1, S2, and S3 are consistent with the relative variations in the 'x' composition of these LYSO materials.
3.3. Dark coincidence in the background of a PET detector
In the coincident mode, events with coincident timestamps within a 10 ns window and energy threshold of 200 keV are recorded. The coincidences can be created from the intrinsic radiation of the detector as gamma events from the 176Lu decays travel from one board and come to interact with the opposite board. The effect of Lu intrinsic radiation extends beyond a single detector module in a PET system and results in real coincidence events that do not correspond to positron emission signals. We simulated the effect of such coincidence in the PET system with two detector modules and 16x32 array crystals. If we desire to increase event acceptance by lowering the energy threshold, the effects of noise from BG coincidences in such configurations must be addressed.
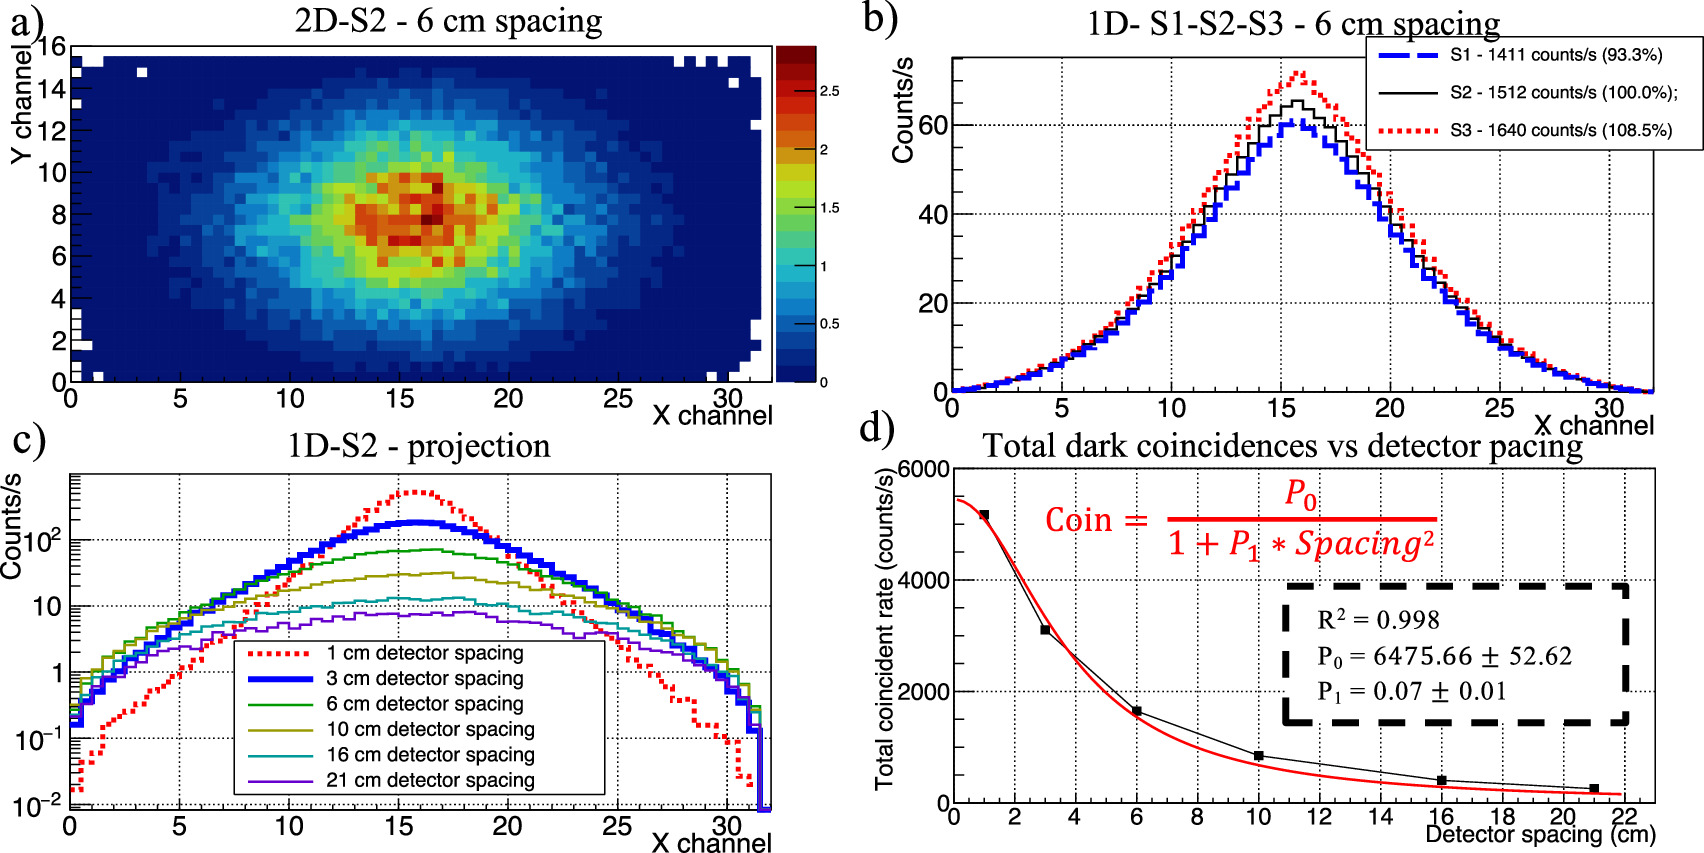
Simulation of the intrinsic radiation from Lu-176 decay in PET detectors was conducted in coincident mode and reconstructed with a back-to-back approach for the central plane. The reconstructed images of coincident BG simulations are displayed in figure 8(a), illustrating a detector spacing of 6 cm. Figure 8(b) presents a one-dimensional (1D) projection of figure 8(a) and compares it with a similar simulation but employing S1 and S3 LYSO crystals. This comparison reveals that the total coincident intensities from S1 and S3 simulations deviate from S2 by approximately 7% and 9%, respectively. These variances exceed the disparity in 'x' values between S1 and S3 compared to S2, which are 2% for S1-S2 and 6% for S2-S3. This variation can be explained by a higher detection efficiency due to additional lutetium concentration. Figure 8(c) compares the intensity distribution of the BG coincidences using 1D projections of the reconstructed images across various detector spacing configurations (the distance between two sides of the detector), and figure 8(d) is the total BG coincident count rate as the function of detector spacing.
Figure 8. (a) Reconstructed 2D images for the middle plan of back-to-back coincident events from BG measurement at 6 cm detector spacing of S2 LYSO crystal. (b) 1D projections of the coincident reconstructed image on the X index dimension for 6 cm detector spacing of S2 LYSO crystal in comparison with S1 and S3. (c) 1D projections of the coincident reconstructed image on the X index dimension for different detector spacing configurations of S2 LYSO crystal. (d) Relation between the total coincident count rate from the background (dark count rate from intrinsic radiation) and the detector spacing of S2 LYSO crystal.
Download figure:
Standard image High-resolution image
The coincident events from the intrinsic radiation of the investigated detector should be considered BG noise in the coincident reconstructed image. The total intensity of the coincident BG noise is about 5 kHz for the 1 cm spacing of the investigated detector and reduced to about 250 Hz for the 21 cm detector spacing case, as shown in figure 8(d). The BG coincident intensity depends mostly on the solid angle between the two sides of the detector and can be modeled by using the function shown in figure 8(d), which accounts for the reduction of the solid angle in the increasing detector spacing. This correction is especially essential for the measurements involving low-intensity sources that are easily affected by the BG radiation.
4. Discussion
The β decay process of 176Lu is typically accompanied by one or multiple gamma transitions occurring within a very short time frame of approximately 1 ns. Given that the scintillation decay time of the LYSO crystal is around 40 ns, measurements of the crystal's intrinsic radiation always encompass a combined event involving an electron and subsequent gamma emissions. Consequently, the BG measurements obtained from the LYSO crystal's intrinsic radiation on the PMT result in a continuous spectrum. These spectra align well with findings from previous research, as detailed in (Wei et al 2012, Afanaciev et al 2015, Alva-Sánchez et al 2018, Enríquez-Mier-y Terán et al 2020, Alva-Sánchez 2022).
The key for the estimation of the material composition of unknown LYSO crystal is the direct one-to-one relation between radiation decay of 176Lu and the scintillation signal emitting from the crystal. Each 176Lu decay event triggers a scintillation signal or pulse, as the secondary electron deposits its entire energy within the LYSO crystal. This direct correspondence between the total counting rate derived from the BG energy spectrum and the intrinsic radioactivity of the corresponding LYSO crystal establishes a clear connection, with only a minor deviation due to external environmental radiation (∼2.5%).
Electrons are the primary source of intrinsic radiation signals in LYSO crystals, and in extreme cases, 600 keV electrons have a limited travel distance of no more than 0.03 mm in LYSO, as noted by Cleland et al (2007). These electrons also deposit their energy along the emission path. Therefore, escape electrons do not significantly contribute to signal loss. The predominant scenario for signal loss occurs when the electron energy produced is below the energy threshold (100 keV for this study) and all gamma rays escape. The proportion of such signal loss to the total captured signals is minimal, amounting to only 0.5% in the extreme cases examined in our study. However, for small fiber-shaped crystals with a diameter of 0.5 mm, the fraction of lost events can increase and become a significant issue. To address this challenge with small fiber-shaped crystals, we propose stacking multiple fibers into a larger array (comprising, for instance, 100 crystals) and capturing their total energy-deposited spectrum using a PMT.
The accuracy of estimating the material composition 'x' value for an unknown LYSO crystal relies on the availability of a reference crystal, a well-defined LYSO sample. In situations where the investigated LYSO crystal is measured using the same PMT as the reference LYSO crystal the contribution of external signals ('ExCount') originating from environmental radiation (∼2.5%–3%) is carefully considered, resulting in estimated uncertainty less than 1% for the composition 'x' values. Conversely, if only the unknown LYSO crystal is accessible and the contribution of external environmental radiation is not accounted for, the uncertainty associated with the composition 'x' value estimation should be around 3%. In this scenario, the investigation of future studies can utilize the 'ExCount' obtained in this study of 6.8 counts s−1 cm−3. This 'ExCount' is derived from the measurement of a well-defined Saint Gobain LYSO crystal with a density of 7.1 g cm−3 and a total dimension of 11.52 cm−3. The reference measurement for 'ExCount' was conducted in a laboratory with natural radiation of about 0.20 μSv h−1. In the absence of the known reference crystal sample, the author recommends using 6.8 counts s−1 cm−3 for 'ExCount', if similar environment radioactivity is met.
The proposed method directly estimates the lutetium concentration within the unknown crystal sample using simple PMT measurements. In case there is a given relation of the material composition, like in this study: Lu2x Y2(1−x)SiO5, all the material composition information can be obtained. Therefore, a similar principle can be applied to other lutetium-based crystals such as LFS (lutetium fine silicate). For example, (Zavartsev et al 2016) has given the LFS definition of: Lu2+2y Si1−y O5+y . In this case, if the lutetium concentration is obtained, the concentration of silicon and oxygen can also be obtained via the 'y' composition relation.
Employing a uniform threshold setting, specifically a 350 keV threshold cut, stabilizes the count rate across every channel in the single-mode operation of LYSO array detectors. This setup effectively filters out 'neighbor' signals, sensitive to channel position, and focuses on 'local' signals, which are consistent throughout the array. This characteristic is crucial for continuous monitoring of detector sensitivity and performance in LYSO-based array detectors. Additionally, by utilizing simulations based on the identified LYSO 'x' material composition, we can model the radiation transmission through a PET detector accurately. This modeling is instrumental in refining image attenuation correction techniques, as described in the works of Rothfuss et al (2014a) and Omidvari et al (2022).
In the coincident mode, employing a low energy threshold (200 keV as used in this study), the intrinsic radiation of the detector generates coincident events that are 'real' in nature but 'fake' in their impact on the positron annihilation gamma (PAG) images. For the detection of low-intensity sources, implementing a lower threshold is essential to enhance detection efficiency. However, this adjustment also leads to the inclusion of coincident events caused by intrinsic radiation, where the size and spacing of the detector influence the intensity of these deceptive signals. Differing from the approach suggested by Yoshida et al (2014) involving BG coincidence suppression using time of flight and multiple coincident methods, which yield suppression efficiencies of about 77% and 30% respectively, our study adopts an alternative strategy. Our research utilizes a different approach by using the material composition information of LYSO crystals for accurate simulation and elimination of BG radiation contributions in PAG imaging. This technique proves particularly effective for accurately analyzing low-intensity PAG sources. This method is also useful in calibrating LYSO-based array detectors, especially in scenarios where standard positron sources are not accessible.
5. Conclusions
This research demonstrates a new measurement approach for accurately estimating the Lutetium concentration in unknown LYSO crystals using only the intrinsic radiation from the decay of 176Lu. By assessing the total intensity derived from BG measurements of the investigated LYSO crystals and of a well-defined reference crystal, the material composition value 'x' of unknown LYSO crystals is estimated with an uncertainty level of less than 1%. The obtained composition 'x' values were used as input for simulation and found good agreement with the measurements in both intensity and shape of the BG spectra. Such agreement indicates the reliability of the estimated 'x' values and the established simulation model. The simulation model was further extended to study BG intrinsic radiation in LYSO-based arrays, representing a PET detector. This study also provides essential information to exploit the BG radiation for LYSO-based detector systems in calibration and monitoring detector performance without the need for external radiation standard sources.
Acknowledgments
The research and development was funded by the Academia Sinica Taiwan thematic research program with the project number AS-TP-112-M02. The authors would like to thank Dr C-H Lin, and Mr Atiq Ur Rahman for providing the resources to experiment and simulate. We also acknowledged the helpful support of Ms Wang Yun Han and Ms Tsai Pei Rong at IoP Academia Sinica during the measurements. We thank Saint-Gobain company and HyperCryst company for making all the LYSO crystal samples in this study. We also appreciate the great support of Dr Yuan-Hann Chang for the project.
Data availability statement
All data that support the findings of this study are included within the article (and any supplementary information files).