
Abstract
Objective. The goal of this work was to assess the potential use of non-contact scintillator imaging dosimetry for tracking delivery in total body irradiation (TBI). Approach. Studies were conducted to measure the time-gated light signals caused by radiation exposure to scintillators that were placed on tissue. The purpose was to assess efficacy in conditions common for TBI, such as the large source to surface distance (SSD) commonly used, the reduced dose rate, the inclusion of a plexiglass spoiler, angle of incidence and effects of peripheral patient support structures. Dose validation work was performed on phantoms that mimicked human tissue optical properties and body geometry. For this work, 1.5 cm diameter scintillating disks were developed and affixed to phantoms under various conditions. A time-gated camera synchronized to the linac pulses was used for imaging. Scintillation intensity was quantified in post processing and the values verified with simultaneous thermolumiescent dosimeter (TLD) measurements. Mean scintillation values in each region were compared to TLD measurements to produce dose response curves, and scatter effects from the spoiler and patient bed were quantified. Main results. The dose determined by scintillators placed in TBI conditions agreed with TLD dose determinations to within 2.7%, and did so repeatedly within 1.0% standard deviation variance. A linear fit between scintillator signal and TLD dose was achieved with an R2 = 0.996 across several body sites. Scatter from the patient bed resulted in a maximum increase of 19% in dose. Significance. This work suggests that non-contact scintillator imaging dosimetry could be used to verify dose in real time to patients undergoing TBI at the prescribed long SSD and low dose rate. It also has shown that patient transport stretchers can significantly influence surface dose by increasing scatter.
Export citation and abstract BibTeX RIS

Original content from this work may be used under the terms of the Creative Commons Attribution 4.0 licence. Any further distribution of this work must maintain attribution to the author(s) and the title of the work, journal citation and DOI.
1. Introduction
Total body irradiation (TBI) in radiotherapy is used as part of a conditioning regimen for patients undergoing hematopoietic stem cell transplantation (Wong et al 2018, Freyer et al 2022), due to any of a range of lymphomas including mycosis fungoides, acute myeloid leukemia, or acute lymphoid leukemia. Due to the nature of the treatment, specific concerns need to be addressed including dose homogeneity and sparing of sensitive tissues such as lungs. Therefore, the AAPM TG-29 specifies use of in vivo dosimetry to verify that the delivered dose matches the prescribed dose plan. TBI treatments are routinely performed with C-arm linear accelerators (linacs) with AP-PA or lateral field pair arrangements (Springer et al 2016, Wong et al 2018), helical tomotherapy systems (Wong et al 2018, Cleuziou et al 2021) or cobalt therapy systems (Burmeister et al 2018).
Commonly used methods for TBI in vivo dosimetry include thermolumiescent dosimeters (TLDs), optically stimulated luminescence dosimeters (OSLDs), and MOSFET detectors (Rodriguez-Cortes et al 2012, Springer et al 2016, Wong et al 2018, Cleuziou et al 2021). Each method has its own set of considerations and limitations in use. The readout delays for TLDs and OSLDs can be a limitation in treating patients in a hypofractionated TBI schedule where patients may receive a single treatment per day, or several treatments in a single day over several days and more rapid knowledge of the whole body distribution of dose would be desirable (Lambert et al 2007, Belkacemi et al 2018, Wong et al 2018). Diode detectors give immediate readout and so do not have these delays, but their sensitivity changes with repeated exposures (Van Dyk et al 1986, Yadav et al 2020), and their application to the patient with tethered cables and recording of the placement locations requires extra time. They also exhibit a time dependence of the readout where the signal fades with time, especially with low doses (Yadav et al 2020). It would be more desirable to have dosimetry that has lower time-requirements of the clinical staff and provides accurate rapid measurement where sensor positioning was instantaneously recorded by the systems.
A new dosimetry method, non-contact scintillator imaging, has been introduced for total skin electron therapy (TSET) and utilizes scintillators placed on or near the patient, coupled with a time-gated camera to measure the dose administered in real time (Bruza et al 2018). It was found that time-gated imaging can be used to capture these images and with automatable image processing, quantify the signal from each scintillator, even in the presence of ambient lighting. In addition, previous studies showed that the dose-scintillation response was linear, with reports of administered dose quantified at clinical treatment accuracy of 5% against reference TLD dose values (Bruza et al 2018, Tendler et al 2019). However, all this previous work was performed with electrons at TSET dose rates which can be as high as 2500 cGy min−1 (Schiapparelli et al 2010). Thus, in this study, TBI dose rates were examined, which can be significantly lower in the 5–10 cGy min−1 range (Travis et al 1985). The combination of these lower dose rates and the extended SSD lowers the overall signal detected by the cameras (Bruza et al 2018), and so the purpose of this study was to assess the detection efficiency and dose quantification accuracy under these conditions.
We directly assessed scintillator imaging as a method of remote dosimetry for TBI treatment conditions, with the key hypothesis being that the dose delivered under typical TBI conditions could be quantified even in room light conditions, and with the normal extended SSD and reduced dose rates routinely used. Additionally, while TSET was tested with electron beams, TBI treatments with photon beams and the use of plexiglass spoilers and bolus all add to the background signal and reduce the potential accuracy of measurement. Therefore, the purpose of this work was to assess the accuracy and determine the limits to accurate dose measurement for the full set of real-world conditions for TBI.
2. Materials and methods
2.1. Scintillators
Several 1 mm thick EJ-212 scintillators (Eljen Technology, TX) were cut with a diamond tipped CNC mill into 1.5 cm diameter disks. The rear face and sides of each scintillator were spray painted with white reflective paint EJ-510 (Eljen Technology, USA) to ensure that light from the scintillator was reflected to and emitted only from the front face. The scintillators were then augmented by affixing EJ-284 wavelength shifters (Eljen Technology, TX) onto the front face of them, which absorbed the scintillation and re-emitted the emission at a wavelength shifted value to better align with the camera's photocathode's DQE spectrum. These configurations are demonstrated in figure 1, and both the emission spectrum of the Ej-212 scintillators and DQE and emission spectrum of the EJ-284 wavelength shifters are both available on the Eljen website.
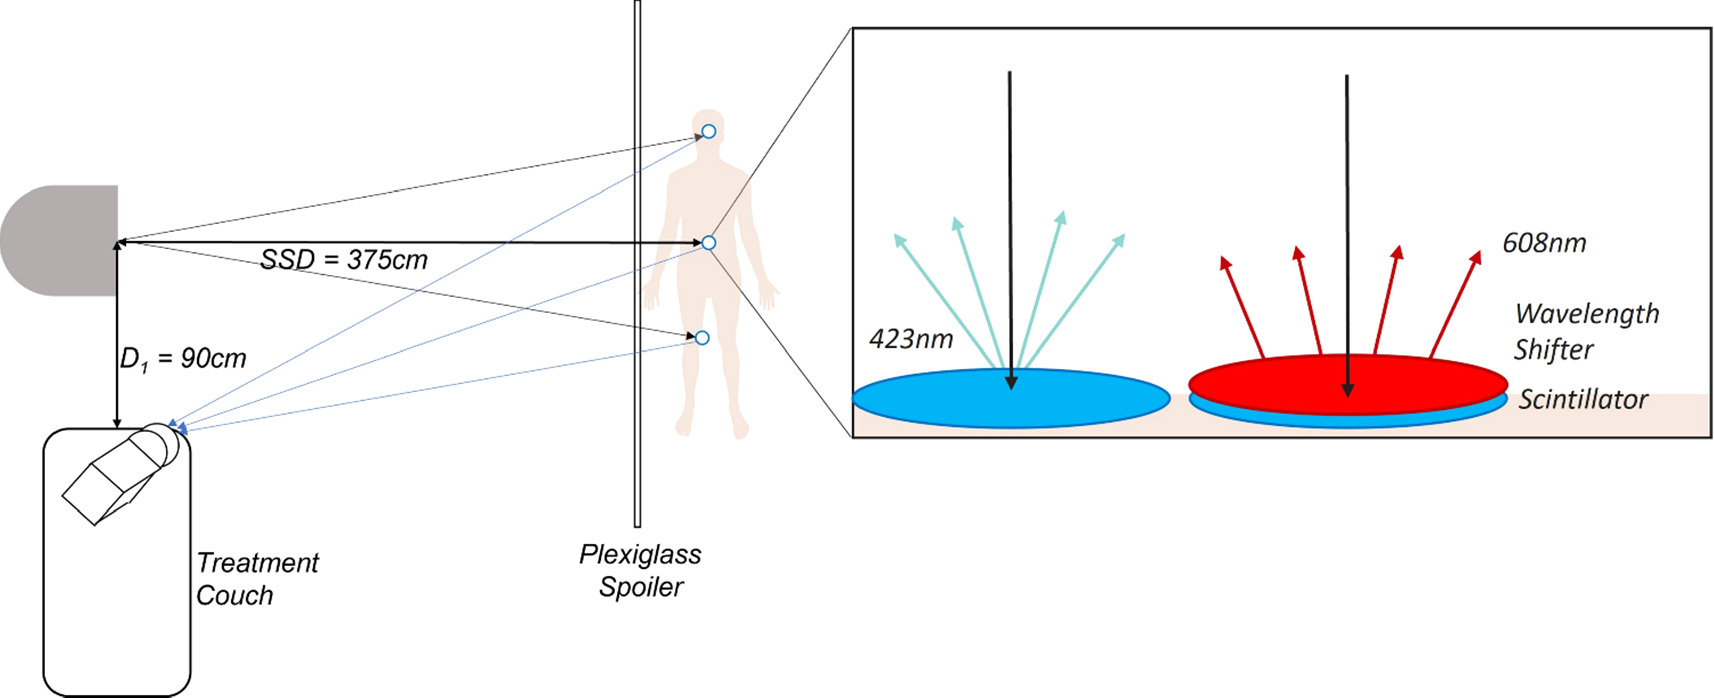
Figure 1. Diagram showing the distances and setup conditions of the TBI experiments and demonstrating the influence of wavelength shifters on scintillators, specifically that as x-rays are absorbed by the scintillator visible light is emitted by the scintillator which is then absorbed by the wavelength shifter and reemitted at a different wavelength.
Download figure:
Standard image High-resolution image2.2. Phantoms
Two phantoms were used in this study. A 2.5 cm thick, flat anthropomorphic tissue phantom made of a silicone rubber compound (Dragon Skin, Smooth-On Inc., PA) which was then colored with SilcPig optical scatter and absorption pigments (Smooth-On Inc., PA) to provide visible tissue-like Cherenkov emission and attenuation properties that match soft mammalian tissues (Decker et al 2022). This was simulated tissue used to measure the effects of barriers such as bolus and the plexiglass spoiler. The bolus consisted of sheets of ClearSight bolus (ClearSight, RT) of varying thicknesses to provide tissue for dose to build-up. ClearSight bolus was chosen because of its transparency (Adamson et al 2017). The spoiler consisted of a 1 cm thick acrylic sheet with an area of 30 × 30 cm2, which matched that used in the clinical setup (Wong et al 2018).
The second phantom was for whole body imaging simulation, using a Rescue Randy Manikin (Simulaids, UK). This was used to represent patient positioning and topography for simulated TBI treatment and was treated and imaged with an SSD of 375 cm.
2.3. TLDs
TLD measurements were performed to compare with the scintillator results. TLDs were selected due to their dose reproducibility and accuracy, 2% and 5%, respectively (Bruza et al 2018). To ensure the TLDs and scintillators received similar doses, the TLDs were placed directly adjacent to the scintillators, 10 mm away, on the surface of the manikin phantom. Beam profile data showed that the scintillator and TLD being 10 mm away would allow for less than 1% variance of beam intensity with our extended SSD. The TLDs selected were TLD-100 chips (LiF:Mg,Ti) (Thermo Fisher Scientific, USA) with nominal dimensions of 3.2 mm × 3.2 mm × 0.9 mm. They were annealed using the standard University of Wisconsin-Madison Medical Radiation Research Center (UWMRRC) annealing protocol (Nunn et al 2008, Reed et al 2014). Prior to each irradiation, TLDs were placed in an aluminum tray and annealed at 400 °C for 1 h, allowed to cool to room temperature, and then annealed at 80 °C for 24 h. There was a 24 h waiting period between the completion of the 80 °C anneal and irradiation. TLDs were read with a Harshaw (Oakwood Village, OH) 5500 hot gas reader 24 h after irradiation, and the same annealing procedure was performed prior to the next set of measurements. All readings from a given set of measurements were read out at the same time to avoid the effect of any day-to-day variability of the TLD reader. TLDs were read by preheating to 100 °C, and then collecting signal as the temperature was increased to 350 °C at a rate of 15 °C s−1. The temperature was then held at 350 °C for a total collection time of 26 and 2/3 s. There was no fading correction applied as the glow peaks of interest were sufficiently stable over the time interval of this experiment and all TLDs were read within 3 d (Luo 2008).
Dose quantification was determined by irradiating calibration TLDs to a known, NIST-traceable absorbed-dose to water. The TLDs were irradiated using a Hopewell G100 60Co irradiator following University of Wisconsin Accredited Dosimetry Calibration Laboratory (UW-ADCL) calibration protocols. TLDs were put into a waterproof Virtual Water (VW) holder and placed at 5 cm depth in the UW-ADCL's standard water tank where the absorbed-dose-to-water rate is well established. Calibration TLD readout data was corrected to account for the known energy-response difference for TLDs between 60Co and 10 MV energies. Internal investigation found that TLDs exposed to 10 MV under respond by 3% relative to those exposed to 60Co, and so this was accounted for in the calibration.
2.4. Radiation source
Experiments were performed with a Varian TrueBeam (Varian Medical Systems Inc., Palo Alto CA, USA) linear accelerator. Each experiment used 10 MV photon beams and a dose rate of 100 MU min−1. When performing experiments with the flat phantom, the field size was set to 10 × 10 cm2 and when using the manikin, the field was set to 30 × 30 cm2. The gantry angle was either set to 0◦ for tests on the flat phantom or 274.4◦ for tests on the manikin. 274.4 was selected to place the manikin's umbilicus at the center of the field.
To test the linearity of scintillation response to dose, the manikin was irradiated several times with each successive irradiation delivering more monitor units. In addition, during this work the manikin was given its own treatment plan and was administered a dose based on TBI calculations which accounted for the manikin's separation distance, field size, normal machine output at the given SSD and beam energy. The phantom was assumed to be tissue equivalent for the purpose of the dose calculation. A total of 3762 MU evenly divided into a pair of AP/PA beams was required to deliver the target whole body dose of 2 Gy.
2.5. Imaging system
A C-Dose camera (DoseOptics LLC, Lebanon NH USA) coupled with a Nikkor f/1.2, 50 mm lens (Nikon Inc., Japan) was used to image the scintillator response. The camera was operated at 350× intensifier gain. The camera is designed to be sensitive to Cherenkov radiation which became the background signal when imaging scintillators. To do so it utilizes a Photonis High-QE Red photocathode (Photonis, Merignac France), the DQE spectrum of which is available on the Photonis website. When imaging scintillators the camera auto triggers upon detecting each linac pulse and captured both active scintillation during the pulse and between pulses for background images. These raw images were compiled into composite background-subtracted files that showed the cumulative images from all linac pulses, in the C-Dose camera software. These were then read out as raw image files and processed with MATLAB (The MathWorks Inc., USA).
2.6. Image processing
The composite image was processed in MATLAB (Mathworks, Natick MA, USA) using foreground and background marking techniques to isolate the scintillator signal. A binary mask was produced which highlighted the scintillator signal, isolated from the background. Each scintillator in the binary mask was eroded by a number of pixels based on camera-to-scintillator distance to remove edge signals that were indeterminate. This slightly reduced size binary mask was then reapplied to the original image as the zone to quantify the average intensity. The scintillators were then isolated and ordered using a watershed transform using the gradient of signal intensity to establish a separation between the scintillators. The mean signal from each scintillator was recorded. This process is demonstrated in figure 2. A region of interest (ROI) was then drawn on the image, near the scintillators, and a mean signal within this ROI was used to calculate the signal to background ratio (SBR) for each scintillator. The signal to noise ratio (SNR) was characterized by dividing the mean signal of each scintillator by the standard deviation of the signal within the same region.
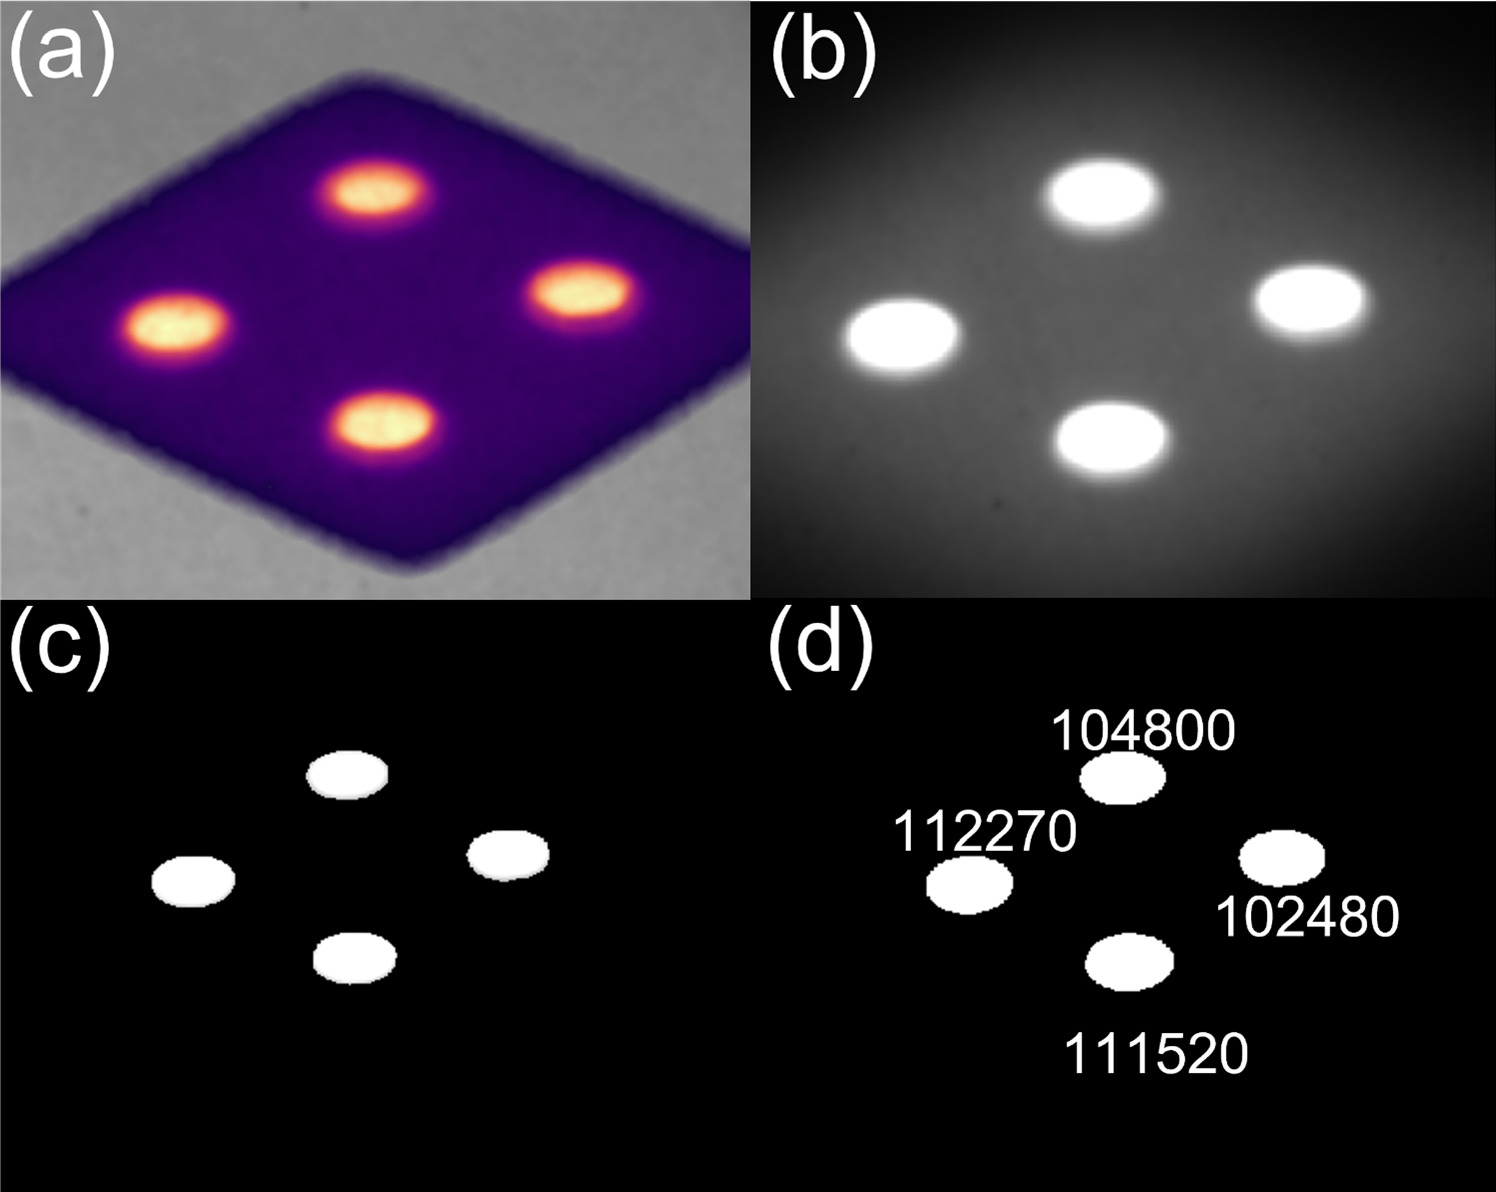
Figure 2. Demonstration of how C-Dose images (a) are imported into MATLAB as a composite image (b), turned into a binary map which highlights the scintillators and erodes the signal from the sides of the scintillators (c). This map is then applied to the imported image to produce an intensity map of just the scintillator locations and the watershed transform isolates the scintillators from each other which allows for individual reporting (d).
Download figure:
Standard image High-resolution image2.7. Beam flatness and dose gradient
Beam flatness and dose gradients were measured on a whiteboard with dimensions 4' tall and 6' wide placed at SSD 375 cm. The whiteboard was chosen as it could be easily moved into or out of the field and was large enough to cover a 30 × 30 field, which when projected to the new SSD extended to 112 × 112 cm. Tape was placed on the whiteboard to measure the limits of the camera's field of view and to ensure that the field lights were fully within the field of view. The tape was then subsequently removed before irradiating to avoid their interfering with the resulting image. The whiteboard was irradiated several times and the dose on its surface was measured with a C-Dose camera. Pixels on the resulting image were binned along the horizontal and vertical axes to create dose profiles, which are shown in figure 3. The profiles were normalized to the average of a 20 cm window in the center of the field. This allowed measurement and visualization of the lateral dose gradients and beam symmetry at the treatment SSD. The curves were fitted to polynomial functions with R2 values of 0.92 for the horizontal profile and 0.90 for the vertical profile.
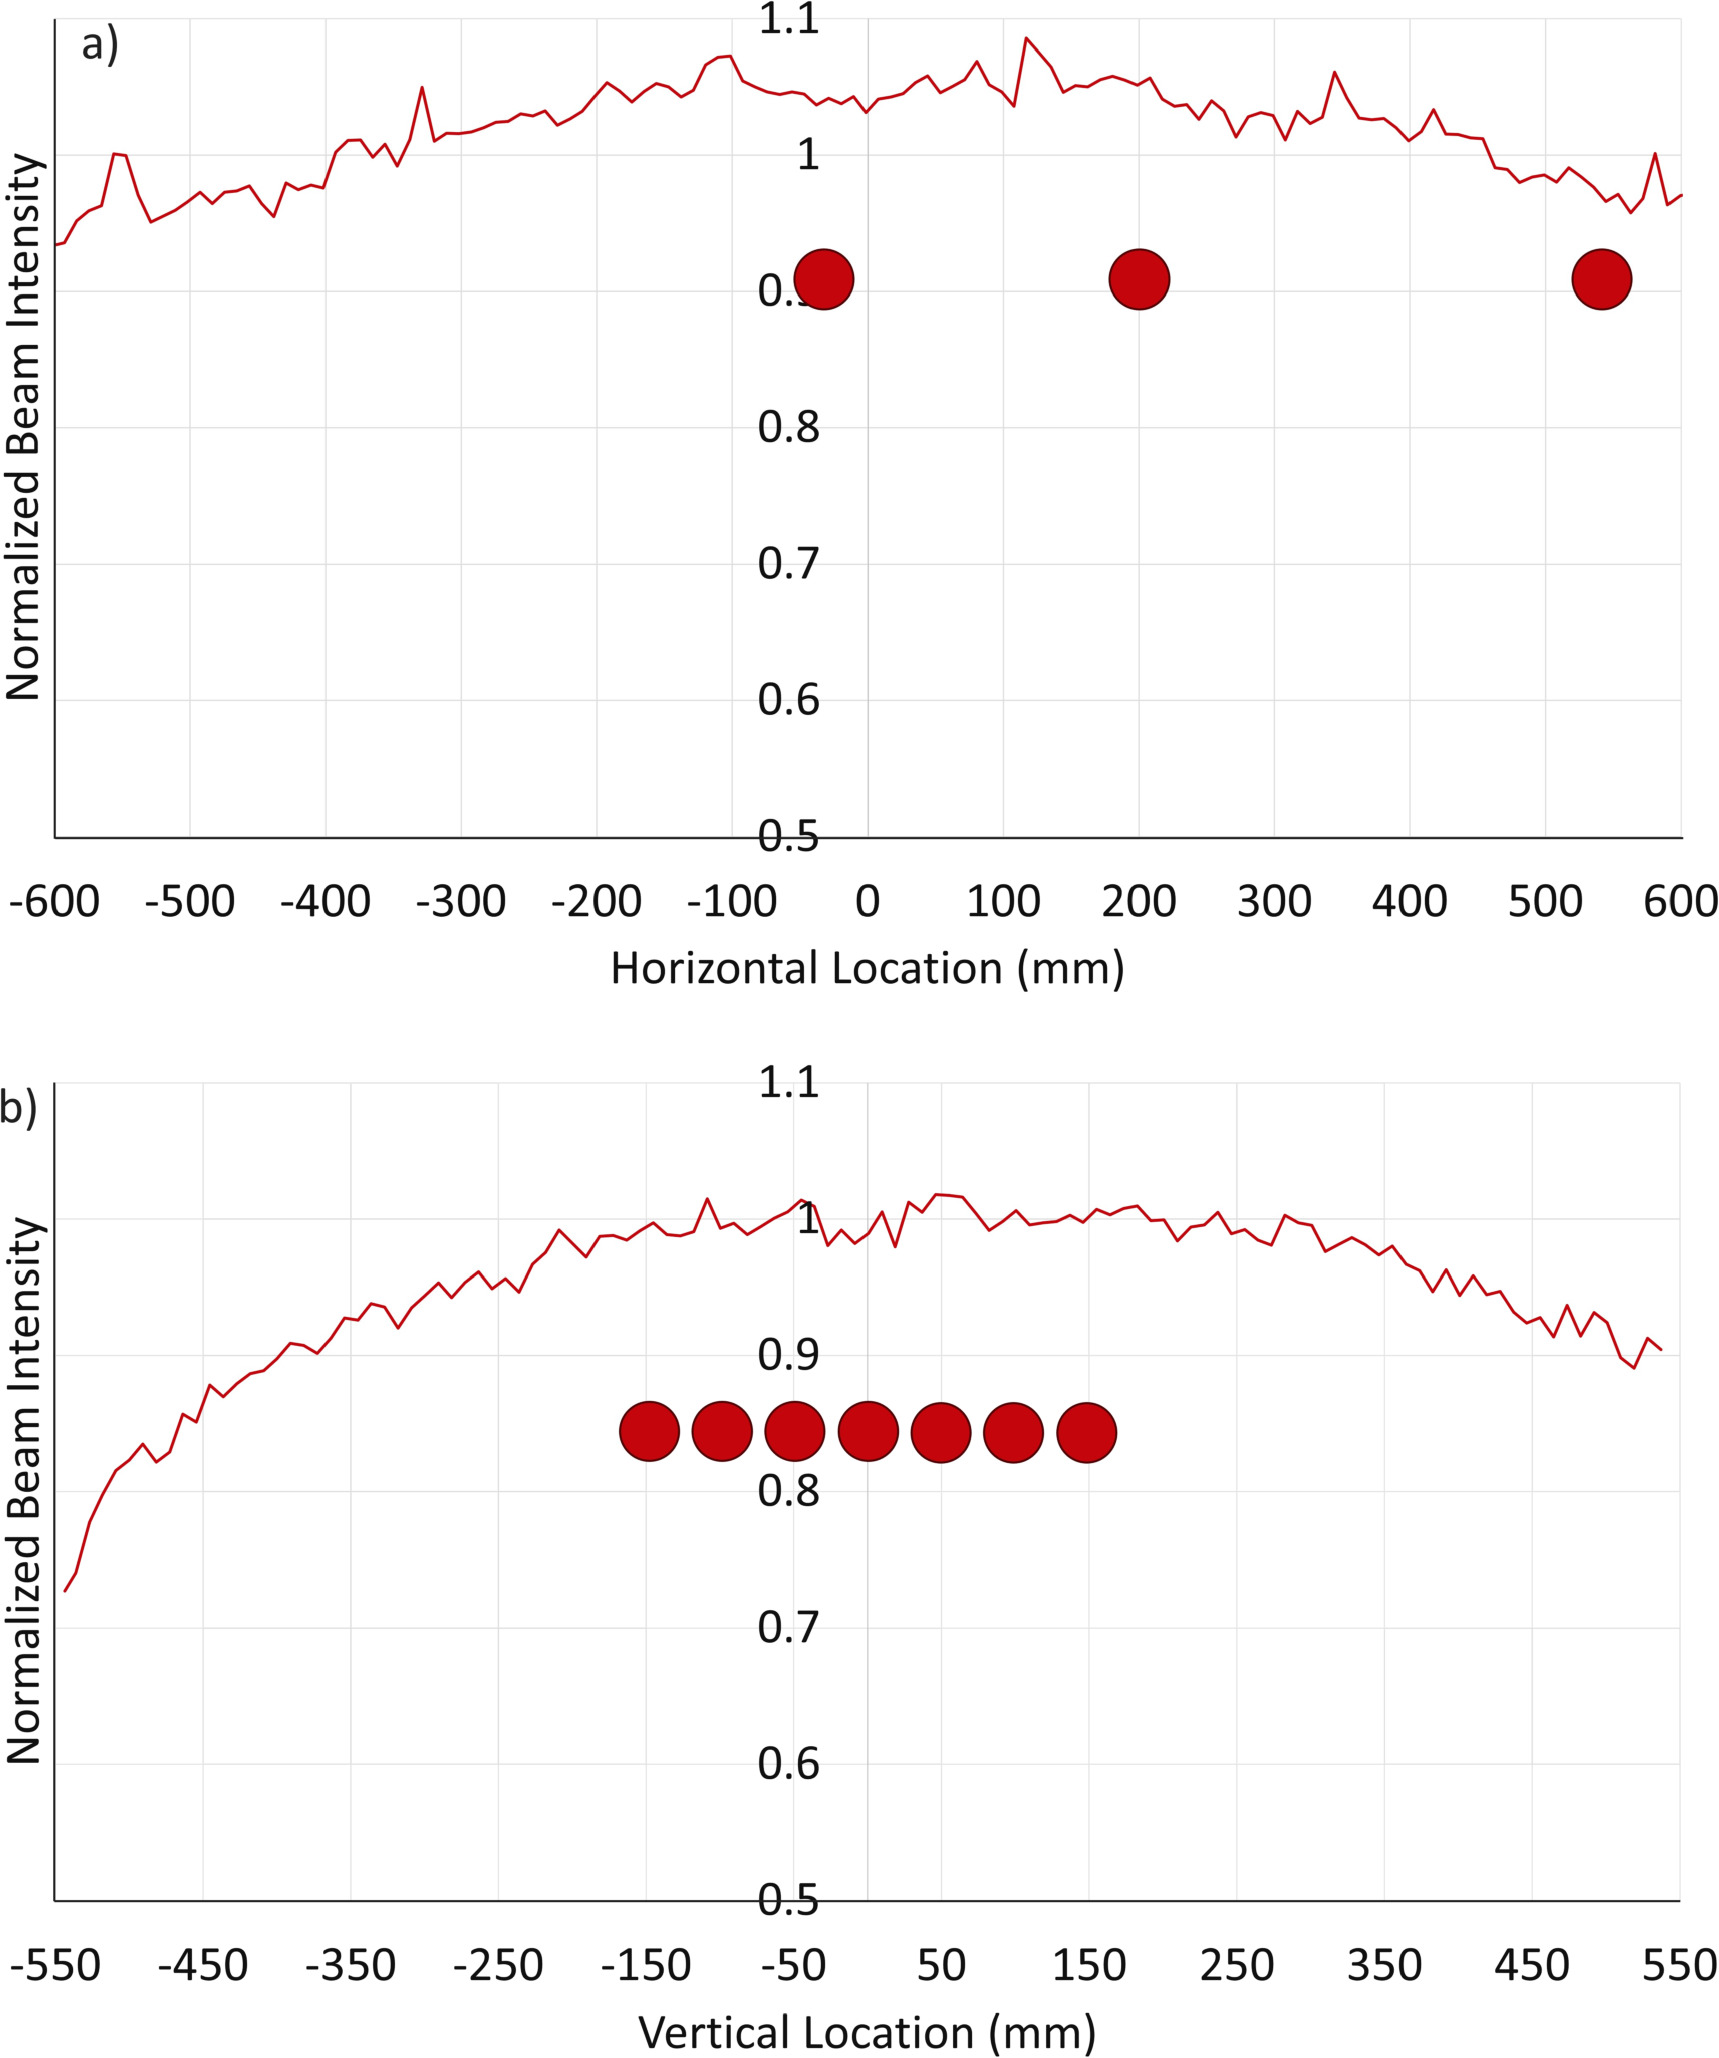
Figure 3. Beam intensity profiles for both the horizontal and vertical components of the beam as measured at SSD 375 cm. The profiles have been corrected for the inverse-square law, and the dots in the horizontal profile (a) represent the locations of the scintillators as placed in figure 6. Those on the vertical profile (b) represent the scintillator locations as placed in figure 7.
Download figure:
Standard image High-resolution image2.8. Patient support
To investigate the influence of scatter from the gurney on which the patient may rest during treatment we placed the Rescue Randy Manikin on a patient transport stretcher (721 Transport Stretcher, Stryker, USA) and placed a scintillator at several points along the phantom's waist. A 5 cm thick, 30 × 30 cm2, block of solid water was placed behind the phantom to provide backscatter as large sections of the phantom are hollow.
This experiment was repeated with three solid water phantoms with dimensions 30 cm tall, 30 cm wide, and 5 cm thick, taped together to form a single 30 × 30 × 15 phantom. This phantom was placed such that the beam was incident on and normal to a 30 × 30 cm2 face. The increased thickness helped to stabilize the solid water on the stretcher and simulate the thickness of a patient's abdomen. The scintillator was placed at seven locations on the phantom, starting at the bottom of the beam-facing side of the phantom and gradually moving to the top, along the linac crosshair's X-axis, in 5 cm increments. The scintillator was irradiated to 50 MU three times at each location. A depiction of this setup is shown in figure 4. 50 MU was chosen as a time saving measure because of the decreased dose rate used in TBI. The result was a dose profile with unique scatter characteristics emanating from the patient transport stretcher.
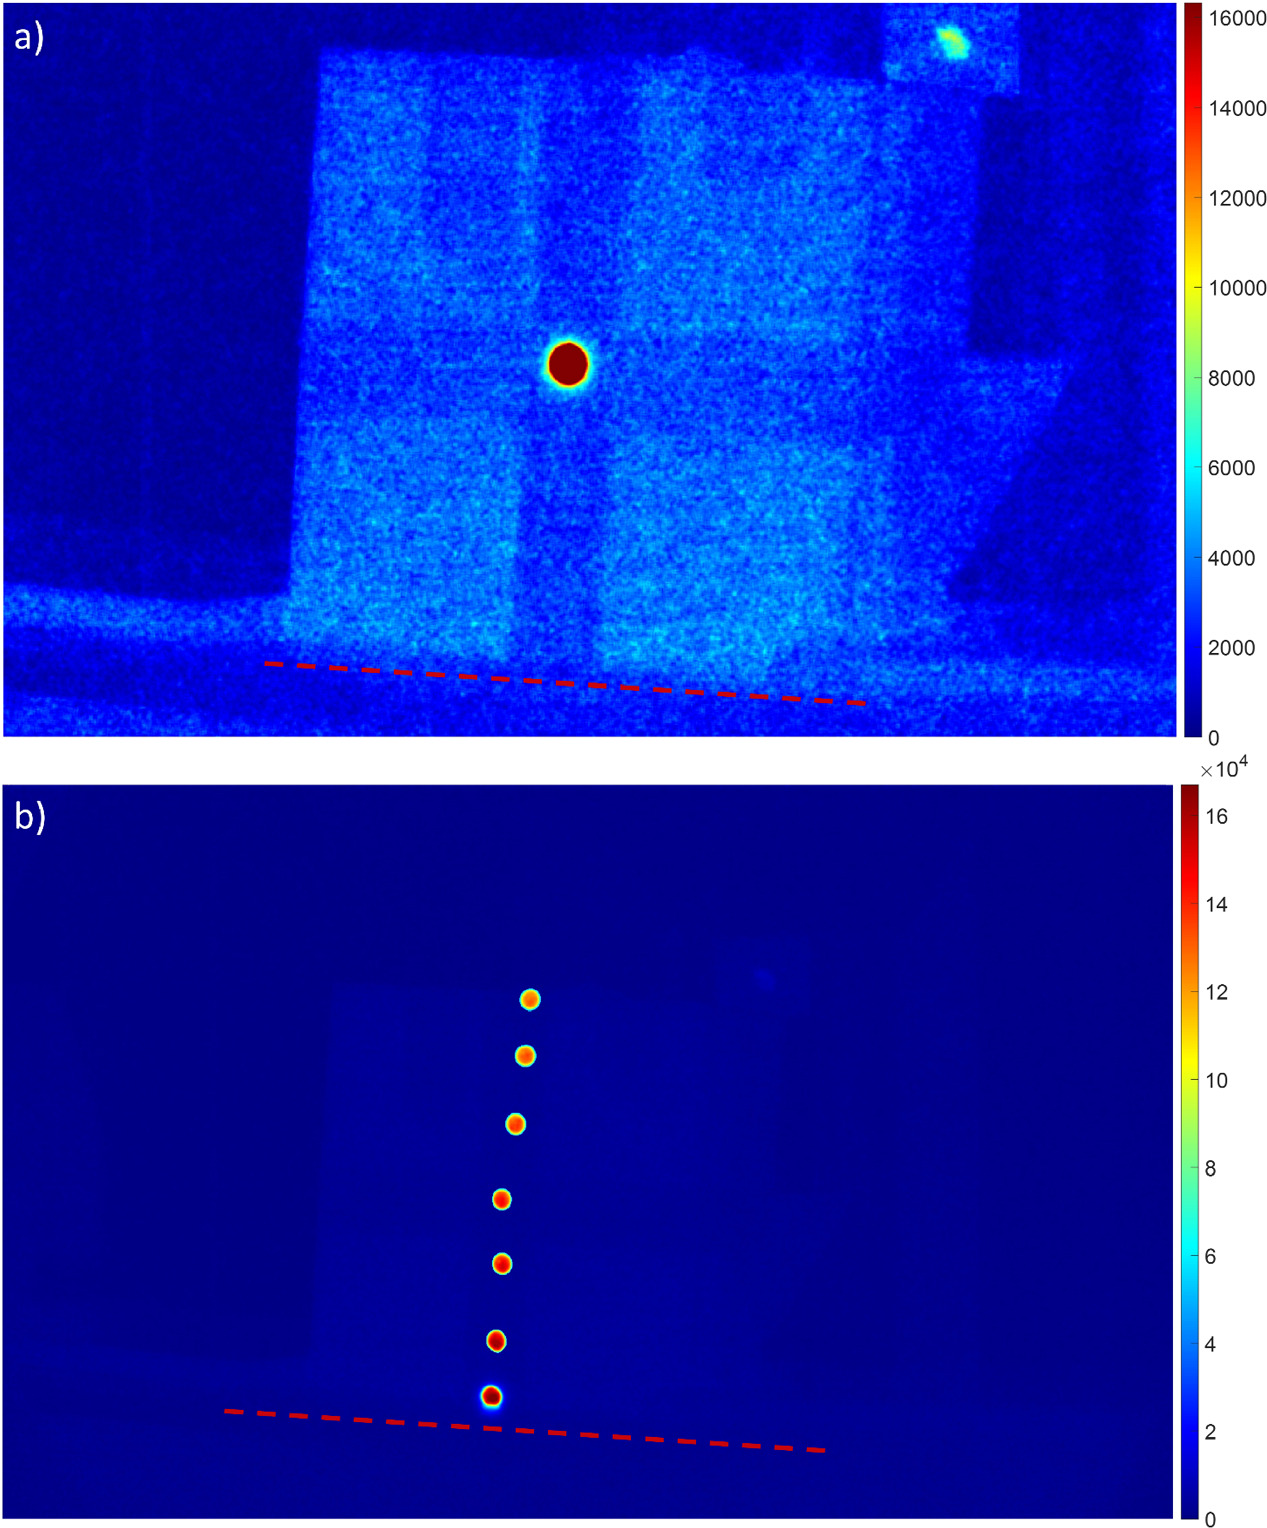
Figure 4. Demonstration of the effect of the scatter from the transport stretcher on scintillation. (a) shows the scatter dose on a solid water phantom. (b) shows the mean signal of a scintillator placed at various locations on a vertical profile of the same phantom. As distance from the surface of the stretcher increases, the scatter—and thus the scintillation signal—decreases. The dotted red line shows where the phantom meets the surface of the stretcher.
Download figure:
Standard image High-resolution image2.9. Room lighting
To quantify the effect the room lighting conditions would have on the scintillator signal we measured the ambient light in the room, several times, under several lighting conditions. In addition to varying the light levels, various amounts of dose buildup material including the 1 cm thick plexiglass spoiler and ClearSight bolus of varying thicknesses were utilized. All measurements were taken on the manikin with the lux meter pointed towards the nearest light source and to measure the ambient room light around the scintillators and phantoms we used a United Scientific Supplies LXM001 digital lux meter. The phantom was irradiated with 50 MU delivered for each test and thus received a constant surface dose for each dose buildup material used, though the surface doses differed between buildup materials.
3. Results
3.1. Effects of spoiler and bolus
When implementing the plexiglass spoiler and bolus it was observed that both the surface dose, shown in figures 5(a)–(c) and the scintillation response increased. The relationship remained linear but with increasing surface dose the phantom surface emitted greater amounts of Cherenkov light, to which the camera used is sensitive. This reduced the signal-to-background ratio between the scintillators and the surface of the phantoms. The plexiglass spoiler was also shown to increase the variance of the signal from any single scintillator. This is because the plexiglass also emitted Cherenkov light, which created a speckle-like artifact in the images, as is shown in figure 5(d), and the SNRs and SBRs of scintillators with and without plexiglass and utilizing various thicknesses of bolus are shown in table 1.
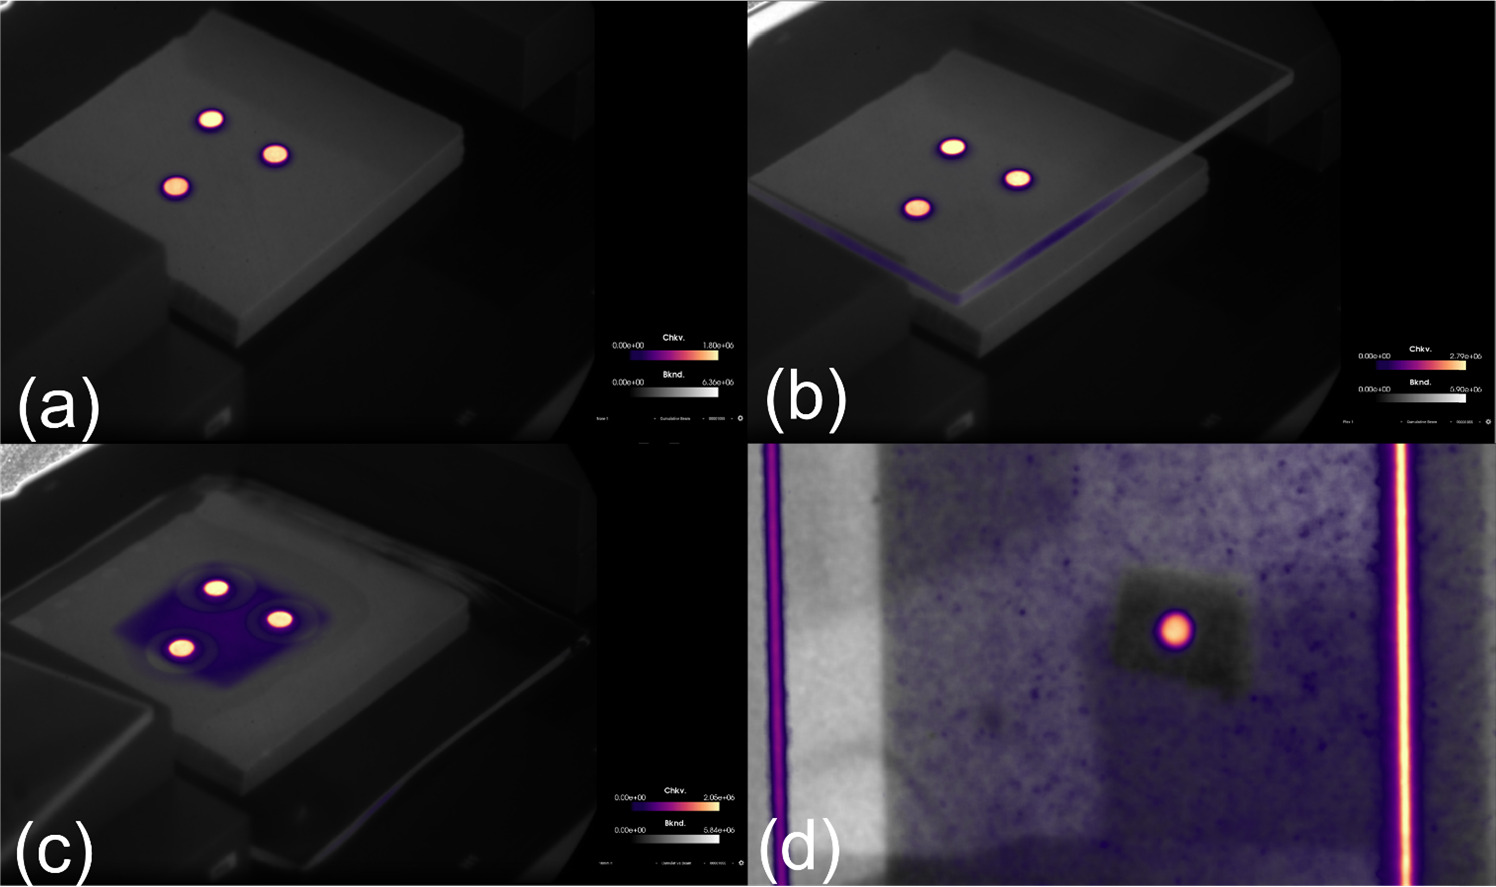
Figure 5. The effect of including the plexiglass spoiler on surface dose is shown in images (a) without either spoiler or bolus, (b) with the plexiglass spoiler, (c) with 10 mm water equivalent bolus; (d) shows the internal Cherenkov emission of the plexiglass which adds additional background to the scintillator signal. As the combined thickness of the bolus and the spoiler approached 2 cm the surface of the phantom was around 90% of the PDD for a 10 MV photon beam which created considerable Cherenkov radiation.
Download figure:
Standard image High-resolution imageTable 1. Table showing the SNR and SBR of scintillators placed under boluses of varying thickness with and without the presence of a plexiglass spoiler.
| Dose buildup material | SNR | SBR |
|---|---|---|
| None | 15.2 | 25.6 |
| Plexiglass | 12.3 | 22.0 |
| 3 mm Bolus | 15.2 | 9.2 |
| 3 mm Bolus and Plexiglass | 14.3 | 7.7 |
| 5 mm Bolus | 13.4 | 6.2 |
| 5 mm Bolus and Plexiglass | 13.1 | 5.0 |
| 10 mm Bolus | 14.3 | 5.2 |
| 10 mm Bolus and Plexiglass | 13.8 | 4.4 |
3.2. Angular dependence
To measure variation in signal with respect to angle between the scintillator and the camera and treatment head, a scintillator was placed at SSD 375 cm on a 30 × 30 × 5 cm solid water phantom. The phantom was initially placed such that the 30 × 30 face of the phantom was normal to the beam. The phantom was gradually rotated counterclockwise such that the face which was normal to the beam was now turned 90° and normal to the linac's central axis. Mean signal was plotted as a function of the angle between the scintillator and the treatment head and the result is shown in figure 6.
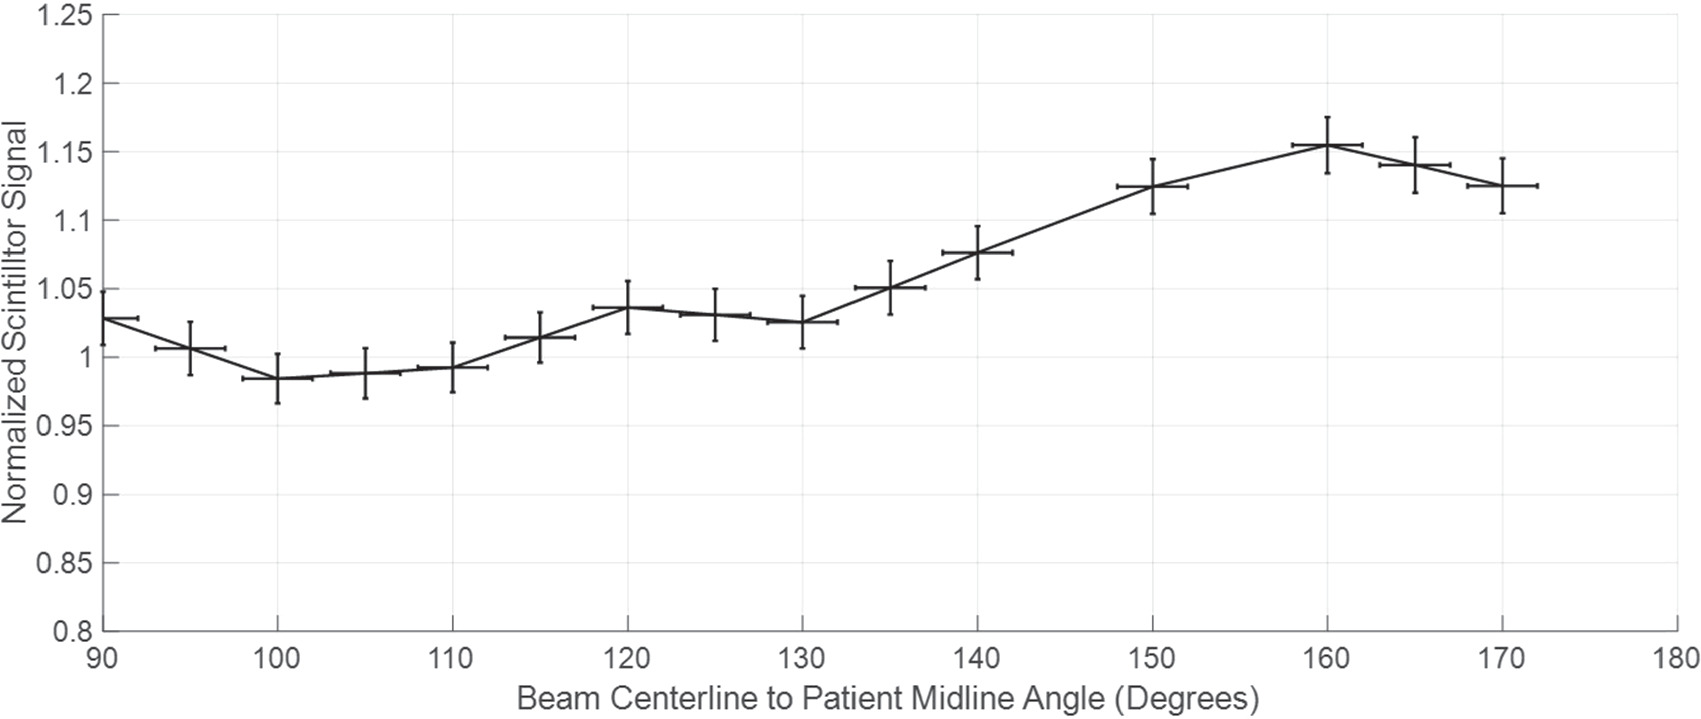
Figure 6. Demonstration of the normalized scintillator signal as a function of the angle between the radiation beam center line and the patient's midline. As the Solid Water phantom, to which the scintillator was affixed, was rotated, the incidence angle from the LINAC was measured and matched to the corresponding mean scintillation. After a beam centerline to patient midline angle of 120° the signal increases to over 5% of the orthogonal and above 135° the signal would need to be calibrated. The plotted line shows the average normalized signal over several tests.
Download figure:
Standard image High-resolution image3.3. Scintillation-dose linearity and dose calibration
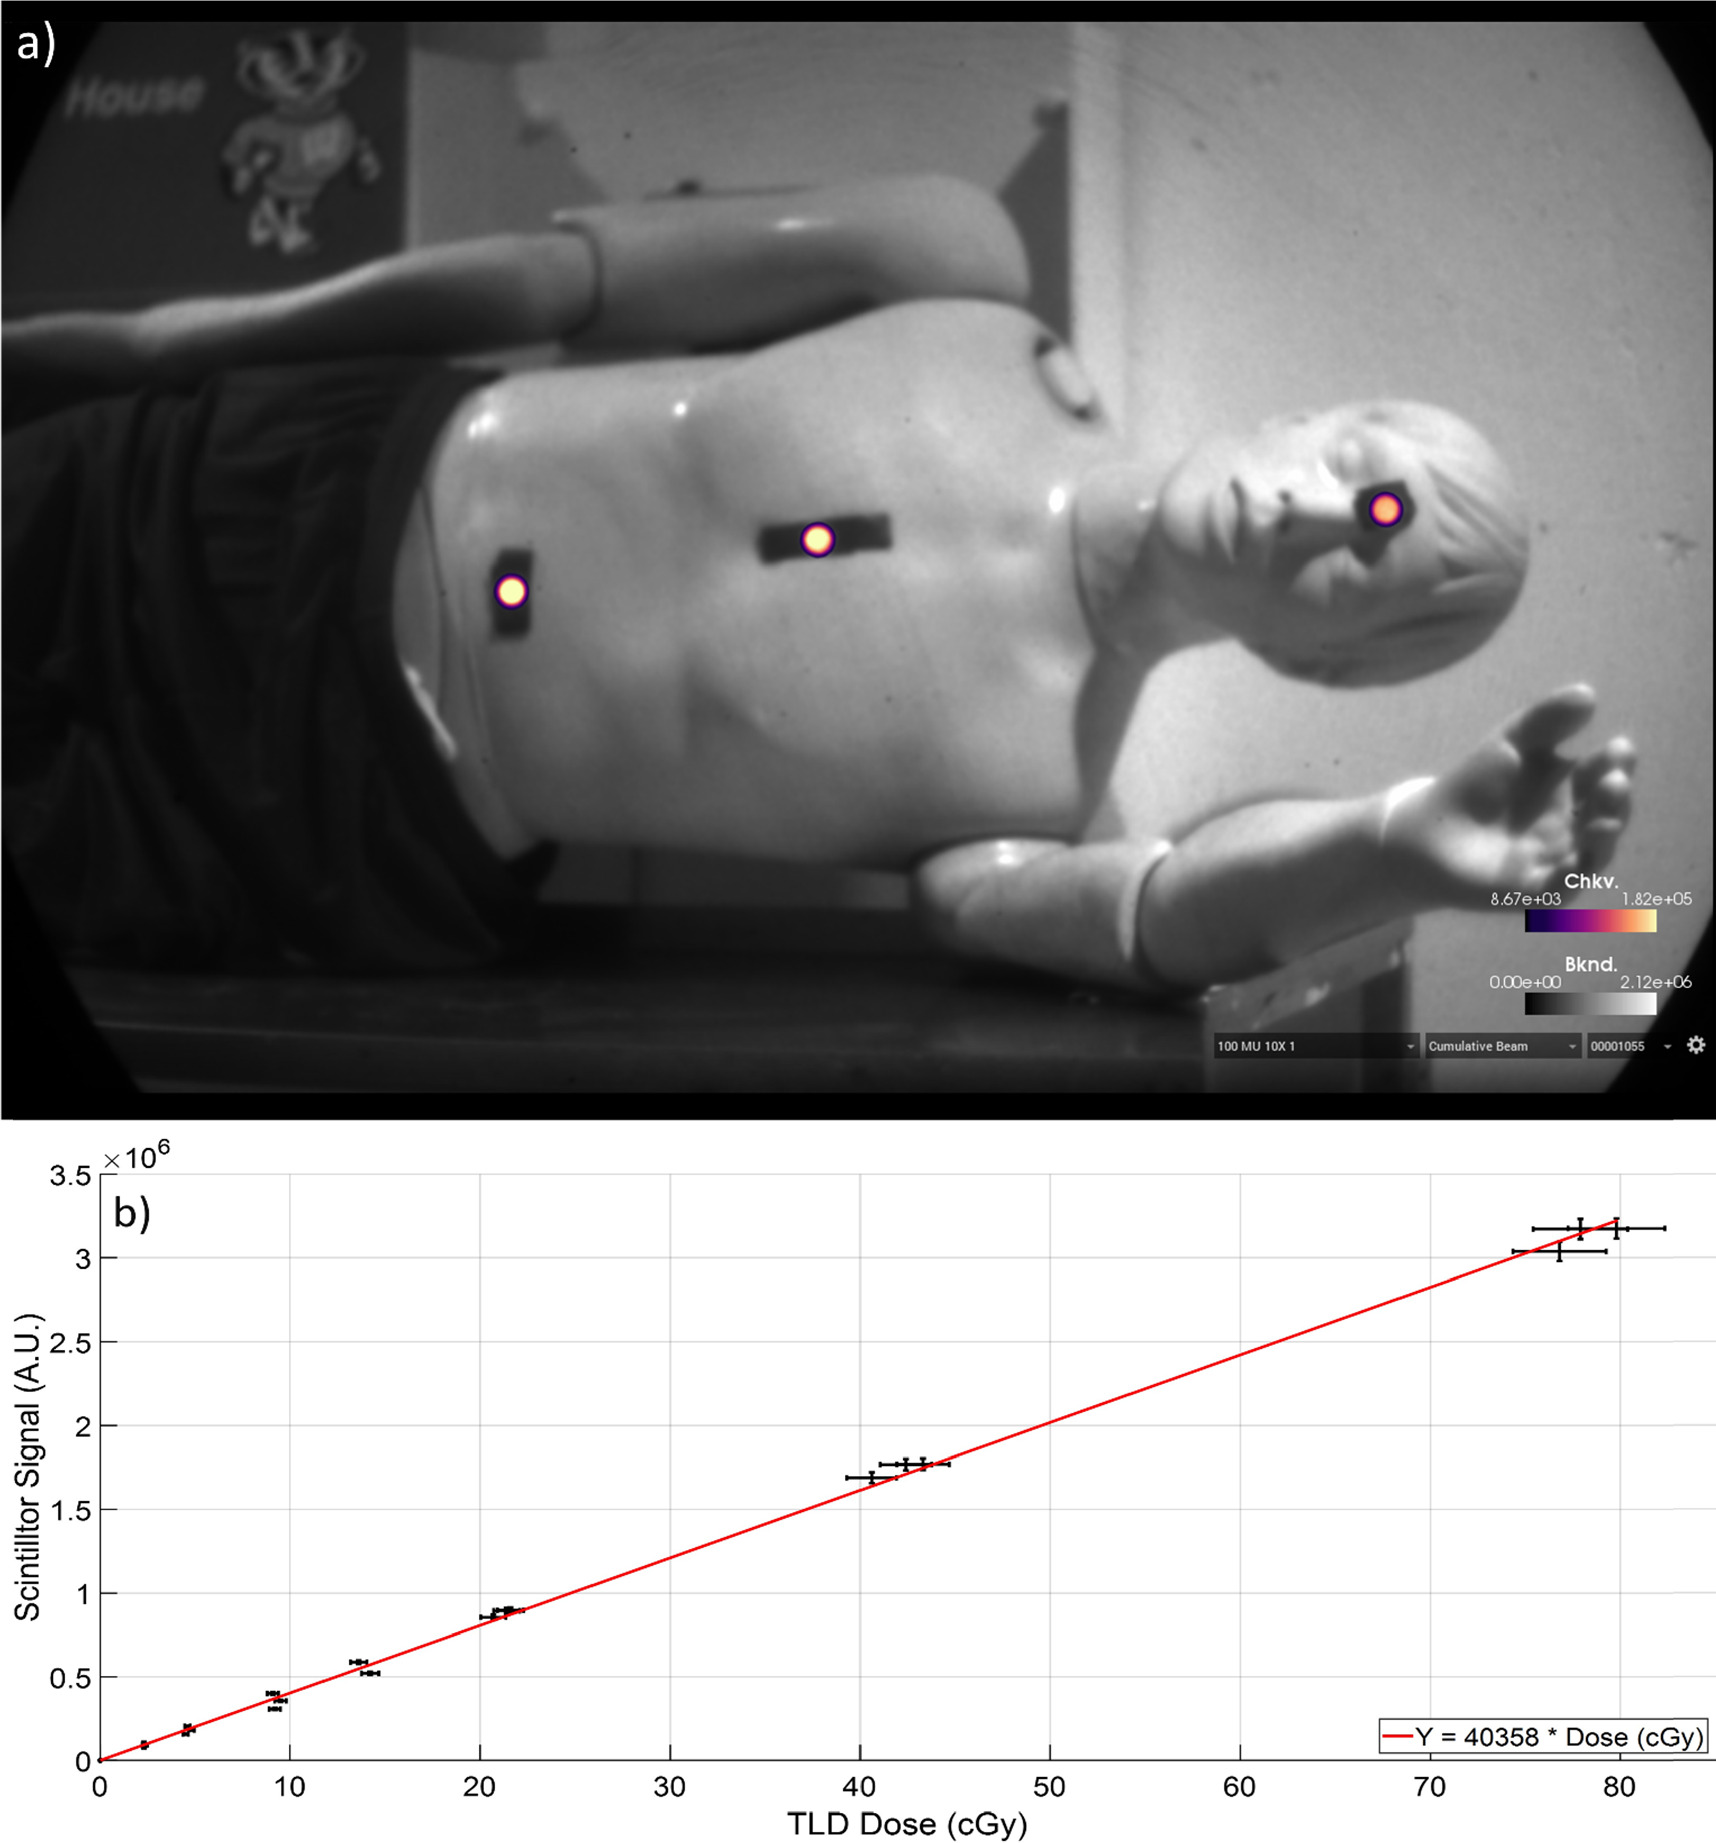
To evaluate the scintillator response to dose, a range of monitor units was delivered to the phantom under typical TBI conditions. Scintillators were placed on the phantom's abdomen, chest, and eyes as shown in figure 7(a). Each delivery was verified using TLDs and the relationship between scintillation and dose is shown in figure 7(b). Dose at each scintillator location for each treatment was compared to the absolute dose provided by TLDs at each location. The relation between the absolute dose and the scintillator signal demonstrated good dose-scintillation linearity (R2 = 0.998). Mean uncertainty (δ S) for scintillator measurements (s) was calculated using the standard deviation (σs) of the scintillator responses (s) using equation (1), and the same was done for TLD measurements (t) and their corresponding standard deviation (σt ). This resulted in mean uncertainties of 0.8% and 1.6% respectively. The dose to scintillation calibration curve for this data thus has an uncertainty (δC) of 1.8%, obtained with equation (2)


Figure 7. Imaging of scintillators was done in real time on the phantom. (a) Scintillators were placed along the patient's midline in accordance with AAPM TG-29. TLDs were placed adjacent to scintillators. (b) TLD dose values plotted against scintillator mean values across phantom surface. Dose-scintillation relationship is linear in each TLD error is plotted as horizontal error bars, while scintillator error (1σ) is plotted as vertical error bars.
Download figure:
Standard image High-resolution image
3.4. Scatter from patient support
As the scintillator was moved closer to the stretcher's surface, the total dose increased. This was observed directly with the C-Dose camera. It was observed with scintillators and as an increase of Cherenkov radiation from the phantom, which can be seen in figure 4(a). The phantoms' midline axes were used as the references for comparison of scatter dose across each respective phantom. Scatter accounted for a signal variation from that of the midline up to 13% on the manikin and 19% on the solid water phantoms which is shown in tables 2 and 3 and in figure 4. Given the beam profiles it appears that this increase of dose was a result of scatter from the patient table.
Table 2. Table showing the change in scatter dose on the mannikin phantom relating to the distance of the site measured from the surface of the patient support stretcher. The standard deviation for these measures is between 0.2% and 0.4%.
| Vertical location on manikin | Normalized and inverse-square corrected scintillation | Difference from midline |
|---|---|---|
| +12 cm | 0.88 | −12% |
| +6 cm | 0.92 | −8% |
| 0 cm | 1.00 | 0.0% |
| −6 cm | 1.10 | +10% |
| −12 cm | 1.13 | +13% |
Table 3. Table showing the change in scatter dose on the solid water phantom relating to the distance of the site measured from the surface of the patient support stretcher. Standard deviation was between 0.6% and 0.7%.
| Vertical location on phantom | Normalized and inverse-square corrected scintillation | Difference from midline |
|---|---|---|
| +15 cm | 0.90 | −10% |
| +10 cm | 0.92 | −8% |
| +5 cm | 0.96 | −4% |
| 0 cm | 1.00 | 0% |
| −5 cm | 1.04 | +4% |
| −10 cm | 1.12 | +12% |
| −15 cm | 1.19 | +19% |
3.5. Room lighting effects
The camera's ability to subtract background light meant that outside of the extreme cases of a completely dark room, the scintillator signal remained constant with a 2.8% standard deviation of scintillator signal across varying lighting conditions when no dose buildup material was present. As the plexiglass and bolus materials were added, the scintillator signal became less constant, and the standard deviation of the signals increased with the signal having the highest standard deviation of 6.3% when using 3 mm of bolus with the plexiglass spoiler. The other buildup materials also increased the standard deviation of the measurements though they remained between 3.4% and 4.1% standard deviation.
4. Discussion
TBI is a challenging therapy that requires accurate dosimetry for the patient as multiple radiosensitive structures are in the radiation field. Non-contact scintillator dosimetry could provide near instant feedback to clinicians with reduced uncertainty. The tests completed showed that non-contact scintillator imaging shows promise in monitoring dose in real time during TBI. In this study we were able to image the scintillator signals at the extended TBI SSD and using appropriately reduced dose rates, and the relationship between the dose delivered and the scintillator signal was found to be linear. The scintillator signal was also isolated from the background despite it being relatively weak and short lived when compared to background lighting conditions, and though Cherenkov radiation was detected by the camera, the scintillator signal was large enough to be isolated from the Cherenkov. When the angle between the linac gantry and the surface being irradiated was less than 30°, we were able to quantify the scintillator signal vary less than 5% when compared to an orthogonal setup. There is concern that with as the scintillator rotated the thickness, in relation to photon path, increases. This is suspected to be the cause of the large increase in signal beyond 45 °. Dose build-up materials such as plexiglass spoilers and clear bolus can also be used with the camera and scintillators and the signal can pass through the materials. Imaging of radiation dose on human geometry was also shown to be possible with the inclusion of an anthropomorphic phantom. We were also able to show that a beam profile at an extended SSD can be measured using a C-Dose camera and a whiteboard, and we were able to visualize and quantify the increase of total patient dose due to scatter from patient support structures used in TBI. Regarding the observed signal from the whiteboard, we believe it to be a Cherenkov emission as the whiteboard used had a surface made of melamine which has not been found to scintillate.
The effect of incident angle was re-examined here for the geometry used, as it is important to understand the effect of angle between the camera and the scintillator and how this affects the measured intensity at the camera, for a fixed camera position. The camera position was chosen to gain an optimal view of the patient, and so it is likely that this will not change in position. In examining the angle variation, the signal intensity showed a <5% change from scintillators rotated within the range of 0°–30° deviance from orthogonal to beam centerline and <10% change in angles up to 45°. Beyond 45° the signal may need to be corrected depending on clinical goals. Given these observations, we would recommend using the scintillator imaging with less than 30° range from the orthogonal to the linac head, without correction. It is also very possible that correction algorithms could be developed for the angle of view based upon the ellipticity of the scintillator in the image, or some other factor such as surface guidance imaging. This is an aspect that will need to be fully worked out if this type of imaging dosimetry is fully clinically deployed and where scintillator use is perhaps less well controlled. When comparing these results to those of Bruza, et al in their work with TSET (Bruza et al 2018), there are some differences between their methodology and ours. Chief among these differences are the beams, dose rates used, and scintillator geometry. Photon beams and electron beams behave differently, both in air and in tissue, and the higher dose rates of TSET compared to TBI produce vastly different amounts of signal in each image. Another consideration is that different scintillators—in terms of material, size, and shape—were used by each group. The scintillators used in this work were affixed to wavelength shifters which increased their thickness and contributed to the difference in results.
Room lighting conditions did not prove to be an issue for dose linearity. The software used subtracts the background data from the scintillator data and works well under all conditions where there isn't a large specular reflection on the manikin or the scintillators. The camera does saturate at high levels of ambient light, which can be mitigated by reducing the gain of the camera. The software does struggle to subtract background where there is no ambient light at all which can result in overreporting of the signal.
Dose buildup materials can complicate the signal. Both the plexiglass spoiler and the bolus used increase the surface dose, and thus the Cherenkov signal on the surface of the patient. This can reduce the detectability of the scintillators. Both materials also attenuate the signal. The plexiglass spoiler scatters light from the scintillator predictably in accordance with Fresnel's equations, but also will produce its own Cherenkov radiation which may be added to the scintillator signal. This increase in signal is small when compared to the signal from the scintillator but is still present. Bolus also attenuates the signal from the scintillator but is not as predictable as the plexiglass, with the greatest measured attenuation being 15.3% of the signal from the scintillator. In either case, the relationship between the scintillator signal and the measured dose remains linear, but further research into the use of clear bolus should be considered as bolus is used routinely to estimate dose to deeper patient anatomy.
In measuring the effect of the patient bed transport structure on the measured total dose it was found that there was a large increase in the total scintillation signal between regions of the patient which are relatively nearer to the surface of the transport structure, increasing with proximity to the stretcher. After comparing these results with the beam profile data, it was concluded that the stretcher contributes additional scatter dose to the patient's surface. This may be an area for future dosimetry research. It is also worth mentioning that if a patient is undergoing standard AP/PA treatments, with the patient rotating from shoulder to shoulder between beams, that both lateral sides of the patient would be receiving approximately equal amounts of scatter from the stretcher while the patient's midline would remain largely unaffected. To ensure that the beam profile data and scintillator data were accurate both were corrected for using the inverse-square law. When correcting the scintillator signal, we found that the corrections amounted to a 0.2% change in value. This is largely since the scintillators used to measure the effect of patient bed scatter were separated from the center of the field by 15 cm, while the SSD was 375 cm which resulted in an increase of 0.3 cm from the radiation source.
There are still a few caveats to full deployment that will ultimately limit the use case of this approach. Perhaps the most important and obvious of the issues is that a clear line of sight is needed between the camera and the patient and there are several things that could confound this. This will always be an issue for this type of dosimetry unless mirrors or additional cameras are deployed to image the other sides of the patient.
5. Conclusions
The linear relationship between TLD dose and scintillation shows that non-contact scintillator dosimetry can be used to measure the dose to any area of interest with 1.8% uncertainty which is in line with TLD accuracy. This linear relationship between dose and scintillator signal persists with the use of plexiglass spoilers and bolus and is present despite the challenges present with TBI treatments, such as decreased dose rate and increased SSD. While room lighting conditions do affect the detection and isolation of the scintillator signal from background room light and background Cherenkov signal, this can be overcome by dimming the room lights. Tests were performed on human geometry and found that the angle between the scintillator and the linac treatment head should be limited to less than 30° to avoid corrections. Patient transport and support structures used in TBI, such as gurneys and stretchers, were found to increase the superficial dose to the patient by up to 18% near the support. Future work in this space would revolve around maximizing signal for the scintillators, which would help combat room lighting constraints.
Acknowledgments
This work was supported by NIH grant R01 EB023909, the Carbone Cancer Center core grant P30 CA014520 and with support from the University of Wisconsin-Madison Department of Human Oncology and the University of Wisconsin Medical Radiation Research Center (UWMRRC).
Data availability statement
The data cannot be made publicly available upon publication because no suitable repository exists for hosting data in this field of study. The data that support the findings of this study are available upon reasonable request from the authors.
Conflicts of interest
Brian Pogue is the Co-Founder and president of DoseOptics LLC.