
Abstract
Objective. Focused ultrasound (FUS) neuromodulation non-invasively alters brain activity, likely via acoustic radiation force with dynamics of the pulse repetition frequency (PRF). PRF impacts neuromodulation as well as indirect auditory activation, a confound linked to skull vibrations. This study aimed to minimize these vibrations, by adjusting and randomizing PRF, and determine their impact on FUS-induced motor activity. We hypothesized that: the skull would vibrate most at a specific PRF; randomizing PRF would reduce skull vibrations without affecting motor responses; and FUS would yield motor activity while actuator-induced skull vibrations would not. Approach. Three objectives were studied in parallel using C57Bl/6 mice (n = number of mice used per objective). First, skull vibration amplitude, measured as a percentage of maximum amplitude per treatment, was recorded via contact microphone over a range of PRFs to assess the PRF-dependency of skull vibrations (n = 19). Vibrations were then compared between random and fixed PRFs (n = 15). Lastly, motor responses were compared between fixed 1.5 kHz PRF FUS, random PRF FUS, air-puff stimulation, sham stimulation, and vibration induction via piezoelectric actuator (n = 30). Main Results. The study found amplitude peaked at 1.51 kHz (88.1 ± 11.5%), significantly higher than at 0.54 kHz (75.5 ± 15.1%; p = 0.0149). Random PRF reduced amplitude by 4.2% (p = 0.0181). Motor response rates to actuator-induced skull vibrations at the PRF (5.73 ± 6.96%) and its third harmonic (22.9 ± 22.7%) were not significantly different than sham (14.1 ± 11.6%), but lower than FUS (70.2 ± 16.3%; p < 0.0001). Significance. Based on these results, PRF near 0.5 kHz may best avoid skull vibrations, while random PRF could be utilized to slightly reduce vibration amplitude. The results also suggested that skull vibrations likely do not significantly impact motor responses to FUS neuromodulation.
Export citation and abstract BibTeX RIS

Original content from this work may be used under the terms of the Creative Commons Attribution 4.0 licence. Any further distribution of this work must maintain attribution to the author(s) and the title of the work, journal citation and DOI.
Introduction
Neurostimulation, the practice of inducing activity in brain tissue, has proven to be a valuable tool in treating neurological conditions and in basic neuroscience research. For example, electrical stimulation of the subthalamic nucleus using deep brain stimulation (DBS) is a proven therapy for Parkinson's Disease (Williams et al 2010). DBS can aid in the treatment of other movement disorders like essential tremor and dystonia, as well as epilepsy, depression, obsessive-compulsive disorder, and stroke recovery (Miocinovic et al 2013). However, DBS requires invasive surgery. To avoid risks to patients inherent in brain surgery, non-invasive methods have been developed, such as transcranial direct current stimulation (tDCS) and transcranial magnetic stimulation (TMS). tDCS is conducted by passing a weak current through the brain between at least one anode and one cathode arranged on the scalp. This method has shown positive clinical outcomes in major depressive disorder (Brunoni et al 2016), and has potential indications in other psychiatric disorders, stroke recovery, and chronic pain treatment (Fregni et al 2021). TMS, using magnetic fields applied to the brain in specific patterns, can induce plasticity in neural circuits (Ziemann 2004). Repetitive TMS is also used as an intervention for treatment-resistant depression (Rizvi and Khan 2019), while other potential applications are being explored in stroke recovery, Alzheimer's disease, and sleep disorders. However, tDCS offers limited focality, and neither tDCS nor TMS can accurately target deep-brain areas (Wagner et al 2007).
Focused ultrasound (FUS) offers the potential to circumvent the limitations of these techniques by using spatially resolved, non-invasive acoustic energy that can penetrate to subcortical regions. Low-intensity focused ultrasound (LIFU) can directly modulate the excitability of neural tissue in humans (Lee et al 2016a), non-human primates (Deffieux et al 2013), sheep (Lee et al 2016b), and rodents (Tufail et al 2010). LIFU has also been shown to generate action potentials in the earthworm giant axon (Vion-Bailly et al 2019). Therefore, the refinement of FUS neuromodulation would provide a method with the potential to accurately and non-invasively modulate activity in regions throughout the brain.
FUS neuromodulation uses LIFU to modulate activity in the brain. While high-intensity FUS has been used to thermally ablate brain tissue (by sending a continuous emission for several seconds at high power), LIFU uses pulsed sub-MHz burst emissions at a given pulse repetition frequency (PRF), typically 200–2000 Hz, and moderate intensities, around 0.1–10 W cm−2. HIFU also uses sub-MHz frequencies, but with 100% duty cycle to reach intensities >1000 W cm−2, while LIFU uses duty cycles of 30%–50%. By regulating these parameters, LIFU for neuromodulation uses less than 1% of the total power needed for a significant thermal increase (King et al 2013, Constans et al 2018).
A prevailing hypothesis regarding the mechanism underpinning FUS neuromodulation is mechanical effects on neuronal membranes (Tufail et al 2010, Menz et al 2019, Yoo et al 2022). The deposition of mechanical energy into tissue is called acoustic radiation force (ARF). FUS applies ARF to the conducting medium, as evidenced by micron-level displacements of rigid spheres in tissue-mimicking phantoms (Aglyamov et al 2007) and of micro-electrode arrays in ex vivo brain tissue (Kim et al 2021) caused by FUS stimulation.
As the phospholipid bilayer is sensitive to strain, ARF causes deformation in membranes. This changes the distance between charges on the inside and outside of the neuron, altering the potential across the membrane based on the laws of capacitance (Plaksin et al 2016, Ikushima et al 2019). Furthermore, the ion channels that dictate transmission of electrical activity can be affected by slight changes in conformation, altering their conductance of current (Kubanek et al 2016, Yoo et al 2022). FUS stimulation of neural activity in the ex vivo salamander retina has been attributed to ARF based on observations of microscale tissue displacements and lack of tissue heating (Menz et al 2019). This is further supported by work that showed neurological responses to LIFU were extinguished in genetic knockouts of mechanosensitive proteins (Yoo et al 2022). ARF could also introduce nearby proteins in the membrane, leading to the activation of ligand-gated ion channels (Petersen et al 2016).
By the acoustic radiation mechanism, the ultrasound wave can be converted into a low-frequency mechanical force with dynamics of the carrier wave envelope (Rudenko et al 1996). This is important, as the effects of FUS neuromodulation have recently been shown to be dependent on the PRF, which determines the envelope of pulsed wave FUS (Manuel et al 2020). Further, modulation of the FUS envelope has been shown to affect the audibility of the FUS signal (Mohammadjavadi et al 2019), otherwise known as the auditory confound. This confound is a phenomenon in which indirect auditory activation is caused via FUS delivery through the skull. This has been reported in human trials (Braun et al 2020) and has called into question the fidelity of motor responses to FUS in rodents (Guo et al 2018, Sato et al 2018). To avoid complications in the clinical translation of FUS neuromodulation, the development of methods to circumvent this artifact has been a focus of the field in recent years.
Potentially, motor activity could arise as an indirect result of auditory stimulation. Sato et al discovered through Ca2+ imaging in mice that FUS neuromodulation targeted at the visual cortex resulted in widespread cortical activation consistent with that evoked by sound (Sato et al 2018). This indirect auditory activation was also seen by Guo et al in guinea pigs (Guo et al 2018). In both studies, it was eliminated by deafening the animals through cochlear fluid removal or auditory nerve transection. Sato et al also reported a reduction of motor responses to FUS after the mice were deafened; however, this may have been a behavioral detriment caused by the chemical deafening method used. Regardless, these studies called into question the true cause of motor responses and highlighted a need to circumvent this auditory confound. Mohammadjavadi et al then demonstrated, using genetic knock-out mice, that completely deaf animals still exhibited motor responses to FUS stimulation (Mohammadjavadi et al 2019). They applied continuous wave FUS stimulation with a rounded onset and offset by modulating the signal with an arbitrary function that rose and fell slowly. This 'envelope rounding' prevented auditory activation, as measured through auditory brainstem responses, while still evoking motor responses. This also showed that the sharp onset and offset of the square FUS pulses are what gave rise to auditory brainstem responses and, therefore, auditory detection. According to Fourier analysis of frequency content, these portions of a square wave are made of high-frequency odd harmonics of the modulation frequency, which would be more detectable based on the hearing range of mice (Heffner and Heffner 2007). Therefore, FUS neuromodulation could be induced independent of auditory activation, though new methods to minimize this confound remain an important topic in the field. Developing methods for employing FUS techniques without detection by the subject would aid in translation of the technique without introducing complications in data analysis and treatment efficacy.
Recently, a finite-element model showed that LIFU causes shear waves to travel along the skull due to the high contrast in impedance between the skull bone and soft tissue, causing cumulative displacements in the cochlea consistent with those necessary for bone conduction hearing (von Bekesy and Weaver 1960, Salahshoor et al 2020). Braun et al also demonstrated in ex vivo human skulls that sound was conducted through the skull corresponding to the PRF and its odd harmonics (Braun et al 2020). Concerns about these confounds provide the rationale for the present study on skull vibrations and methods to mitigate them.
We suspected that skull vibrations arise from applications of ARF to the bone repeated at the PRF. Further, as the skull can cause reflections of the FUS beam, constructive interference of the FUS signal may occur within the bone and amplify skull vibrations. Randomizing the PRF would prevent this potential build-up of radiation force in the skull. Moreover, PRF randomization would minimize the force being delivered at each specific frequency in our PRF range (0.42–4.2 kHz). Thus, if the skull is more sensitive to vibrations at certain frequencies, those frequencies would constitute less of the signal, thereby reducing skull vibrations overall. We hypothesized that skull vibrations would peak at a certain PRF, and that randomized PRF would reduce vibration amplitude. This method would facilitate pulsed FUS neuromodulation centered at any PRF, regardless of the sensitivity of the skull, allowing researchers to utilize PRF-specific bioeffects while mitigating audible skull vibrations. We also hypothesized that skull vibrations would not independently cause motor responses.
Methods
Animals
In a pilot study testing the ability of LIFU to induce motor activity in C57Bl/6 mice (n = 7), the standard deviation of motor response rates to LIFU was ±13.00%. Based on this data, along with an α value of 0.05 (Z = 1.96) and a margin of error of ±5%, the minimum sample size needed to detect a statistically meaningful effect was n = 26. Based on these estimations, thirty-two (32) C57Bl/6 mice between 8 and 16 weeks of age were used for this study. Of these 32, two animals had to be sacrificed prematurely due to anesthetic complications. Wild-type mice were used so that the impact of skull vibrations could be generalized to a population with typical hearing.
Animal preparation
Mice were placed under isoflurane anesthesia and held still in ear bars. Anesthesia was induced at 5% isoflurane, then held at 2% with a nose cone. Isoflurane was delivered with oxygen at a rate of 0.6 l min−1. After mice were anesthetized, a 0.15 ml subcutaneous saline injection was administered to ensure the animal remained hydrated, while a heat lamp was used to maintain the animal's temperature. Ophthalmic ointment (fake tears) was also applied to the eyes of the animal. Breathing rate and internal body temperature (measured via a rectal probe) were monitored throughout the procedure to ensure breathing remained steady and the temperature was maintained around 37 °C.
The fur was removed from the scalp of the animal, and gel with 5% lidocaine was then applied to the skin and allowed 30 min to take full analgesic effect. The lidocaine gel was also applied to the ear bars to reduce discomfort. A small incision was then made on the scalp of the animal to reveal the skull landmarks lambda and bregma, which were then registered in the system. A second incision was then made to create a band of skin under which the MEMS microphone was secured in contact with the skull. The microphone was placed from the side of the skull contralateral to the FUS target to avoid disturbance of FUS transmission. The FUS transducer was coupled to the skull of the animal by a de-gassed water bath and ultrasound gel. For treatments in which skull vibrations were being induced, the microphone was removed and a piezoelectric chip actuator was placed under the scalp. Before the incisions were made, EMG electrodes were inserted into the left gluteus maximus, contralateral to the hemisphere of FUS delivery in the brain. This location was based on observations of motor responses in a pilot study. A grounding electrode was placed subcutaneously in the back.
Study design
The study was broken down into three main objectives. The first was to characterize the dependency of skull vibrations on PRF. To do so, PRF was manipulated during FUS delivery, and skull vibrations were recorded at each PRF step. The second was to determine the ability of randomized PRF to reduce skull vibrations. For this, FUS was delivered with a fixed PRF or a randomly fluctuating PRF and skull vibrations were recorded under each condition. Lastly, the study aimed to assess the ability of FUS to elicit motor activity and compare this to motor activity elicited by skull vibrations induced by a piezoelectric actuator. In these trials, LIFU, piezoelectrically actuated skull vibrations, and control stimulations were delivered to the animal under light anesthesia, such that motor reflexes and self-generated movements were present, and the rate of motor responses to each condition were compared.
These three types of trials were conducted in each animal, for which treatments alternated between one of the first two objectives and the third objective until three treatments of each condition had been delivered (figure 1). The order of stimulation conditions for motor response trials was pseudo-random, with the piezoelectric skull vibration and air-puff conditions all occurring before or after all other conditions, as FUS could not be conducted while the actuator was in place. This protocol minimized the risk of anesthetic complications by reducing time under anesthesia. Results were then compared using a within-subjects design.

Figure 1. Graphical representation of the general timing of treatments during the experimental procedure corresponding to their respective study objectives.
Download figure:
Standard image High-resolution imageRK-50 FUS experimental unit and hardware
LIFU was delivered using a bench-top (figure 2), stereotactic-guided ultrasound platform for small animal experimentation (RK-50, FUS Instruments, Toronto, ON, Canada). The unit uses a 476.5 kHz transducer (diameter = 35 mm, focal gain = 0.7, focal distance = 24.5 mm) for LIFU delivery. The machine includes a stage for the animal and a 3D robotic arm for the ultrasound transducer. The animal was immobilized with ear-fixation bars and isoflurane anesthesia was maintained through a nose cone.
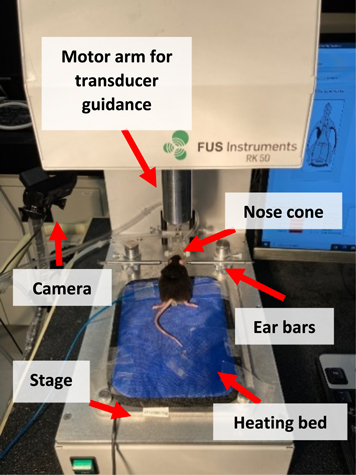
Figure 2 A C57Bl/6 mouse fixed in ear bars and nose cone on RK-50 focused ultrasound delivery platform. Arrows indicate key components of RK-50 and experimental setup.
Download figure:
Standard image High-resolution imageThe RK-50 is controlled using the 'Proteus' software, developed in-lab (Pichardo et al 2018). This program allows for the creation of treatment plans with multiple stimuli of various magnitude and duration. Treatment plans can also include multiple points targeted in series, though the present study used only a single target point. This software drove the RK-50 motor to co-register Lambda and Bregma landmarks on the skull of the animal using a pointer of equal length to the transducer focal distance. The pointer was manually navigated to these landmarks and their locations were logged in the system. The mouse brain atlas used by the software (Allen Reference Atlas—Mouse Brain) was then oriented relative to these points. For each round of stimuli, henceforth referred to as a 'treatment', the motor automatically moved the arm to position the transducer focus at the target. Video data was acquired with each stimulus. A light-emitting diode (LED) was connected to the triggering system to indicate the duration of each stimulus in the video.
LIFU was delivered with a function generator (Siglent SDG 1032X, Shenzhen, China) and a custom 46 dB-gain power amplifier. The transducer was driven with a 476.5 kHz signal, 1.5 kHz PRF and 31.5% duty cycle. An Arduino board was used to trigger the function generator.
Piezoelectric actuator
To create vibrations in the skull of the animal, a small chip actuator (5 mm × 5 mm × 2 mm, PIC252 piezo ceramic; PL055.31, Physik Instrumente, Auburn, MA) was placed under the scalp of the animal. The actuator was powered by a piezo amplifier (E-831.05, Physik Instrumente, Auburn, MA) with a 20 dB-gain. The amplifier was driven with DC power supply (GPS-3303, GW Instek, Taipei, Taiwan) connected to a secondary power supply (E-841.05, Physik Instrumente, Auburn, MA) that fed into the E-831.05 piezo amplifier. The function generator was used to drive the actuator in a sinusoidal signal either at 1.5 kHz or 4.5 kHz, which had an amplitude after amplification of 10 Vpp. Based on communications with the piezo provider, the force output from the actuator was estimated to be 25 N. Vibrations lasted 80 ms. Importantly, FUS was not delivered while the piezoelectric actuator was in place.
Air-puff
To deliver air-puffs to the animal, a small nozzle was attached to the nose cone on the RK-50 and pointed at the left side of the animal's snout. A hose was attached to the nozzle and connected to a bench-top air supply valve. The hose was interrupted by a solenoid valve. The valve was powered with 12 V from the DC power supply and connected to the Arduino board to be triggered during air-puff stimulations. Each air-puff was delivered for 80 ms at 5.0 psi. Air-puffs provided an innocuous somatosensory impulsive stimulus, as well as a loud, broad-spectrum noise.
Microphone
To measure vibrations on the skull, a high-fidelity micro-electromechanical systems (MEMS) microphone (PUI Audio, Fairborn, OH) was placed under the scalp. The wiring of the microphone was insulated with epoxy and hot glue. The microphone was operated at 3.0 V, provided by the DC power supply. The microphone had a sensitivity of −38 dB from 50 to 5000 Hz. The microphone output was recorded by an oscilloscope (Tektronix MDO3014, Beaverton, OR) that served as a datalogger for our experiments.
Electromyography and video
Electromyography (EMG) was used to capture motor responses. EMG signals were collected using 7 mm length, 0.4 mm diameter stainless steel subdermal needles (Rhythmlink, Columbia, SC). EMG was amplified with an AC Amplifier (A-M Systems Differential, Sequim, WA), with a band-pass filter between 100 and 1000 Hz and a gain of 80 dB. EMG data were collected for 1 s before and 4 s after each stimulus. These recordings were also logged by our oscilloscope. Motor responses were also recorded via video camera (Logitech C922 HD, Lausanne, Switzerland) to capture movements not located at our EMG target.
FUS parameters
Pulsed FUS was delivered with 80 ms stimulations. FUS exposure had a duty cycle of 31.5%, with a spatial peak-pulse average intensity (Isppa, water-conditions) of 12.6 W cm−2. With the prescribed duty cycle, this translated to a spatial peak-time average intensity (Ispta) of 3.97 W cm−2. PRF varied depending on treatment condition. The FUS beam concentrated (−6 dB cutout) within a three-dimensional ellipse of ∼2.5 mm diameter and ∼20 mm depth when viewed on the axial plane. This focus was centered on the motor cortex, as determined by the Allen Mouse Brain Atlas. This location was, relative to bregma, 1.78 mm right, 0.80 mm anterior, and 1.33 mm ventral. Based on the large focal resolution relative to the size of the mouse brain, the focal spot also encompassed some adjacent cortical areas and the subcortical regions below the motor cortex (figure 3).
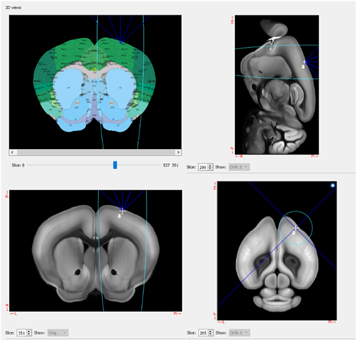
Figure 3. Screenshot of the Proteus software displaying the target area of FUS stimulation, including coordinates on the Allen Mouse Brain Atlas (top left) and cross-sections of the brain in the sagittal (top right), coronal (bottom left), and axial (bottom right) planes. The center of this focus was targeted at the motor cortex (M1).
Download figure:
Standard image High-resolution imageAnesthesia protocol
To acquire motor responses to LIFU neuromodulation, animals must be held at a very light plane of anesthesia. Any concentration of isoflurane above 0.5% is likely to extinguish motor responses (King et al 2013). A protocol was developed to enable reliable acquisition of motor responses while preventing the animal from recovering from anesthesia. Before each stimulation, isoflurane concentration was reduced to 0.2%. The researcher would then wait until a small level of self-generated movement was seen from the animal, which would usually occur 1.5 min after isoflurane reduction. A treatment of 5 stimulations would then be delivered, taking another 1.5 min. Immediately following treatment, isoflurane concentration would be returned to 2%, where it remained for 5 min to ensure the animal remained under anesthesia. Isoflurane and oxygen were continuously delivered at 0.6 l min−1. This flow rate was informed by a pilot study that demonstrated 0.6 l min−1 oxygen was safe and facilitated the highest rates of motor responses. This protocol was repeated until each treatment in which motor activity was being recorded had been carried out.
Experimental execution
For the first objective of characterizing the dependency of skull vibrations on PRF, FUS was delivered with PRF values ranging from 0.42 to 4.2 kHz in ten logarithmic intervals. A logarithmic frequency scale was chosen to match the logarithmic auditory response of the basilar membrane in the mouse (Javel 2003). These ten-stimulus treatments were repeated three times per animal, while the animal was being held under anesthesia at 2% isoflurane between motor response trials. During these stimulations, skull vibrations were recorded and compared across the PRFs to create a response curve depicting skull vibration amplitude over PRF. This was done to determine the frequency at which the mouse skull resonates most. These results also informed the PRF parameters used in later motor response trials. The amplitudes of skull vibrations across each PRF were then adjusted based on the auditory sensitivity of the mouse to that frequency, as taken from Chawla and McCullagh (2022). This resulted in a second response curve indicating the audibility of each PRF.
For the second objective to determine the ability of randomized PRF to reduce skull vibrations, FUS was delivered to the brain using either a fixed or random PRF. In the random PRF condition, the duration of pulses and the latency between them was randomly modulated by a built-in functionality of the function generator used to generate the square signals that triggered the LIFU bursts (Picoscope 5000A, Cambridgeshire, UK), such that the PRF oscillated randomly about 1.5 kHz. This created a new randomly oscillating PRF for each stimulation. Therefore, no two random PRF patterns were identical. However, minimum and maximum PRF values in this condition were 0.42 and 4.2 kHz, respectively, to ensure the duration, duty cycle and intensity of stimulations remained consistent within and between the fixed and random conditions (figure 4). These treatments entailed five stimulations under each condition, in an alternating pattern, for ten total stimulations. Each animal received three of these treatments, also while under anesthesia in between motor response trials. The amplitudes of these vibrations were compared between the two conditions.
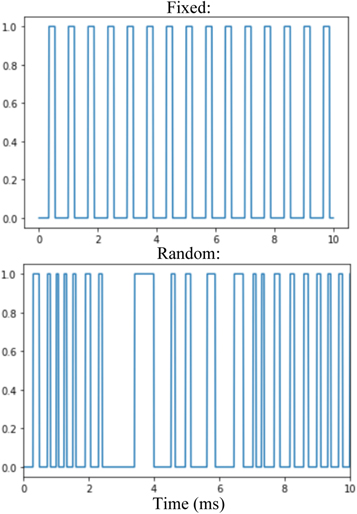
Figure 4. Graphical representation of square wave modulation of FUS delivery in fixed (top) and random (bottom) PRF conditions. On the Y-axis, 1 represents when the FUS is being delivered, while at 0 the FUS is off.
Download figure:
Standard image High-resolution imageIn the first and second objectives, data from only a subset of the total mice were used. This was due either to technical complications with the microphone, such as short-circuiting, or an inability of the microphone to detect signals, possibly owing to a lack of contact with the skull.
For the third objective of assessing the ability of FUS and skull vibrations to elicit motor activity, treatments were delivered with the isoflurane concentration lowered. This was done according to our anesthesia reduction protocol outlined above, wherein five stimulations of the same condition were delivered during a short period of lightened anesthesia (figure 5(a)). These treatments were repeated three times per condition for each animal in a repeating randomized order. There were six conditions: LIFU with PRF fixed at 1.5 kHz; LIFU with PRF randomized about 1.5 kHz; a sham condition in which no FUS was delivered; a positive control condition wherein an air-puff was delivered as a reliable way to produce motor activity at low anesthesia; piezoelectric actuator-induced skull vibrations at 1.5 kHz; and skull vibrations at 4.5 kHz (figure 5(b)).
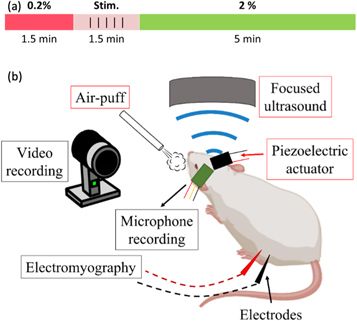
Figure 5. (a) Timeline of isoflurane concentration reduction during each treatment during motor response trials. Isoflurane was reduced to 0.2% (shown in red) to achieve the light level of anesthesia necessary for motor response acquisition. After 1.5 min, 5 stimulations of a given stimulus condition were delivered over another 1.5 min. Isoflurane was then returned to 2% (shown in green) to ensure the animal remained under anesthesia. This protocol was then repeated. (b) Graphic displaying each stimulation modality delivered to each animal (red boxes) and the sources of motor response and skull vibration data (black boxes).
Download figure:
Standard image High-resolution imageThe rates of motor responses to each treatment condition were collected and compared within subjects. For this objective, all 30 mice contributed data. In the final five animals, two additional conditions were added. These treatments delivered LIFU with PRFs that, based on results from our first objective, would be less likely to cause skull vibrations. These were 0.54 and 2.52 kHz. This was done to provide insight on the influence of the PRF parameter and the effect of skull vibrations on FUS neuromodulation.
Post-processing
To determine the success rate of motor responses, the number of motor responses to each treatment was totaled and divided by the number of stimulations delivered. This was done for each condition in each animal. On EMG, a motor response was defined as a positive signal beginning within 200 ms of stimulus onset with amplitude greater than or equal to 4 standard deviations of noise measured 1 s before stimulus onset. This was done in non-rectified EMG data. On video, motor responses were determined manually. Therefore, some subjectivity in the inclusion criteria for a motor response was present. To control for this as best as possible, any distinct movement that occurred within one second of stimulus onset, as indicated by the LED light, was counted as a response. This did not include regularly occurring movements such as those involved with breathing. Responses may have varied in latency if FUS indirectly stimulated motor activity by modulating network activity in the multiple areas encapsulated in the focal spot. Therefore, a one-second temporal cut-off ensured all motor responses were captured, despite the inability to manually distinguish smaller timescales on video.
The amplitude of skull vibrations was determined by manually processing the microphone data to isolate signals recorded during FUS exposure. The root mean square (rms) value of the recorded signal was then taken. The rms values were then normalized as a percentage of the maximum value recorded within each treatment. This temporal proximity of the vibrations being compared removed the large differences in signal strength that occasionally arose due to changes in microphone position caused by movement of the animal between each treatment, as skull vibration recordings occurred between motor response trials.
The relative rms values were adjusted for microphone sensitivity, though the microphone was equally sensitive across the frequencies used. However, the values were also adjusted to the hearing range of the animal. This was done using auditory brainstem response measurements from Chawla and McCullagh (2022). Hearing threshold is measured as a sound pressure level (SPL) in decibels (dB). At 80 dB SPL, the sound pressure is 104x higher than that of the baseline noise. If an animal has no auditory brainstem response to a frequency played higher than 80 dB SPL, the animal is considered deaf to that frequency. Therefore, to adjust for the animals' hearing range, the relative rms value at each frequency was multiplied by a factor of  where SPL is the hearing threshold in dB at that frequency taken from Chawla and McCullagh (2022). This gave a relative audibility value for each PRF. Below 1 kHz, assumptions had to be made, as mice are considered deaf below this frequency. For the 0.9 kHz PRF, the 1 kHz threshold value was used. For lower frequencies, the hearing threshold was assumed to be 80 dB SPL.
Statistics
For the first objective, skull vibrations were expected to vary depending on PRF value. To assess the effect of PRF, skull vibration amplitudes were plotted over PRF and compared statistically using a Friedman test. A non-parametric test was used because our data failed the Wilkinson-Shapiro test for normality at some PRF levels, so normal distribution could not be assumed. Dunn's multiple comparisons test was used to compare rms amplitudes between PRF values.
For the second objective, we expected random PRF to reduce the amplitude of skull vibrations. Thus, skull vibrations recorded during fixed PRF and random PRF treatments were compared within subjects using a Wilcoxon matched-pairs signed rank test. Again, normal distribution of our data was not assumed, as data in the random PRF condition failed the Wilkinson–Shapiro normality test.
For the last objective, motor responses were expected to vary in success rate based on stimulation condition. Specifically, FUS and air-puff were expected to elicit motor activity at higher rates than sham and skull vibrations. While the rate of motor activity may vary between animals, the differences were expected to be clear within each animal. Thus, recorded motor response rates were compared within subjects across each condition by a Friedman test. While data in the fixed and random FUS conditions were normally distributed according to a Wilkinson–Shapiro test, data in other conditions were not. Therefore, a non-parametric test was used to ensure meaningful conclusions. Notably, this test cannot be conducted with missing values. Some animals did not receive certain stimulus conditions due to technical complications, so these missing values were filled with the median value of the respective condition so as not to affect the test results.
Five animals also received two extra FUS conditions. Responses to these conditions were compared only within the animals that received these treatments with a Kruskal–Wallis test and Dunn's multiple comparisons.
Results
PRF range
Fourier transformation of recorded microphone signals revealed peaks in frequency corresponding to the PRF in use (figure 6). This held true for microphone signals recorded during all LIFU treatments.

Figure 6. Fourier transform of representative skull vibrations recorded during FUS delivery with a fixed PRF of 1.5 kHz (top) and a random PRF fluctuating about 1.5 kHz (bottom). During fixed PRF FUS delivery, frequency peaks were seen at the PRF, as well as its harmonics. During random PRF stimulation, frequency distribution was spread out across the randomly fluctuating frequency values, so no peaks were seen.
Download figure:
Standard image High-resolution imageThe rms amplitude of vibrations was normalized to the maximum signal per-treatment. These trials were successfully conducted in 19 mice. The normalized skull vibration amplitude over PRF (figure 7) showed a peak at 1.51 kHz, with a consistent reduction in amplitude as the PRF became increasingly greater or lesser. This maximum amplitude value at 1.51 kHz was 88.1 ± 11.5% (mean ± SD), while the minimum amplitude recorded was 54.3 ± 23.8%, occurring at 4.20 kHz. At frequencies less than 1.51 kHz, the minimum amplitude was 75.5 ± 15.1% which occurred at 0.54 kHz. However, this was nearly equal to the amplitudes recorded at 0.42 kHz (75.9 ± 15.9%) and 0.7 kHz (75.9 ± 16.6%). A Friedman test revealed a main effect of PRF (p < 0.0001, n = 19), with Dunn's multiple comparisons tests showing a significantly lower relative rms value at 3.26 kHz (p < 0.0001), 4.20 kHz (p < 0.0001), and 0.54 kHz (p = 0.0149) compared to 1.51 kHz.

Figure 7. Mean skull vibration amplitude, normalized within treatments as a percent value relative to peak recorded rms amplitude, plotted on the Y axis. PRF plotted on the X axis on a logarithmic scale. 476.5 kHz FUS was delivered at each PRF with 31.5% duty cycle to mice under 2% isoflurane anesthesia. The shaded area represents mean ± 1 standard deviation. Values adjusted for microphone sensitivity. n = 19. *p < 0.05. ****p < 0.0001.
Download figure:
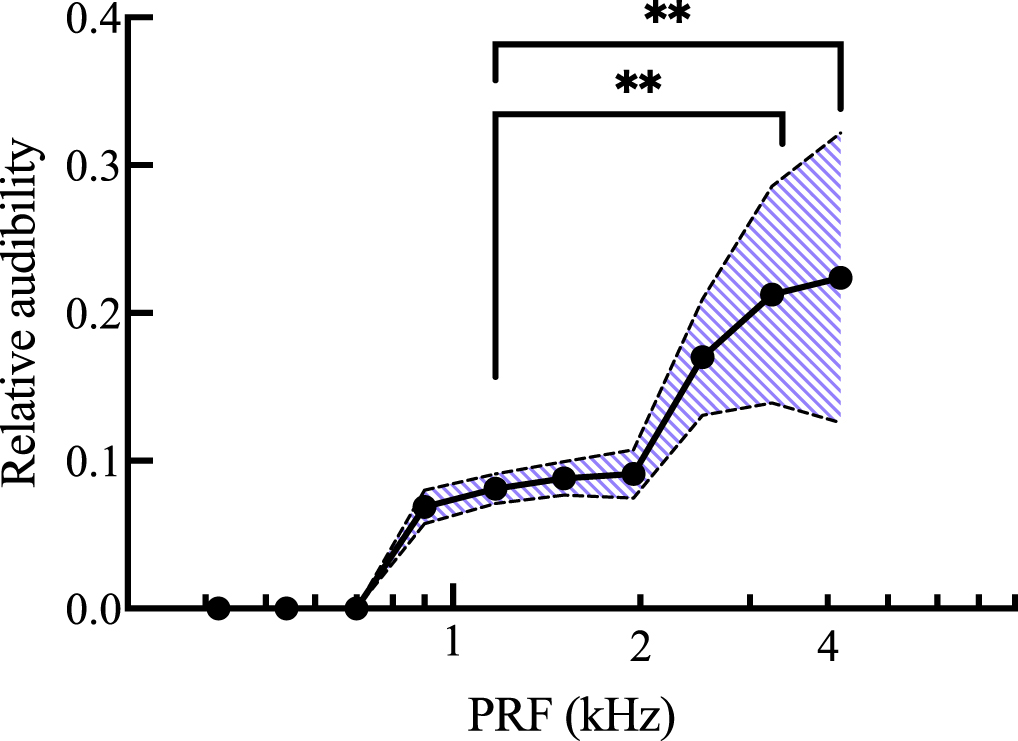
Standard image High-resolution imageThe relative rms values in figure 7 were adjusted to account for the hearing range of C57Bl/6 mice, as described above. The relative audibility values displayed a peak sensitivity at 4.20 kHz with 0.224 ± 0.098 (figure 8). Again, there was a main effect of PRF (p < 0.0001). Audibility was significantly higher at 4.20 kHz (p = 0.0026) and 3.26 kHz (p = 0.0064) compared to 1.17 kHz.
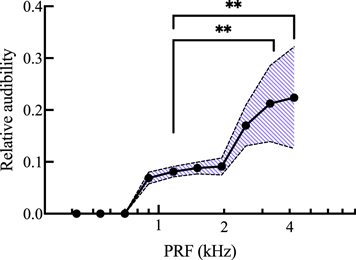
Figure 8. Mean relative audibility of measured skull vibrations plotted on the Y axis over PRF plotted on the X axis on a logarithmic scale. Audibility values were obtained by adjusting relative rms amplitude values from figure 7 with the hearing range of the animal, taken from Chawla and McCullagh (2022). 476.5 kHz FUS was delivered at each PRF with 31.5% duty cycle to mice under 2% isoflurane anesthesia. The shaded area represents mean ± 1 standard deviation. Values adjusted for microphone sensitivity. n = 19. **p < 0.01.
Download figure:
Standard image High-resolution imageFixed and random PRF
Over trials using 15 animals, LIFU with PRF fixed at 1.5 kHz resulted in skull vibrations with a relative amplitude of 88.8 ± 5.87%, while the relative amplitude of skull vibrations in the randomized PRF condition was slightly reduced to 84.6 ± 6.76% (figure 9). This was a decrease in relative rms value of 4.2%. According to a two-tailed Wilcoxon matched-pairs signed rank test, skull vibrations in the random PRF condition were significantly lower than in the fixed PRF condition (p = 0.0181, n = 15).
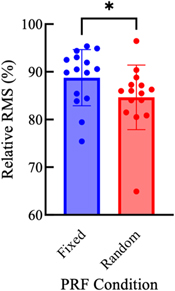
Figure 9. Mean skull vibration amplitude, normalized within treatments as a percent value relative to peak recorded rms amplitude, during FUS stimulation with fixed (1.5 kHz) or random (randomly fluctuating about 1.5 kHz) PRF. 476.5 kHz FUS was delivered under each PRF condition with 31.5% duty cycle to mice under 2% isoflurane anesthesia. Error bars represent ± 1 standard deviation. Values adjusted for microphone sensitivity. One point on each bar represents the mean value for one animal. n = 15. *p < 0.05.
Download figure:
Standard image High-resolution imageMotor responses
EMG recordings from a representative FUS treatment are displayed in figure 10. Characteristics of motor responses to FUS are listed in table 1, including the measured latency, duration, and peak amplitude.
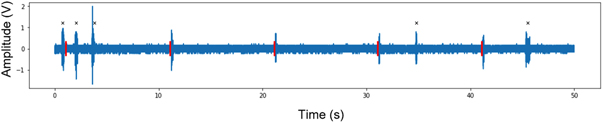
Figure 10. Representative EMG recordings taken during a five-stimulation treatment of 476.5 kHz FUS with a fixed PRF of 1.5 kHz and duty cycle of 31.5%. Amplitude was measured after 10 000x amplification. FUS delivery marked in red. Self-generated movements which were not counted as motor responses are marked with a black x. This treatment gave an 80% success rate, with motor responses to all but the first FUS stimuli.
Download figure:
Standard image High-resolution imageTable 1. Descriptive statistics of motor responses to FUS as measured by EMG. Peak positive amplitude was measured in non-rectified EMG data after 10 000x amplification. Values are reported as the mean ± standard deviation (SD) of the peak positive amplitude of all motor responses recorded across our sample of 30 mice.
| Latency (ms) | Duration (ms) | Peak positive amplitude (V) | |
|---|---|---|---|
| Mean ± SD | 95.2 ± 39.5 | 276.6 ± 191.7 | 1.40 ± 0.93 |
| Range | (13.7, 192.7) | (20.1, 1270) | (0.32, 5.77) |
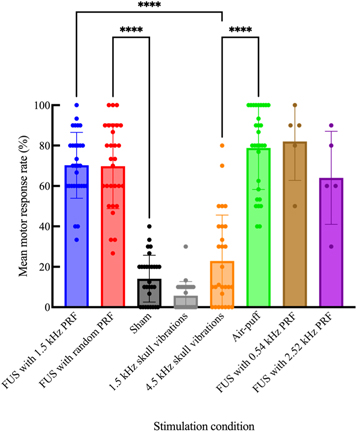
Mean motor response rates were compared across conditions with a Friedman test, which revealed a main effect of treatment condition (p < 0.0001, n = 30; figure 11). FUS neuromodulation with a randomized PRF produced motor responses at rates (69.8 ± 21.0%) comparable to LIFU with a fixed PRF at 1.5 kHz (70.2 ± 16.3%), as well as air-puff stimuli (78.8 ± 20.5%). Post hoc Dunn's multiple comparisons tests showed no significant difference between any of these three conditions. Piezoelectric actuator-induced skull vibrations evoked motor responses with less consistency; 4.5 kHz vibrations caused motor responses (22.9 ± 22.7%) slightly more often than sham stimulations (14.1 ± 11.6%), though this difference was not significant. 1.5 kHz vibrations evoked motor responses less often (5.73 ± 6.96%) than 4.5 kHz vibrations and sham, though these differences were also not statistically significant.
Figure 11. Mean success rate of motor responses to various stimuli under 0.2% isoflurane anesthesia. In FUS conditions, 476.5 kHz FUS was delivered with 31.5% duty cycle. In the sham condition, no power was supplied to the FUS transducer. Error bars represent ± 1 standard deviation. One point on each bar represents the mean motor response rate of one animal. For 0.54 kHz PRF and 2.52 kHz PRF FUS conditions, n = 5. For all other conditions, n = 30. ****p < 0.0001.
Download figure:
Standard image High-resolution image
In the five animals to which LIFU was also delivered with 0.54 kHz and 2.52 kHz PRF values, these conditions produced motor responses at rates of 82.0 ± 19.2% and 64.0 ± 23.0%, respectively. There was no significant difference between these two conditions. In these trials, FUS with a 0.54 kHz PRF yielded significantly higher motor responses than sham (p = 0.0287) and 1.5 kHz skull vibrations (p = 0.0050).
Discussion
Results from this study showed that skull vibrations were greatest during FUS delivery with a 1.51 kHz PRF. Results also demonstrated a small but significant reduction in skull vibration amplitude when PRF was randomized. Lastly, motor response rates to FUS measured here were significantly higher than responses to piezoelectric actuator-induced skull vibrations, with the latter showing no significant difference from sham stimulation.
Microphone measurements
The MEMS microphone was able to detect vibrations on the skull during LIFU treatment that corresponded to the PRF and its harmonics. The small surface of the mouse skull restricted microphone placement such that we could not verify that vibrations were not being propagated through the coupling medium. Nonetheless, our findings are consistent with findings in ex vivo human skulls. In human skulls, FUS can cause shear wave conduction to the ear canal at the PRF and its odd harmonics (Braun et al 2020) despite bone-conducted vibrations being measured far from the FUS locus (Manuel et al 2020). This suggests that the vibrations we measured here were also bone-conducted.
The skull of the mouse is much thinner than the human but shares similar acoustic properties, with longitudinal and transversal speeds of sound near 2400 m s−1 and 1500 m s−1, respectively (Estrada et al 2016). While skull thickness was not measured in this study, we assumed that variation in thickness would not affect FUS transmission. This was based on the average murine skull thickness being an order of magnitude thinner than the wavelength of 476.5 kHz ultrasound in water (Soleimanzad et al 2017), thus causing minimal losses from reflection. We can also assume that the recorded vibrations would reach the inner ear of the animal because vibrations were shown to reach the cochlea in human skulls (Braun et al 2020, Salahshoor et al 2020), which is much farther for shear waves to traverse than on the mouse skull. The present study did not record direct measurements of hearing, such as auditory brainstem responses, so we cannot conclude whether these vibrations cause auditory activation. Therefore, discussion focuses mainly on the theoretical audibility of the recorded vibrations based on the hearing range of mice. Future work may validate our results with auditory brainstem recording, and ex vivo measurements of skull thickness and vibration conduction.
The position of the microphone was slightly variable throughout each experiment. This was because microphone measurements, although taken when the animal was held at 2% isoflurane anesthesia, occurred in between motor response trials, wherein movements of the animal may have changed the position of the microphone. Small changes in microphone position could have great effects on measured signal amplitude. To account for this variation in recorded signals, the present study focused on the relative amplitude of measured signals within each treatment, during which microphone position was assumed to remain constant. Thus, vibration amplitudes are reported as proportions of the peak amplitude reached in a treatment, and the relative audibility of these signals is discussed.
Effects of PRF on skull vibrations
The peak in relative rms value seen at 1.51 kHz implies that the strongest skull vibrations are likely to be produced during LIFU delivery with this PRF. Avoiding this value may help in mitigating skull vibrations. The relative amplitude value at 1.51 kHz was significantly higher than one of the lower frequencies (0.54 kHz), and the general trend of relative amplitudes from 0.42 to 1.51 kHz was in line with values of mechanical impedance in the literature. Håkansson et al reported that the magnitude of mechanical impedance in the human skull in vivo consistently declines from 200 Hz to 1.5 kHz (Håkansson et al 1986). The impedance values then increase slightly until about 2 kHz. This means that as the frequency approaches 1.5 kHz, conduction of vibrations in the skull would increase, then decrease again until 2 kHz, similar to our results. Furthermore, Håkansson et al also reported resonance frequencies of the human skull around 972 and 1230 Hz (Håkansson et al 1994). Given that these resonance frequencies are within a similar bandwidth as our 1.51 kHz peak, we may submit that 1.51 kHz is the resonance frequency of the mouse skull bone. However, a more precise study of skull vibrations over a wider and denser range of frequencies would be needed to conclude this. The resonance frequencies that Håkansson et al reported had damping coefficients between 2.6% and 8.9% (Håkansson et al 1994). These were deemed relatively high and, therefore, resonance would not significantly affect the sound being conducted by the bone. This aligns with the fact that the peak in amplitude seen presently at 1.51 kHz was only significantly higher than one frequency below it.
The main discrepancy between the present results and the mechanical impedance values from the literature was the significant drop in relative vibration amplitude above 2.52 kHz. Mechanical impedance in the human skull was shown to decrease again beyond 2 kHz, yet the relative amplitude of skull vibrations presented here drops sharply at 3.26 and 4.2 kHz. This could be due to some difference in structure between the human and murine skulls, though the more likely explanation is a technical limitation of our microphone. When adjusting the PRF value, duty cycle was held constant to maintain Ispta. This meant the length of the FUS pulses was shortened as PRF increased. At 3.26 and 4.2 kHz, the duration of FUS pulses may have been too short to cause cumulative displacements large enough to be detected by the microphone, even though the microphone had equal sensitivity across the entire range of PRF values. With this possible limitation in mind, the relative amplitudes at frequencies ≥2.5 kHz may be underestimated. Regardless, 4.2 kHz would still be the most detectable frequency in this range. In fact, after adjusting for the hearing range reported by Chawla and McCullagh (2022), the audibility of skull vibrations measured here would significantly rise beyond 1.95 kHz, with vibrations recorded at 4.2 kHz having a relative audibility approximately 2.5 times greater than vibrations recorded at 1.51 kHz. This is because mice are most sensitive to higher frequencies, between 12 and 20 kHz (Heffner and Heffner 2007). The SPL threshold required for mice to hear a sound drops steadily from nearly 70 dB at 2 kHz, to about 50 dB at 4 kHz, reaching about 30 dB at 8 kHz (Chawla and McCullagh 2022). Thus, to avoid auditory activation, PRF values should be kept lower rather than higher. This same principle underlies envelope rounding, as rounding the square edges of pulses eliminates the high frequency harmonics that make up the sharp edges of the square wave (Mohammadjavadi et al 2019).
While the present study did not measure auditory brainstem responses, vibration amplitude at 0.54 kHz was 12.6% lower relative to 1.51 kHz. A computational study by Salahshoor et al found that ramping the envelope reduced displacements in the cochlea from 1 to 0.2 μm, a much greater, five-fold decrease (Salahshoor et al 2020). However, mice are not sensitive to 0.54 kHz (Chawla and McCullagh 2022). In theory, a PRF of 0.54 kHz would not cause auditory activation if not for the presence of its harmonics.
The PRF modulates the delivery of FUS in square pulses, so vibrations caused by a 0.5 kHz PRF would also contain 1.5 kHz vibrations at 1/3 the amplitude of the modulation frequency. Therefore, reducing the PRF would reduce skull vibrations in the audible range, but not eliminate them. Regardless, a PRF around 0.5 kHz would likely be the optimal value for mitigating audible skull vibrations while maintaining neuromodulation efficacy, as certain targets have been shown to be unresponsive to FUS neuromodulation at PRFs lower than 0.5 kHz (Manuel et al 2020). Perhaps a method combining envelope rounding with pulsed wave to allow PRF tuning may be the most effective way to prevent auditory activation in future work.
Random PRF mitigation of skull vibrations
Randomizing PRF during LIFU neuromodulation was shown to significantly reduce the amplitude of skull vibrations being produced. However, the relative rms values of these vibrations were only reduced 4.2%, a very small effect size. In fact, in changing the PRF from 1.51 to 1.95 kHz, the relative rms value of skull vibrations was reduced 6.97%. If reflections of the LIFU beam within the skull were forming standing waves and causing constructive interference of skull vibrations, random PRF would disrupt these waves and a drastic drop in vibration amplitude would be seen. As this was not shown, standing wave formation is likely not the main causal contributor to skull vibrations, although we cannot definitively rule out the possibility that they play a role.
More likely, less of the LIFU signal, and therefore less ARF, was delivered at 1.5 kHz. The skull was shown to be prone to vibrations at this frequency, so a small reduction of relative amplitude was seen in the random PRF group. Ultimately, tuning the PRF to avoid audible vibrations may be a better strategy for auditory confound mitigation. Importantly, further studies with randomized PRF are required to better understand how neuromodulatory response could vary with different sets of rarefaction pressures, pulse durations, and duty cycles to the one tested in the present study.
PRF randomization did, however, eliminate the frequency peak normally seen at the PRF. Thus, random PRF may mask the FUS stimulus as a broad-spectrum white-noise sound due to the acoustic energy being spread out in the frequency domain. This could be less differentiable from background noise and, therefore, less salient to the auditory system. Random PRF may then reduce auditory activation to a greater degree than skull vibration amplitude, though this would require further studies with auditory brainstem response measures to elucidate.
Motor responses to LIFU and vibrations
Motor responses are a proxy measure of FUS neuromodulation. This study was limited spatially in its ability to directly measure neuronal activity due to the setup of the LIFU device. While electrophysiological recording is difficult in FUS studies due to mechanical displacements of electrodes causing electrical artifacts (Manuel et al 2020, Kim et al 2021), the present study could be complimented by future work using optical readouts of neuronal activity such as Ca2+ imaging.
LIFU was targeted at the right motor cortex, but the spatial resolution currently offered by FUS technology is not high enough to decouple the motor cortex from surrounding areas in small organisms such as the mouse. In larger animals, including humans, this spatial specificity is achievable. Still, improvement of spatial resolution remains an ongoing field of study. While the motor cortex could not be isolated here, LIFU was confined to the right side of the brain, contralateral to our EMG target.
Only responses in the left gluteus maximus were characterized by EMG, though nearly all responses were captured on video. As EMG served mainly as an adjunct to video, post-processing of EMG data was minimal. Here, we present non-rectified, peak positive amplitude as a measure of motor response strength. While rectification of EMG data was unlikely to drastically change the descriptive statistics presented here, studies aiming to quantify the characteristics of motor responses to FUS should account for the nuances of EMG data.
Motor responses varied in location between animals and treatment conditions. Though most motor responses were clearly identifiable, our timing-dependent inclusion criteria controlled for coincidence of self-generated motor activity and stimulus delivery. This did, however, allow for high motor response rates to sham stimulation, despite the absence of a detectable stimulus. Thus, response rates to sham were likely an overestimation, but remain a useful representation of the proportion of motor responses that may have occurred due to chance. Motor response data acquisition and analysis relied heavily on human interpretation. Thus, future work using blinded experimental execution and tabulation of motor responses would serve to validate the results presented here by eliminating any potential for researcher bias.
A low isoflurane concentration is required for motor activity to occur (King et al 2013). While our anesthesia protocol standardized the isoflurane being delivered to each animal, we could not control for natural variation in their responses to the anesthetic. Absorption of and recovery from isoflurane can also vary depending on breathing rate and depth. We attempted to account for these factors by comparing motor responses within subjects.
Randomizing PRF did not affect motor response rates to LIFU stimulation. As some neuromodulatory effects have been shown to be extinguished at lower PRFs (Manuel et al 2020), the ability of randomized PRF to preserve PRF-specific effects should also be studied as the PRF-specificity of FUS neuromodulation becomes further understood.
Air-puffs at 5.0 psi for 80 ms elicited highly consistent motor responses at 0.2% isoflurane. These results indicate that non-noxious stimuli could reliably elicit motor responses under these conditions.
In contrast, neither actuator-induced skull vibration condition produced motor response rates significantly different than sham. When skull vibrations were induced with the actuator at 1.5 kHz, the same frequency as the LIFU PRF, motor responses were near zero, with no significant difference compared to sham. Trials using FUS (fixed PRF, random PRF, and sham) were separated from the others (piezoelectric vibrations and air-puff). Most animals received air-puff and actuator-induced vibrations last (23/30), possibly resulting in less self-generated motor activity in these treatments due to gradual acclimation to low anesthesia over the course of the procedure. Realistically, responses to both sham and 1.5 kHz actuator-induced skull vibration were likely attributable to self-generated movement, though this baseline motor activity may have been lower in the latter compared to the former. Any effects on motor responses caused by grouping of treatments were attempted to be controlled for by delivering treatments in a pseudorandom order within their groupings.
The 4.5 kHz actuator-induced skull vibration condition appeared to produce higher motor response rates than 1.5 kHz skull vibration, attributable to the higher sensitivity of mice to this frequency. Response rates to 4.5 kHz actuator vibration also appeared greater than those to sham. However, neither of these differences were statistically significant. Response rates to 4.5 kHz vibrations may have failed to present as significantly higher than sham due to the same reduction in baseline self-generated motor activity discussed above. Regardless, LIFU stimulation produced significantly higher motor response rates than 4.5 kHz skull vibrations. Therefore, skull vibrations likely do not contribute to motor responses to FUS neuromodulation.
The ARF applied to the skull by FUS can be estimated as:

Where c represents the speed of sound in the skull, and  is attenuation due to absorption. Pinton et al found that, in human skulls, absorption makes up only a small portion of the attenuation caused by the skull (Pinton et al
2011). Using our Ispta of 3.97 W cm−2, an absorption of 14.8 Np m−1 (Pinton et al
2011), and a speed of sound of 2828 m s−1 (Kneipp et al
2016), this gives an ARF of 415.9 N. These values are estimates, as these attenuation parameters are taken from measurements of human skulls. As the mouse skull is much thinner, the absorption of acoustic energy may be much less, resulting in a lower ARF value, though measurements of acoustic attenuation in the mouse skull have yet to be made.
is attenuation due to absorption. Pinton et al found that, in human skulls, absorption makes up only a small portion of the attenuation caused by the skull (Pinton et al
2011). Using our Ispta of 3.97 W cm−2, an absorption of 14.8 Np m−1 (Pinton et al
2011), and a speed of sound of 2828 m s−1 (Kneipp et al
2016), this gives an ARF of 415.9 N. These values are estimates, as these attenuation parameters are taken from measurements of human skulls. As the mouse skull is much thinner, the absorption of acoustic energy may be much less, resulting in a lower ARF value, though measurements of acoustic attenuation in the mouse skull have yet to be made.
The force applied by the piezoelectric actuator was estimated using the blocking force of the piezo (500 N) at 100 Vpp, and adjusting for our 10 Vpp applied voltage, to give an estimated force output of 25 N. These numbers are also estimates, as the capacitance of the piezoelectric actuator may vary at higher frequencies. Thus, a major limitation of this study was the inability to directly measure and compare skull shear wave amplitude induced by FUS and piezoelectric actuation. This was due to spatial limitations preventing the use of a piezoelectric detector, technical limitations such as inconsistency in microphone recordings between treatments, and the need for alternation between FUS and vibration treatments preventing cement fixation of the actuator to the skull. However, when the microphone was placed on top of the piezoelectric actuator, vibrations were in fact seen at the desired frequency. Furthermore, the rms amplitude of these vibrations were within one order of magnitude of skull vibrations recorded during 1.5 kHz PRF LIFU treatments in the same animal. Thus, piezoelectric vibrations were likely comparable to those induced by FUS. Nevertheless, future studies using computational models or larger skulls would help to verify the similarity in amplitude between these two modalities.
Lastly, we tested the efficacy of LIFU to produce motor responses using different PRF values over a small sample of five animals. Both 0.54 and 2.52 kHz PRF values produced motor responses to FUS neuromodulation at comparable rates to our other LIFU conditions. This aligns with literature that examined motor responses when altering PRF (Fomenko et al 2020). These results show that LIFU with 0.54 kHz PRF is at least as capable to produce motor activity as LIFU with 2.52 kHz PRF, despite being shown to be less detectable by the murine auditory system. This supports the notion that adjusting PRF may be the optimal strategy for mitigating the auditory confound. In the future, a larger trial could be conducted to measure motor responses to LIFU using all the PRF values at which skull vibrations were recorded, including random PRF stimulations matched to each frequency. This would provide a more complete characterization of the relationship between PRF, motor responses, and skull vibrations. Pulsed envelope rounding may also be considered an alternate or additional measure in the future. While we have presented further supporting evidence that skull vibrations are not the main contributor to FUS neuromodulation, reducing auditory activation remains an important consideration to avoid confounding experimental factors and refine the translation of this technique.
Conclusion
As indirect activation of auditory pathways during FUS neuromodulation has been linked to skull vibrations propagating at the PRF, the current study sought methods to mitigate these vibrations in mice. This study also presented evidence regarding the ability of piezoelectric actuator-induced skull vibrations to produce motor responses. We conclude that PRF randomization may aid in skull vibration mitigation where necessary, though tuning the PRF to a lower value may be more viable. Based on our analysis, we also found that skull vibrations likely do not contribute significantly to motor activity seen in response to FUS neuromodulation.
Acknowledgments
This work was supported in part by the Discovery Grants NSERC #RGPIN/043287-2019 (SP) and NSERC #RGPIN/04126-2017 (ZHTK) from the Natural Sciences and Engineering Research Council of Canada, and the Canada Foundation for Innovation Fund 2017-36073. We have no conflicts of interest to report.
Data availability statement
The data cannot be made publicly available upon publication because no suitable repository exists for hosting data in this field of study. The data that support the findings of this study are available upon reasonable request from the authors.
Ethical statement
The experiments reported in this work were covered by Animal Care Committee Certification number AC20-0130, issued by the University of Calgary Health Sciences Animal Care Committee, in accordance with Canadian national standards, for the project 'Investigating effective methodology for focused ultrasound neuromodulation in small rodents' on 1 September 2021.