
Abstract
Objective. Radiotherapy is a well-known alternative in the treatment of keloid scars to reduce the recurrence of scars. The purpose of this study was to investigate the feasibility and accuracy of dose delivered from a high-dose-rate (HDR) afterloaders in keloid scar brachytherapy using Monte Carlo (MC) simulations and measurements. Approach. Treatment doses and central axis dose profiles were measured using radiophotoluminescence dosimeters and radiochromic films, respectively, with two HDR afterloaders, both using an Ir-192 source, in a phantom made of solid water and polycarbonate sheets. The nominal treatment dose calculated by the AAPM Task Group No. 43 (TG-43) dose model was set to 8.5 Gy at a distance of 0.5 cm laterally from the middle of the source line located in a plastic applicator simulating a 15 cm long surgically removed scar treatment with 30 equally spaced (0.5 cm) source positions. The dose profiles were measured at three different distances from the applicator and the absolute doses at four points at different distances. MC simulations were performed using the egs_brachy, which is based on EGSnrc code system. Main results. The measured and simulated dose profiles match well, especially at 10.0 mm (difference <1%) and 15.0 mm depths (difference <4%), and with a small dose difference at 5.0 mm depth (difference <4%). Point dose measurements agreed well in the dose maximum area (difference <7%) with the simulated dose profiles, although the largest difference near the edge of the profile was <30%. The dose differences between the TG-43 dose model and the MC simulation were small (differences <4%). Significance. Simulated and measured dose levels at a depth of 0.5 cm showed that the nominal treatment dose can be achieved with the utilized setup. The measurement results of the absolute dose agree well with the corresponding simulation results.
Export citation and abstract BibTeX RIS

Original content from this work may be used under the terms of the Creative Commons Attribution 4.0 licence. Any further distribution of this work must maintain attribution to the author(s) and the title of the work, journal citation and DOI.
1. Introduction
Radiotherapy (RT) is a widely used option in the treatment of keloid scars by reducing the recurrence of scars (Goutos and Ogawa 2017). A keloid scar is a pathological process in which the growth of wound healing scars is abnormal. For the patient, keloid scars can be painful, pruritic and cause a psychological burden (Grabowski et al 2020).
RT is usually given after the keloid scar has been surgically removed. Treatment options include external RT, low-dose-rate brachytherapy, and high-dose-rate (HDR) brachytherapy, the latter of which has the lowest recurrence rate (Goutos and Ogawa 2017). HDR brachytherapy can be used internally or externally to treat keloids. In external use, the source moves in a catheter overlaying on a patient's skin or in a surface applicator, which are more common in skin brachytherapy (Wagner et al 2009, Skowronek 2015). In the internal treatment, the treatment catheter is surgically inserted into the scar after keloid removal and removed after the last treatment (Goutos and Ogawa 2017). This work validates internal treatments, which is currently standard clinical practice.
Traditionally, in HDR brachytherapy, treatment planning and dose calculation are performed according to the dose model of American Association of Physicists in Medicine (AAPM) Task Group No. 43 (TG-43) (Rivard et al 2004, Safigholi et al 2020). Although the planning with TG-43 dose model has been widely studied, its disadvantage is the two-dimensional calculation, dose-in-water approach and the lack of patient-specific modeling. Model-based dose calculation has its own guidelines, and RT can be planned more precisely with it (Beaulieu et al 2012, Duque et al 2020, Moreno-Barbosa et al 2020).
Monte Carlo (MC) simulations have been studied for a long time and are considered the gold standard for dose calculation accuracy. Brachytherapy sources have been simulated with MC from the 1960s and for dose comparison from the 1990s (Seco and Verhaegen 2013). egs_brachy, which uses the egs++ library from the EGSnrc software toolkit, is a MC simulation application specifically designed for use in brachytherapy calculations (Chamberland et al 2016). Recently, its accuracy and usefulness have been studied by several research groups (Buchapudi et al 2019a, 2019b, Van Elburg et al 2020).
The aim of this study was to investigate the feasibility and accuracy of the absorbed dose delivered by the Ir-192 source of an HDR afterloader in keloid scar brachytherapy using MC simulations and measurements. This study also aimed to investigate the accuracy of the TG-43 dose model using source types from different afterloaders and in the HDR treatment of keloid scars, which, to our knowledge, has not yet been studied before.
2. Material and methods
2.1. High-dose-rate afterloader units
In this study, measurements were performed with two HDR brachytherapy remote afterloaders: microSelectron V2 (Elekta AB, Stockholm, Sweden) and Bravos (Varian Medical Systems Inc. - a Siemens Healthineers Company, Palo Alto, CA, USA). Both treatment units use an Ir-192 source: microSelectron-v2 and GammaMed Plus (model 232), respectively (Perez-Calatayud et al 2012).
2.2. Radiophotoluminescence dosimetry and radiochromic film dosimetry
Radiophotoluminescence dosimeters (RPLD) were used for point dose measurements and have been extensively studied in dosimetry (Araki et al 2004, Hsu et al 2008, 2012). The RPLD system (GD-302M, Dose Ace, AGC Techno Glass Co., Shizuoka, Japan) has rod-shaped glass dosimeters (diameter of 1.5 mm and length of 12.0 mm) with an effective atomic number of 12.04 and a density of 2.61 g cm−3. The dosimeter can be used in a wide dose range from 10 μGy to 100 Gy, which makes it suitable for various applications. An RPLD reader (Dose Ace FGD-1000) was used to record the absorbed dose (Saikkonen et al 2021). The results of the RPLDs were corrected against an ionization chamber (PTW30013, PTW-Freiburg GmbH, Freiburg, Germany) in water together with an GammaMed Plus Ir-192 source. In the calibration measurements, the irradiation was repeated with the ionization chamber and the RPLD as accurately as possible (multiple dwell position treatment and distance from edge of applicator to middle of IC and RPLD). Several RPLDs were used. The correction factor was calculated from the ratio of the IC results and the average of the measured RPLD values of absorbed dose.
Radiochromic film (Gafchromic EBT3, Ashland, Wayne, NJ, USA) dosimetry was used for central axis (CAX) dose profile measurements. Film reading and dose calibration was performed in a secondary standard dosimetry laboratory. Film dose calibration was performed with solid water and a Co-60 gamma and 6 MV photon beams. Bassi et al have previously reported the use of a EBT3 film calibrated with a 6 MV linac beam to measure brachytherapy treatment source doses (Bassi et al 2020).
2.3. Measurements
Phantom measurements used a plan with 30 dwell positions with a stepsize of 0.5 cm, simulating a 15 cm long surgically removed scar (surgical cavity) treatment. Plan dose calculation was performed in the Eclipse BrachyVision version 16.1 (Varian Medical Systems Inc. - a Siemens Healthineers Company) treatment planning system (TPS) using the TG-43 dose and source model algorithm for the microSelectron and Bravos sources. Dose normalization was set to 8.5 Gy at a distance of 0.5 cm from the sources in the middle of the active sources. Dose fractionation was chosen to be the same as standard clinical RT practice for keloid scars used in Department of Oncology and Radiotherapy of Tampere University Hospital.
Phantom measurements were performed with RPLDs and films on 260 × 260 × 6 mm3 polycarbonate (PC) sheets (Makrolon®) with a density of 1.216 g cm−3.
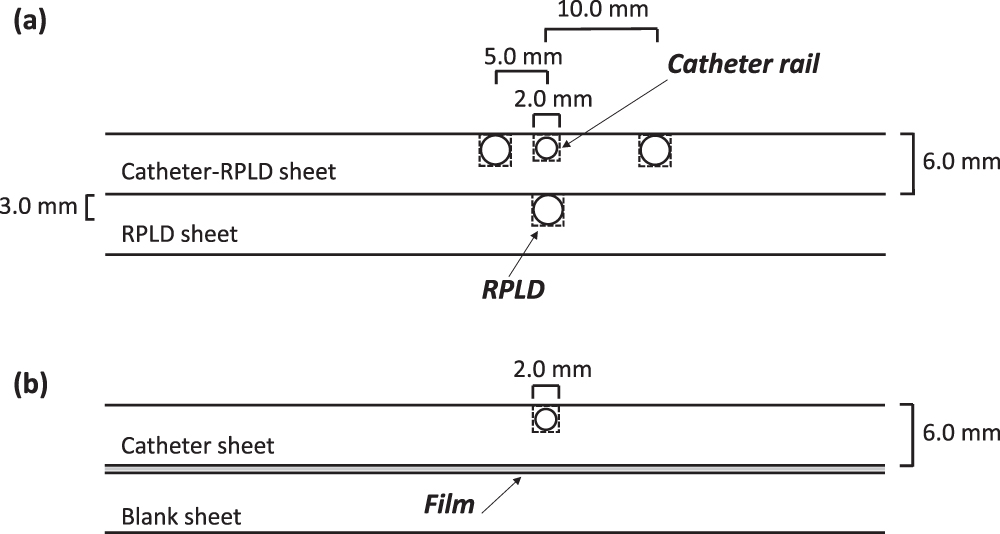
Two different sheets were made for RPLD measurements (figure 1(a)):
- Catheter-RPLD sheet: the surface had a machined 2 × 2 mm2 deep trail in the center of the sheet for the treatment catheter (flexible implant tube 6F for computed tomography and magnetic resonance imaging, single leader, 30 cm, Elekta AB).Four positions were used on both sides of the catheter. The positions for the RPLDs were 3 × 3 × 12 mm3 and their distances to the catheter were 5 and 10 mm measured from the middle of the holes.
- RPLD sheet: machined with five holes for RPLDs in the center of the sheet. This sheet was placed under the Catheter-RPLD sheet.

Figure 1. Schematic representation of the cross-sections of polycarbonate sheets in (a) RPLD and (b) film measurements. The full dimensions of the PC sheets were 260 × 260 × 6 mm3 (RPLD: radiophotoluminescence dosimeter).
Download figure:
Standard image High-resolution imageWhen the Catheter-RPLD sheet and the RPLD sheet are overlapped, the distance from the middle of the catheter to the middle of the RPLD position in the RPLD sheet is approximately 6.5 mm.
Two different catheter sheets were made for film measurements (figure 1(b)):
- Catheter sheet: only contained the catheter trail.
- A blank sheet that was under the radiochromic film.
In both measurements, PC sheets were placed between 2 mm thick and a total of 180 mm thick solid water slabs (Solid Water HE, Gammex - a Sun Nuclear Company, Middleton, WI, USA) to simulate the structures of the skin and internal body (figure 2(a)). The solid water slabs (density of 1.032 g cm−3) were 353 × 367 mm2 in size and the thickness varied from 2 to 50 mm. Measurements with RPLDs were performed at four different distances from the catheter: 5.0, 6.5, 10.0 and 11.5 mm. For the 11.5 mm distance measurement, a 5 mm solid water slab was placed between the Catheter-RPLD sheet and the RPLD sheet. In the film measurements, three different depths were measured: 5.0, 10.0 and 15.0 mm. For the 5.0 mm depth, the film was placed between the Catheter sheet and the blank sheet. At a depth of 10.0 and 15.0 mm, the film was between two solid water slabs.
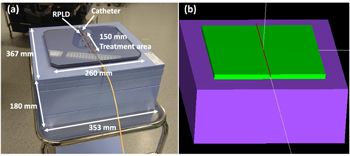
Figure 2. (a) Measurement phantom made of polycarbonate and solid water. (b) Phantom modeled with egs_brachy. 2.0 mm solid water slab is missing from the figures for better illustration (RPLD: radiophotoluminescence dosimeter).
Download figure:
Standard image High-resolution image2.4. Simulations and calculations
For the MC simulations, egs_brachy (downloaded 20.11.2021) was used with Dell Precision T5600XL desktop computer equipped with two 2.0 GHz Intel Xeon E5–2620 processors (2 x 6 cores) and 32 GBs RAM. During simulations, 10 CPU cores were used. Three measurement configurations (PMMA catheter, PC sheets, solid water slabs) were created within egs_brachy:
- 12 mm thick PC matrix (grid size of 1.0 × 1.0 × 0.5 mm3), where the catheter was modeled on the surface of the matrix. The dose was scored to PC. The PC sheet was between solid water slabs as in the measurements (figure 2(b)).
- Two 6 mm thick PC matrices with 5 mm of solid water slab between them. The dose was scored to lower PC.
- One 6 mm thick PC matrix, below it a 15 mm thick solid water matrix, and solid water at the bottom. The dose was scored into a solid water matrix.
From the first configuration, profiles were collected for comparison with film measurements at 5.0 mm depth and RPLD measurements at 5.0, 6.5 and 10.0 mm distances. A second configuration was run for comparison with RPLDs at 11.5 mm distance and a third for 10.0 and 15.0 mm depths with film measurements.
In each measurement setup, a hollow 2 mm thick and 160 mm long PMMA cylinder was made in the top matrix of PC to simulate a catheter with an inner diameter of 1.4 mm. The center of the x-axis was in the middle of the cylinder and the source moved along the axis. The created phantoms were placed in the middle of a 400 × 400 × 400 cm3 air cube. For the simulations, density correction files were created using the ESTAR application by NIST (National Institute of Standards and Technology, Gaithersburg, MD, USA), which calculates the stopping power, density effect parameters, range, and radiation yield tables for electrons in various materials (National Institute of Standards and Technology 2021). The correction factor was calculated according to the egs_brachy manual and implemented in simulation for scaling the dose to be comparable with the measurements (Thomson et al 2017). Library sources microselectron-v2 and MBDCA-WG were used for microSelectron and Bravos, respectively. The dimensions of the sources were the same as in Islam et al (Islam et al 2012). and in Ballester et al (Ballester et al 2015). The simulations were run separately with both sources. The MBDCA-WG source model was used because the egs_brachy library did not contain GammaMed Plus source model at the time of simulations. The differences between the source models are small and the effect on the results was estimated to be negligible. CAX profiles were collected using the Profeel, an open-source dosimetry data visualization software made with MATLAB® (The MathWorks, Inc., Natick, MA, USA) computing platform (Pakarinen and Ojala 2021).
The transport parameters and cross section options for the EGSnrc input and the parameters of the MC method based on the recommendation of AAPM Research Committee Task Group 268 (Sechopoulos et al 2018) are presented in appendix (A1and A2). Volume source correction was used in the simulations and the density of random points was set to 1 × 108 cm−3. The tracklength estimator was not used for dose scoring.
For comparison, the calculated dose profiles were made with Eclipse TPS, where the treatment plan of a 15 cm long keloid scar was calculated with the TG-43 algorithm in water. In addition, treatment was also re-calculated using Eclipse's Acuros BV (v. 1.8.0.867816) dose calculation algorithm for additional interest and comparison. From the calculated treatment plans, dose profiles were exported from three depths corresponding to film measurements.
3. Results
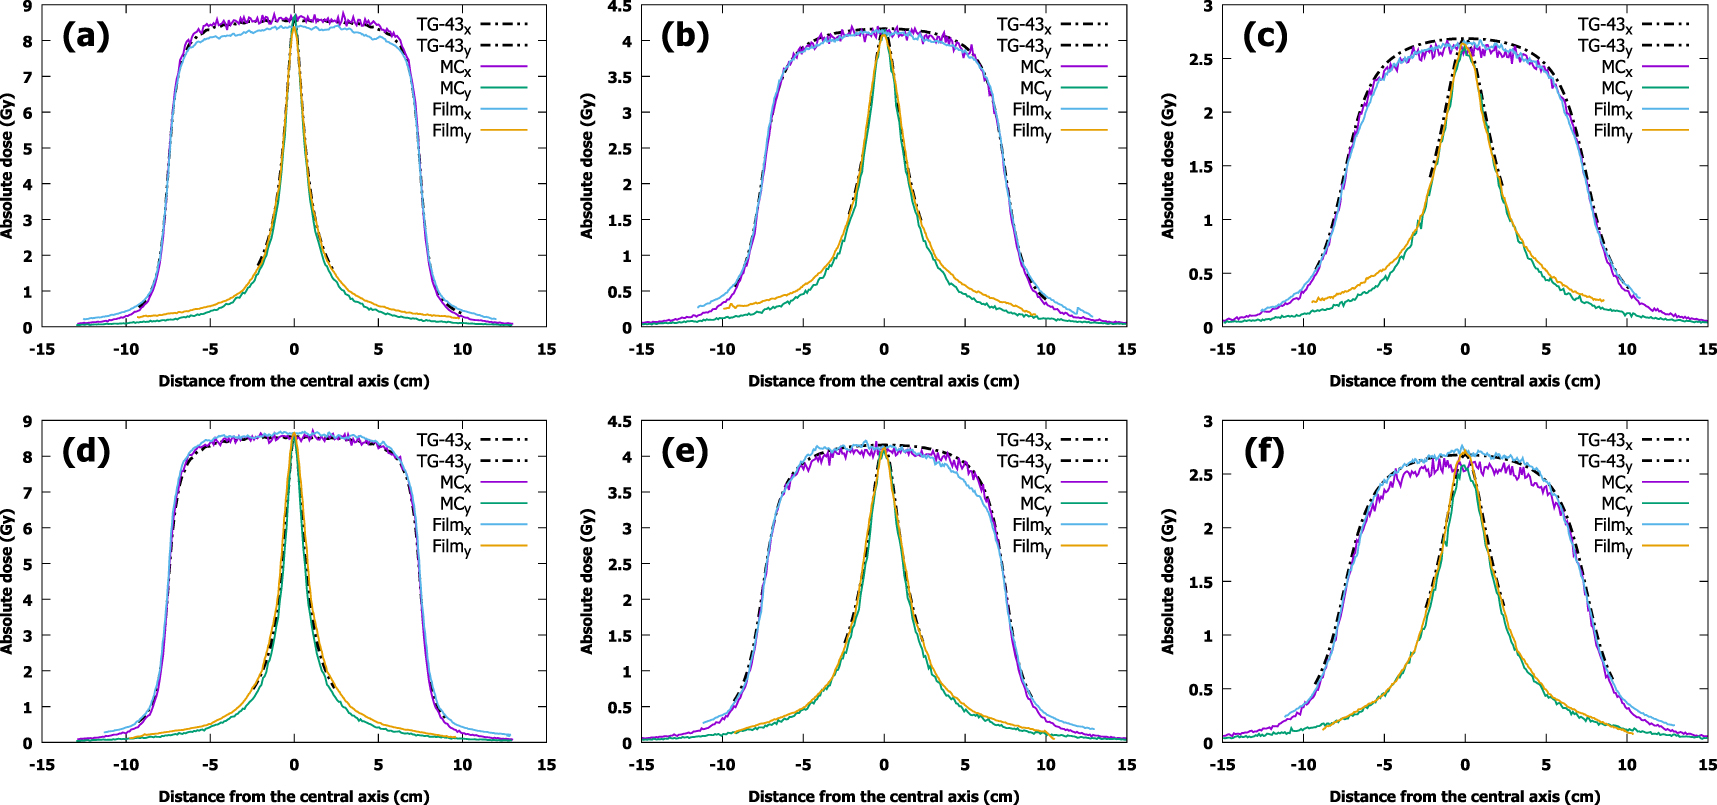
Film measurements, calculated doses and MC-simulated dose profiles at depths of 5.0, 10.0 and 15.0 mm are presented in figure 3. Each profile was independently centered using the calculated full width at half maximum of the profile. The doses measured with the RPLDs at the distance of 5.0, 6.5, 10.0 and 11.5 mm from the source with the corresponding simulation results are shown in figure 4. The figures for the Acuros BV dose profiles can be found in the supplementary files and are plotted against film-measured and MC-simulated profiles.
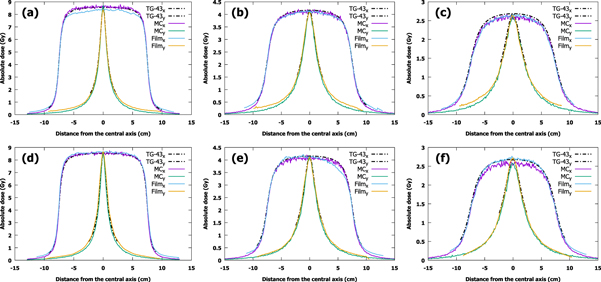
Figure 3. Measured, simulated and calculated x- and y-profiles at depths of 5.0, 10.0 and 15.0 mm in a polycarbonate and solid water phantom using (a)–(c) microSelectron (microSelectron-v2) and (d)–(f) Bravos (GammaMed Plus) afterloaders (TG-43: Task Group No. 43, MC: Monte Carlo).
Download figure:
Standard image High-resolution image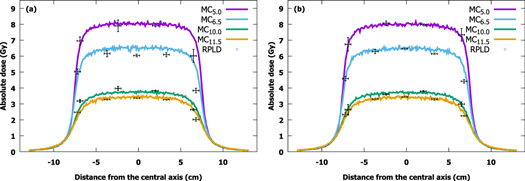
Figure 4. Doses measured at distances of 5.0, 6.5, 10.0 and 11.5 mm from the source by RPLDs plotted against simulated profiles at corresponding distances using (a) microSelectron (microSelectron-v2) and (b) Bravos (GammaMed Plus) afterloaders. RPLD points are colored according to profiles (MC: Monte Carlo, RPLD: radiophotoluminescence dosimeter).
Download figure:
Standard image High-resolution image
The average difference between the film measurements and MC simulations in the 80% treatment area is less than 1% at 10.0 mm and 15.0 mm depth, and the largest difference is less than 4% at 5.0 mm depth with the microSelectron. For Bravos, the average differences between measurements and MC simulation at 10.0 mm and 15.0 mm depth were less than 1% and 4%, respectively, and less than 2% at 5.0 mm depth.
When profiles calculated with the TG-43 are compared with film results, the differences are small, the largest being less than 4% with the microSelectron and less than 2% with the Bravos. With MC simulations, the difference increases with depth, the smallest being less than 1% and the largest being less than 4% with both afterloaders. The same trend is not observed with Acuros BV: the largest difference is of the same size, less than 4% compared with MC and less than 3% with film.
The results of RPLDs match the MC-simulated profiles nicely, although the largest absolute difference (microSelectron <30% and Bravos <11%) at the edge of the profiles, where the placement of the RPLDs is most sensitive. If the results near the edge of the profiles are excluded, the largest difference is less than 7% with the microSelectron and less than 4% with the Bravos.
The simulation and the measurement uncertainties at each distance from the source are tabulated in table 1. The MC uncertainties are taken as the maximum of the statistical uncertainties of the 80% treatment area. Uncertainties for RPLDs take into account the standard deviations of multiple RPLD readings and irradiations. The film values are approximations of the uncertainties of total dose of the films. Uncertainties do not take into account human errors such as alignment of the treatment/irradiation.
Table 1. Monte Carlo, RPLD and film uncertainties. The values shown are averages of all standard deviations at that particular distance, with smallest and largest uncertainty presented in brackets.
| Distance from the source | Monte Carlo (%) | RPLD (%) | Film (%) |
|---|---|---|---|
| 5.0 mm | 0.008 (0.008) | 3.6 (0.2–6.8) | 4.0 |
| 6.5 mm | 0.009 (0.009) | 2.3 (1.0–3.9) | — |
| 10.0 mm | 0.02 (0.02) | 3.8 (1.1–12.2) | 4.0 |
| 11.5 mm | 0.02 (0.02) | 2.0 (0.6–5.3) | — |
| 15.0 mm | 0.02 (0.02) | — | 4.0 |
4. Discussion
In this study, the feasibility and accuracy of the absorbed dose delivered with the Ir-192 source from the HDR afterloader were investigated in brachytherapy of keloid scars. For comparison, egs_brachy MC simulations and dosimetry with RPLDs and film were used. In addition, the accuracy of the TG-43 dose model and the Acuros BV algorithm was investigated with two source types from different afterloaders in the HDR treatment of keloid scars.
The measured and simulated CAX dose profiles of both treatment units agree well, the largest difference was less than 4% for both afterloaders. These differences are most likely due to two reasons. The first and largest effect is due to the fact that film-measured results represent dose in water and MC-simulated results represent dose in medium (PC). Secondly, we do not know how accurate our modeled PC material is compared with the actual material used in the measurements. The asymmetric film profile at 10.0 mm depth with the Bravos is probably due to an unobserved gap between the sheets in the measurement setup. The difference between the dose in water and the dose in medium could be investigated with several MC simulations, where the modeled PC material is changed to water with different densities, after which the results could be compared. However, this was not the aim of this study.
The profiles calculated with the TG-43 and Acuros BV show how much the plan can differ from the treatment. egs_brachy source parameters have previously been shown by Chamberland et al to be very similar (<2%) to TG-43 source parameters (Chamberland et al 2016). The differences between TG-43, Acuros and MC in this study are probably due to better overall calculation accuracy of MC simulations compared with TG-43 calculations as the distances from the source increase, as well as the different phantom models.
The results of RPLDs fit well with the MC-simulated profiles in the maximum dose range, but large differences can be observed (microSelectron <30% and Bravos <11%) near the edge of the profile. Hsu et al have also previously reported good accuracy (<5%) of RPLDs when using an Ir-192 source (Hsu et al 2008). The observed large differences are likely due to the poor layout accuracy of the RPLDs: measurements with an HDR source are very sensitive to the distance between the source and the dosimeters, and they become more sensitive, the closer to the source. This is reflected in the results at a distance of 10.0 mm with the microSelectron, where RPLD-measured doses are higher than the MC-simulated profile at this distance. However, if the profile would be taken at a distance of 9.5 mm, RPLD results would match perfectly with the MC simulation. Treatment was also aligned manually, which only affects the accuracy of RPLD measurements. The dose difference between the afterloaders is probably due to difference of the delivering practice between the device and activity of the sources.
One factor of error that affects all measurements is due to source location. Source vertical location and angle might differ inside the catheter than that in the model as the catheter inner diameter is slightly larger than the source diameter. Due to gravity, the source travels touching the lower inner surface of the catheter, not in the center as in the MC model. The inner diameter of the catheter was approximately 1.4 mm, which means that the source can be 0.25 mm closer to the dosimeters than in the simulation. If the source runs horizontally along the lower inner surface, the effect on the results is less than 2%.
Table 1 shows the uncertainties of simulations and measurements. Although the film has the highest uncertainty, it does not have as large alignment and layout error as RPLDs.
5. Conclusions
In conclusion, our data show that the nominal treatment dose can be achieved with the utilized setup. The calculation accuracy of TG-43 seems to decrease as the distance from the source increases, which does not significantly affect the treatment of keloid scars. The RPLD results were acceptable, the largest difference being near the edge of the profile. In further measurements, the placement of RPLDs requires special attention. Both afterloaders worked as they should, i.e. no major malfunctions were detected.
Acknowledgments
This work was supported by the State Research Funding of Finland [grant number 11208], Lounais-Suomen Syöpäyhdistys RY and by Emil Aaltosen Säätiö Sr The funding had no role in: study design; in the collection, analysis and interpretation of data; in the writing of the report; nor in the decision to submit the article for publication.
Data availability statement
The data that support the findings of this study are openly available at the following URL/DOI: https://doi.org/DOI: 10.17632/pzjhjv5kcc.2. Data will be available from 2 March 2023.
Conflict of interest
No conflicts of interest.
Appendix
Table A1. Summary of transport parameters and cross section options used in the egs_brachy simulations.
| Item name | Parameter |
|---|---|
| Photon cross sections | mcdf-xcom |
| Compton cross sections | default |
| Global PCUT | 0.001 |
| Pair cross sections | NRC |
| Pair angular sampling | KM |
| Triplet production | On |
| Bound Compton scattering | On |
| Radiative Compton corrections | On |
| Rayleigh scattering | On |
| Atomic relaxations | On |
| Photoelectron angular sampling | On |
| Photonuclear attenuation | On |
| Photonuclear cross sections | default |
| Global ECUT | 0.512 |
| Brems cross sections | NRC |
| Brems angular sampling | KM |
| Spin effects | On |
| Electron Impact Ionization | ik |
| Global Smax | 1e+10 |
| ESTEPE | 0.25 |
| Ximax | 0.5 |
| Boundary crossing algorithm | Exact |
| Skin depth for BCA | 3 |
| Electron-step algorithm | EGSnrc |
Table A2. Summary of parameters used in Monte Carlo simulations, based on recommendation of AAPM Research Committee Task Group 268 (Sechopoulos et al 2018) John Wiley & Sons. [© 2017 American Association of Physicists in Medicine]. Statistical uncertainty is the range from three simulations calculated by EGSnrc for the entire simulation area, where the dose is higher than 20% of the maximum dose.
| Item name | Description | References |
|---|---|---|
| Code, version/release date | egs_brachy/ 20.11.2021 | |
| Validation | — | (Chamberland et al 2016) |
| Timing | 140 CPU h (total) / E5-2620 x 2 | |
| Source description | microselectron-v2, MBDCA-WG | (Safigholi et al 2022) |
| Cross-sections | mcdf-xcom | |
| Transport parameters | PCUT = 0.001 MeV ECUT = 0.512 MeV | |
| VRT and/or AEIT | BCSE, UBS, Russian roulette, Range rejection | (Chamberland et al 2016) |
| Scored quantities | Dose to medium using interaction scoring | |
| # histories/ statistical uncertainty | 2e10/ 0.5%-1.4% | |
| Statistical methods | Uncertainties are calculated with the default history-by-history method used in EGSnrc | |
| Postprocessing | No filtering, Dose scaling (egs_brachy), Profeel | (Thomson et al 2017), (Pakarinen and Ojala 2021) |