
Abstract
Objective. Intrafraction motion is a major concern for the safety and effectiveness of high dose stereotactic body radiotherapy (SBRT) in the upper abdomen. In this study, the impact of the intrafraction motion on the delivered dose was assessed in a patient group that underwent MR-guided radiotherapy for upper abdominal malignancies with an abdominal corset. Approach. Fast online 2D cine MRI was used to extract tumor motion during beam-on time. These tumor motion profiles were combined with linac log files to reconstruct the delivered dose in 89 fractions of MR-guided SBRT in twenty patients. Aside the measured tumor motion, motion profiles were also simulated for a wide range of respiratory amplitudes and drifts, and their subsequent dosimetric impact was calculated in every fraction. Main results. The average (SD) D99% of the gross tumor volume (GTV), relative to the planned D99%, was 0.98 (0.03). The average (SD) relative D0.5cc of the duodenum, small bowel and stomach was 0.99 (0.03), 1.00 (0.03), and 0.97 (0.05), respectively. No correlation of respiratory amplitude with dosimetric impact was observed. Fractions with larger baseline drifts generally led to a larger uncertainty of dosimetric impact on the GTV and organs at risk (OAR). The simulations yielded that the delivered dose is highly dependent on the direction of on baseline drift. Especially in anatomies where the OARs are closely abutting the GTV, even modest LR or AP drifts can lead to substantial deviations from the planned dose. Significance. The vast majority of the fractions was only modestly impacted by intrafraction motion, increasing our confidence that MR-guided SBRT with abdominal compression can be safely executed for patients with abdominal tumors, without the use of gating or tracking strategies.
Export citation and abstract BibTeX RIS

Original content from this work may be used under the terms of the Creative Commons Attribution 4.0 licence. Any further distribution of this work must maintain attribution to the author(s) and the title of the work, journal citation and DOI.
1. Introduction
Stereotactic body radiotherapy (SBRT) has been shown to be an effective therapy for unresectable pancreatic carcinomas (Chang et al 2009, Mahadevan et al 2010, Heerkens et al 2018, Reyngold et al 2019, Rudra et al 2019), potentially increasing life expectancy in a patient population with a generally poor prognosis. MR-guided radiotherapy (MRgRT) enables online visualization of anatomy changes for a tailored treatment to the anatomy of the day, and has made high dose radiotherapy for upper abdominal malignancies feasible (Placidi et al 2020a).
An important concern with MR-guided online adaptive SBRT in the upper abdomen is intrafraction motion. This is not only because of the large variability and unpredictability of tumor motion in the upper abdomen (Bussels et al 2003, Feng et al 2009), but also because beam-on times are generally prolonged on MR-guided systems due to their limited linac dose rate compared to conventional systems. Active motion management methods, like using internal targets for gating (Poulsen et al 2015, Worm et al 2018) or tracking (Vinogradskiy et al 2019, Kaučić et al 2021), or gating on deep inspiration breath holds (Zeng et al 2019), can significantly improve target coverage. The downside of methods using internal targets is the invasive placement of internal markers, and gating generally prolongs treatment (Heerkens et al 2014, Placidi et al 2020b). Moreover, these methods might not be readily available on all systems. Passive motion mitigation through abdominal compression has shown to be a simpler, more accessible alternative for both pancreatic tumors (Lovelock et al 2014, Campbell et al 2017, Heerkens et al 2017, Dolde et al 2019, Fujimoto et al 2019, Tyagi et al 2021, Grimbergen et al 2022) as well as liver tumors (Heinzerling et al 2008, Eccles et al 2011, Liang et al 2018, Lee et al 2021). For pancreatic tumors, abdominal compression with an abdominal corset can significantly reduce cranio-caudal tumor motion during treatment to around 5 mm (Lovelock et al 2014, Campbell et al 2017, Heerkens et al 2017, Dolde et al 2019, Fujimoto et al 2019). This results in respiratory intrafraction tumor motion that is small and stable between treatment fractions (Grimbergen et al 2022). However, because of the close proximity of upper abdominal tumors to abutting organs at risk (OARs), the exact impact of the residual intrafraction motion on the delivered dose remains of concern.
In this study, the impact of the residual intrafraction motion, after abdominal compression, on the delivered dose was assessed in a group of patients that underwent MRgRT for upper abdominal malignancies. Aside from analyzing in vivo motion, a wide range of motion scenarios was simulated in every fraction in order to systematically assess the impact of respiratory amplitude and drift on tumor coverage and OAR dose.
2. Materials and methods
2.1. Patients overview and treatment protocol
Twenty patients were included that underwent online adaptive MR-guided SBRT for upper abdominal malignancies between January 2021 and September 2021. Consecutive informed consent was provided for registry in the prospective Multi-OutcoMe EvaluatioN of radiation Therapy Using the MR-linac (MOMENTUM) study (NCT04075305). A summary of the patient characteristics is given in table 1.
Table 1. Patient characteristics.
| n = 20 (%) | |
|---|---|
| Sex | |
| Male | 11 (55) |
| Female | 9 (45) |
| Age (years) | |
| Median (IQR) | 71 (63–75) |
| Range | 49–84 |
| Tumor volume (cm3) | |
| GTV | |
| Median (IQR) | 46 (12–77) |
| Range | 3–157 |
| PTV | |
| Median (IQR) | 79 (24–115) |
| Range | 8–231 |
| Tumor location | |
| Pancreas | 15 (75) |
| Peripancreatic | 5 (25) |
| Tumor type | |
| Pancreatic primary tumor | 4 (15) |
| Pancreatic isolated local recurrence | 6 (30) |
| Non-pancreatic isolated recurrence | 5 (25) |
| Non-pancreatic oligometastasis | 4 (20) |
| Unknown | 1 (5) |
All patients were treated with a hypofractionated stereotactic regimen (5 × 8 Gy) on a Elekta Unity (Elekta AB, Stockholm, Sweden) magnetic resonance linear accelerator (MR-Linac), a 7 MV linear accelerator combined with a 1.5 T wide bore MRI scanner. The treatment protocol was as follows: for each fraction, patients were positioned on a custom fitted vacuum cushion, and secured with a custom fitted Neofrakt abdominal corset (Spronken Orthopedie NV, Genk, Belgium) (Heerkens et al 2017). This corset is fastened with Velcro straps. For the first fraction, the tightness of the straps was marked with a pen to ensure reproducibility in abdominal compression for the remaining fractions. The treatment was conducted in an online adaptive fashion (Daamen et al 2021), where every treatment session began with a 3D T2-weighted (T2w) pre MRI (FOV: 451 × 451 × 220 mm, voxel size: 0.64 × 0.64 × 2.00 mm, TE/TR: 124/1300 ms, FA: 90°) to visualize the anatomy. The gross tumor volume (GTV) and OAR contours were adapted to this scan by the attending radiation oncologist. An isotropic GTV to planning target volume (PTV) margin of 3 mm was used. Our institutional planning objectives and constraints are shown in supplementary data A (available online at stacks.iop.org/PMB/67/185016/mmedia). After contouring, a 9–14 beam step-and-shoot intensity modulated radiotherapy plan was generated, and the treatment delivery was started after approval by the physician. During treatment delivery, interleaved coronal and sagittal T2/T1-weighted bFFE cine MRIs were acquired, centered on the GTV. Both slices were acquired at a frequency of 2.8 Hz for the entire beam-on time. A detailed overview of the cine MRI sequence parameters is given in supplementary data B.
2.2. Intrafraction motion measurement
Deformable image registration (DIR) with EVolution (de Senneville et al 2016) (α = 0.35, patch size = 5 × 5) was used to warp every dynamic of the cine MRI set to a reference dynamic. The resulting 2D deformation vector fields were used to warp the GTV annotation to the dynamics, resulting in a contour that moved along with the anatomy in 2D + time in both the sagittal and coronal plane. The displacement of its center of mass in the CC, LR (respectively the y and x components of the contour centroid in the coronal plane), and AP (the x component in the sagittal plane) direction was tracked over time, resulting in motion profiles of the tumor centroid with a high temporal resolution of 2.8 Hz (supplementary video (1)). These motion profiles were used for the dose accumulation described in the following section. In order to test the validity of the estimated tumor motion, an additional study was conducted to compare the motion profiles from EVolution to the motion profiles extracted with optical flow (Zachiu et al 2015) and Elastix (Klein et al 2009), two commonly used methods for DIR. A high degree of agreement between EVolution, optical flow and Elastix was found, with the mean differences in center of mass position under one millimeter. Details and results of this study can be found in supplementary data C.
The intrafraction motion of a fraction was characterized by the respiratory amplitude and maximum baseline drift. These were quantified by applying a high-pass and low-pass filter to isolate the motion caused by respiration and baseline drift, respectively. The high-pass filter was an elliptic infinite impulse response filter with a cutoff frequency of 0.05 Hz, and the low-pass filter was a moving average filter with a sliding window of 25 s. The respiratory amplitude was calculated as the difference between the 5th and 95th percentile of the respiratory motion profile, and the maximum baseline drift as the largest signed value in the drift motion profile. Finally, the magnitude of the respiratory amplitude and drift was calculated as the respective vector length (2-norm) over the individual values for CC, AP, and LR, that is:  and
and 
2.3. Delivered dose reconstruction
The reconstruction of the delivered dose was based on Kontaxis et al (2020). For each fraction, the corresponding log file was saved from the machine. These log files include the current state of the linac, e.g. gantry angle, multi-leaf collimator positions, and beam energy, logged at an interval of 40 ms. Each log file was split into partial log files of 360 ms, containing a single linac state. The splits were made on the absolute acquisition times of the cine MRI dynamics. Then, each partial log file was combined with a pseudo-CT volume, generated from a bulk density assignment of the pre MRI, to calculate a partial dose plan with GPUMCD (Hissoiny et al 2011). All dose calculations were run on a dedicated workstation equipped with an NVIDIA GeForce Titan X GPU. An isocenter shift was applied to each partial dose plan based on the displacement measured in the cine MRI dynamic that corresponds to the same time point as the partial dose plan. In other words, a displacement was only applied to the part of the treatment that was delivered at the same time as when the displacement occurred in the body. Finally, all translated partial dose plans were summed to obtain the delivered dose plan.
The method of dose reconstruction is illustrated in figure 1.

Figure 1. The workflow of the dose reconstruction method. The coronal and sagittal cine MRIs, along with their respective GTV contour projections (red), are deformably registered along time. This results in a 3D GTV motion profile. The linac machine log file is split into partial log files based on the cine MRI acquisition timestamps, and each partial log file is reconstructed into a partial dose plan. Every dose plan is then translated according to the 3D displacement measured at its corresponding time point in the motion profile. The translated dose plans are summed to obtain the accumulated dose.
Download figure:
Standard image High-resolution image2.4. Motion simulation
Aside from the motion as measured in the imaging data, we simulated intrafraction motion profiles with a wide range of motion amplitudes and drift magnitudes. The rationale for this exercise is that by doing so, we could break down the dosimetric outcome for each clinical motion profile to the individual origins. And reversely, we could assess the pattern of the impact of the periodic respiratory motion separately from the motion drift in anterior, posterior, cranial, caudal, left and right directions. To mathematically model intrafraction motion, we adopted a commonly used equation, which assumes respiratory motion follows an asymmetric cosine pattern in 1D and was first coined by Lujan et al (1999):

With z0 the position at exhale, r the respiratory peak-to-peak amplitude, τ the respiratory period and n a parameter to set the asymmetry of the motion profile: a larger value for n leads to a longer time spend in exhale position and steeper motion profiles during a respiratory cycle. The starting phase φ is excluded in equation (1). Visually, we determined that τ = 5 s and n = 3 best fit the general shape of the motion profiles from our measured data. Furthermore, we set z0 to the average position of the first 30 s, similar to how the mid-ventilation position was defined in the measured motion profiles. Equation (1) was extended from 1D to the three principal directions of motion: cranio-caudal (CC), anterior–posterior (AP) and left–right (LR). An additional component was added to equation (1) to simulate a linear drift over the course of the motion profile, with total magnitude d. The value of r was set as the respiratory amplitude in the CC direction, and the respiratory amplitudes in the AP and LR directions were set to r/2. Because of the relation between r and z0, that essentially means that the LR and AP motion profiles are half that of the CC motion, outside of the drift term.
Overall, the model for the 3D motion vector ![${\bf{z}}\left(t\right)=\left[\begin{array}{ccc}{z}_{CC}\left(t\right) & {z}_{AP}\left(t\right) & {z}_{LR}\left(t\right)\end{array}\right]$](https://content.cld.iop.org/journals/0031-9155/67/18/185016/revision2/pmbac8dddieqn3.gif) was described with the following equations:
was described with the following equations:


where T represents the total duration of the simulation motion, which was set to the duration of the measured motion profile of the fraction in question. Equations (2)–(4) were sampled at the frequency of the measured motion (2.8 Hz). In each simulation, drift was implemented in one direction only: if d was set to a nonzero value in the one direction, d was set to zero in the other directions. The model parameters r and d were set to r ∈ {0, 5, ..., 20} mm and d ∈ {−5, 0, 5} mm. Negative values indicate drift in the caudal/anterior/right direction, and positive values indicate drift in the cranial/posterior/left direction. The instance (r, d) = (0, 0) was excluded, since this is equal to the planned dose. In sum, this yielded 34 different motion simulations. For every fraction, the delivered dose was reconstructed for all 34 simulated motion patterns, in the same manner as the dose was reconstructed for the measured motion of that fraction (as described in section 2.3).
2.5. Evaluation
The impact of the measured and simulated intrafraction motion was dosimetrically evaluated by comparing the planned to the delivered dose based on key dose-volume histogram (DVH) parameters in the GTV and multiple OARs. The OARs of interest were the duodenum, stomach and small bowel. For the GTV, we evaluated ratios of the D99%, i.e. the minimum dose to 99% of the volume. For the OARs, we evaluated the ratios of the D0.5cc , i.e. the minimum dose in 0.5 cm3 of the volume. The ratios were calculated as the delivered dose divided by the planned dose. For example: a fraction with a relative D99% < 1 means the delivered D99% of the GTV was lower than the planned D99%. Only OARs were included for dose evaluation if they were within a 2.5 cm isotropic margin of the GTV, because the dose level outside this margin was too low to be dosimetrically relevant.
3. Results
The patient cohort of this study consisted of eleven male and nine female patients, with a median age of 71 years (range 49–76 years). All twenty patients received full treatment of five fractions. In eleven fractions, the linac log files were written as multiple separate files due to treatment interruptions. Because linac data was missing in between these files, these fractions were disregarded from this study, resulting in a total of 89 evaluable fractions. Average beam-on time was 11.3 min, and the log file of each fraction was split into an average of 1808 linac states. The dose calculations to compute partial dose plans out of the linac states took 8.4 h per fraction on average. Application of the isocenter shifts, obtained from a motion profile, to these partial dose plans took 6 min on average. A full simulation run for the artificial motion data, in which 34 motion profiles were processed, took 3.4 h per fraction.
Delivered dose to the GTV was evaluated in all 89 fractions. The dose to the duodenum was evaluated in 38 fractions, the dose to the small bowel in 80 fractions, and the dose to the stomach in 58 fractions.
3.1. Impact of measured motion
The average (SD) relative D99% of the GTV was 0.98 (0.03) (figure 2). In more than 85% of the fractions (77/89), the delivered D99% of the GTV was more than 95% of the planned D99%. For only two fractions, the delivered D99% of the GTV was lower than 90% of the planned D99%. Subanalysis revealed that the dose distributions for some patients were more prone to deterioration with the respect to planned target coverage than other, see supplementary data D.
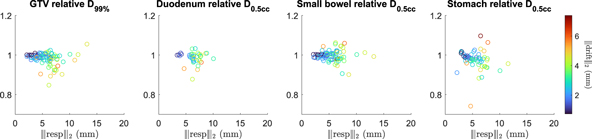
Figure 2. The relative DVH parameters in the GTV and OARs of the measured intrafraction motion. Each point represents a fraction, accumulated with the motion measured during that fraction, and characterized by the magnitudes of the respiratory amplitude(x-axis value) and drift of that fraction (point color).
Download figure:
Standard image High-resolution imageThe average (SD) relative D0.5cc of the duodenum, small bowel, and stomach was 0.99 (0.03), 1.00 (0.03), and 0.97 (0.05), respectively. All hot spots of the delivered dose to the OARs remained below 110% of the planned D0.5cc.
Overall, it was observed that fractions with larger respiratory amplitudes generally also inhibit larger drifts. For these fractions, the variability of dosimetric impact on both the GTV and OARs was larger than in fractions where smaller motion had been measured. This can be seen in figure 2, as the relative DVH parameter values fan out with larger respiratory amplitude and drift, while still centered around 1.00.
3.2. Impact of simulated motion
The GTV D99% was very robust to respiratory amplitudes up to 10 mm (figure 3). For drifts, asymmetric patterns were observed for the different directions. Drifts in the anterior and right direction induced a decreased tumor coverage, while drifts in the cranial, caudal, posterior and left direction hardly impacted delivered dose.
For the OARs, the dose decline as a function of respiratory amplitude increased was less steep than for the GTV. On average, each OAR was only influenced by a drift in a single direction. This was LR drift for the duodenum, AP drift for the small bowel and CC drift for the stomach. The stomach had a much more pronounced relation to drift, albeit with larger uncertainties. With a respiratory amplitude of under 10 mm, a caudal drift of 5 mm led to the delivered D0.5cc of the stomach to be over 110% of the planned D0.5cc on average. Vice versa, a cranial drift of 5 mm caused the delivered D0.5cc to drop to 90% of the planned D0.5cc . The 5 mm LR drifts in the duodenum and AP drifts in the small bowel only caused deviations of no more than 5% above or below the planned D0.5cc .
4. Discussion
We have calculated the delivered dose for upper abdominal tumors based on the intrafraction motion. In our workflow, the coupling of cine MR-derived motion data to log file-derived treatment delivery data allows for high frequency, time-resolved dose accumulation that includes all motion measured from beam-on to beam-off.
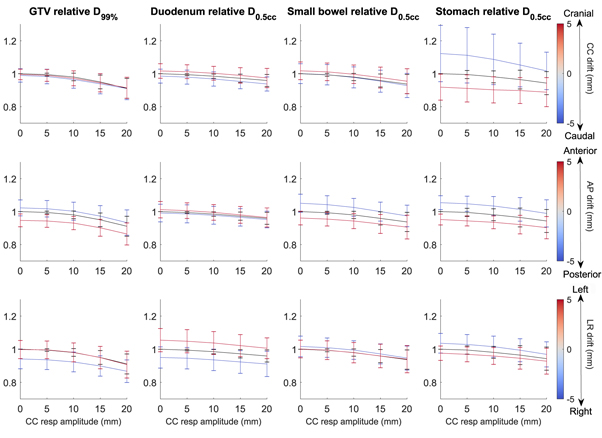
Figure 3. The relative DVH parameters in the GTV and OARs, averaged overall fractions, of the simulated intrafraction motion, as a function of respiratory amplitude and drift. The value of the points on the line plot is the average DVH parameter, and the error bars extend one standard deviation above and below the average. Top row: simulations with CC drift. Middle row: simulations with AP drift. Bottom row: simulations with LR drift. The simulations with zero drift are plotted as a black line to aid visualization. Typically small differences were observed between the planned D99% and the actually delivered D99% for the GTV. Interestingly, no correlation was observed between the respiratory amplitude of the measured intrafraction motion, and the impact on both the delivered GTV D99% and OARs D0.5cc . This finding was replicated in the simulations: on average, no substantial deviations from the planned dose were observed for respiratory amplitudes below 10 mm CC. Since in our cohort respiratory amplitudes larger than 10 mm CC were measured in only three fractions, the impact of the respiratory motion on the dose delivery was estimated to be negligible for the vast majority of fractions.
Download figure:
Standard image High-resolution imageThe main deviations from the planned dose were caused by baseline drifts. A larger drift led to with a lower delivered GTV D99%. Dose to the OAR was observed to be higher or lower than the planned dose with an increased drift. The simulations demonstrated that the dosimetric effect of the drift is highly dependent on its direction: for the GTV, simulations with anterior and right drifts lead to systematically lower delivered GTV D99%. For drifts in the other directions, the impact of drift on the delivered D99% was negligible. For the OARs, this asymmetric pattern in opposing directions was not observed. Rather, each OAR was sensitive to drift only along one principal axis, and the effect of drift on delivered D0.5cc was of approximately equal magnitude for drifts in opposing directions. For example, the D0.5cc for the duodenum was only influenced by LR drift, where drifts to the right yielded a dose decrease, and drift to the left an increased dose. These correlations come from the typical anatomical relation of the OARs relative to (peri) pancreatic tumors. The duodenum is typically located on the right side of the GTV, and therefore a tumor drift towards the right will lead to underdosage of the GTV. Drifts to the left will likewise lead to overdosage of the duodenum. Furthermore, the small bowel is often anteriorly positioned to the GTV, whereas the stomach is located cranially of the GTV, leading to an analogous dependence on the drift direction, as depicted in figure 3. In general, these results reinforced our believe that further motion mitigation strategies should be more directed towards compensating intrafraction drifts than towards further reducing periodic respiratory induced motion patterns.
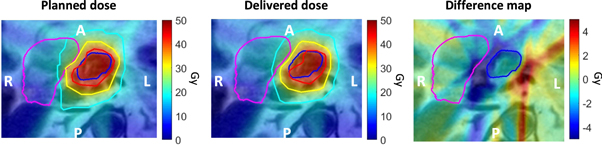
This finding also held for patient 8, where for fraction 5 the lowest relative GTV D99% of 0.85 was observed for all analyzed fractions. Subanalysis revealed that substantial right drift of 2.5 mm was observed (figure 4) which resulted in a lower dose to both the GTV and duodenum.
Figure 4. Zoomed maps of planned, delivered, and difference (planned–delivered) dose of the fifth fraction of patient 8, where delivered GTV D99% = 85% of planned D99%. The GTV contour is shown in dark blue, and the duodenum contour is shown in pink. The planned and delivered dose contain the isodose contours of 40 Gy (red), 30 Gy (yellow) and 20 Gy (teal). Note that this dose plan is scaled to the complete 5 × 8 Gy treatment plan.
Download figure:
Standard image High-resolution image
Recently, Tyagi et al (2021) also reported on the dosimetric impact of intrafraction motion in pancreatic MRgRT with abdominal compression, by directly comparing the 3D T2w position-verification (PV) and post-scan to the pre-scan. Our findings in terms of delivered GTV coverage are in line with theirs, as the authors reported no significant changes in GTV V100%, and a wider spread in key DVH parameters of the stomach and small bowel in the PV- and post-scan. This is comparable to the increase in spread in small bowel and stomach relative D0.5cc that we observed for patients with larger drifts.
A limitation of our work is that the dosimetric analysis was based on quasi-rigid motion profiles, i.e. we neglected the impact of possible intrafraction deformations in the dose accumulation process. However, although deformations are well known to be present in the upper abdomen, especially in hollow structures, we believe that impact of this restraint is very limited for two reasons. First, the assessed dose parameters are solely determined by the voxels of the substructures of both the target and the OAR that are located at the dose gradients within the high-dose region, which in turn are in the close surrounding of the target volume. Due to the dense cell structure of the tumor, the target volume movement is judged to move rigidly, which was also visually confirmed upon assessment of the cine MRIs. Secondly, we demonstrated that the deviations are mostly determined by small drifts (<3 mm) often to muscle relaxation, which we believe could well approximated as locally rigid.
Finally, while the simulation study allowed a systematic evaluation of the different aspects of intrafraction motion and their effect on delivered dose, the simulated motion remains a simplified model not easily translated to a clinical situation. Especially with larger respiratory amplitudes, the assumption of rigid transformation might no longer hold.
5. Conclusion
For the vast majority of fractions and patients, the intrafraction motion observed during treatment delivery with an abdominal corset only modestly impacted the dose to the target and OAR. This increases our confidence that MRgRT can be safely executed for patients with abdominal tumors without the use of gating or tracking techniques, potentially allowing dose escalation strategies. The results in this study also add to the supportive evidence for the use of abdominal compression in general, as this can also be applied for radiotherapy on conventional systems. Subanalysis revealed that the impact of the intrafractional drifts on the delivered dose was more prominent than the impact of the respiratory motion. Care should be taken in patients where the tumor and OAR are close together, as only small drifts can lead to systematic deviations from the planned dose.
Acknowledgments
This work was supported by the Dutch Cancer Foundation (KWF) under Grant Agreement No. 12665.
Supplementary data (0.2 MB PDF)
Supplementary data (7.3 MB MP4)