
Abstract
Organ-specific PET scanners have been developed to provide both high spatial resolution and sensitivity, although the deployment of several dedicated PET scanners at the same center is costly and space-consuming. Active-PET is a multifunctional PET scanner design exploiting the advantages of two different types of detector modules and mechanical arms mechanisms enabling repositioning of the detectors to allow the implementation of different geometries/configurations. Active-PET can be used for different applications, including brain, axilla, breast, prostate, whole-body, preclinical and pediatrics imaging, cell tracking, and image guidance for therapy. Monte Carlo techniques were used to simulate a PET scanner with two sets of high resolution and high sensitivity pixelated Lutetium Oxyorthoscilicate (LSO(Ce)) detector blocks (24 for each group, overall 48 detector modules for each ring), one with large pixel size (4 × 4 mm2) and crystal thickness (20 mm), and another one with small pixel size (2 × 2 mm2) and thickness (10 mm). Each row of detector modules is connected to a linear motor that can displace the detectors forward and backward along the radial axis to achieve variable gantry diameter in order to image the target subject at the optimal/desired resolution and/or sensitivity. At the center of the field-of-view, the highest sensitivity (15.98 kcps MBq−1) was achieved by the scanner with a small gantry and high-sensitivity detectors while the best spatial resolution was obtained by the scanner with a small gantry and high-resolution detectors (2.2 mm, 2.3 mm, 2.5 mm FWHM for tangential, radial, and axial, respectively). The configuration with large-bore (combination of high-resolution and high-sensitivity detectors) achieved better performance and provided higher image quality compared to the Biograph mCT as reflected by the 3D Hoffman brain phantom simulation study. We introduced the concept of a non-static PET scanner capable of switching between large and small field-of-view as well as high-resolution and high-sensitivity imaging.
Export citation and abstract BibTeX RIS

Original content from this work may be used under the terms of the Creative Commons Attribution 4.0 licence. Any further distribution of this work must maintain attribution to the author(s) and the title of the work, journal citation and DOI.
1. Introduction
The bulk of research in positron emission tomography (PET) instrumentation during the last few years focused on refining the overall performance of PET scanners through improving the hardware and software (Jones and Townsend 2017). An ideal PET scanner should simultaneously achieve high sensitivity and high spatial resolution imaging. A high-sensitivity PET scanner should enable pinpointing lesions presenting with low contrast resolution and signal-to-noise (SNR) ratio. Furthermore, a high sensitivity PET scanner allows decreasing the injected activity and/or scanning time. In some research applications, such as cell tracking, it is essential to have a high-sensitivity scanner (Aide et al 2021). The spatial resolution is a crucial factor dictating the capability of the PET scanner to image small structures and separate two closely located sources. A high-resolution scanner can distinguish the border between healthy and cancer cells and accurately localize small abnormalities (Bal et al 2014). The need for high spatial resolution imaging is more prominent in preclinical studies and scanning of pediatric patients (Amirrashedi et al 2020).
Although the quest for the ideal PET scanner continues to be a goal of the molecular imaging community, the tradeoff between sensitivity and spatial resolution, along with the remaining intrinsic technical limitations hinders the realization of simultaneous high-sensitivity and high-resolution imaging. As a rule of thumb, the sensitivity improves by (i) increasing the number of detected photons via enlarging the pixel size and thickness of crystal elements in pixelated scintillators, (ii) decreasing the diameter of the gantry, (iii) increasing the number of rings, and (iv) using scintillators with high atomic number. Conversely, the spatial resolution improves by (i) decreasing the parallax error by reducing the pixel size and thickness of crystal segments in pixelated scintillators and (ii) decreasing the acollinearity factor by using a small diameter gantry while keeping it large enough to cover the targeted subject being imaged (Arabi et al 2010). Acollinearity errors take place when the annihilation photons are not emitted exactly in opposite directions (i.e. 180 degrees apart) owing to a small amount of initial kinetic energy of positrons during the annihilation. Conversely, the parallax error occurs when the LORs do not enter a detector perpendicularly, which causes inaccuracy in the estimated LOR's coordinates. The Parallax error increases by increasing the crystal thickness and reducing the gantry's diameter.
A number of studies focused on the improvement of PET's performance through enhancing the software and hardware components. Organ-specific PET scanners dedicated for brain, breast (Hsu et al 2016), prostate (Cañizares et al 2020), and small-animal (Amirrashedi et al 2020) imaging have been developed and deployed in clinical and research settings. The design of large axial field-of-view PET scanners to enhance the sensitivity is also well underway and the number of installed systems continues to increase at a healthy pace (Nadig et al 2022).
Deep learning (DL)-based methods aiming at resolution and sensitivity enhancement focused mainly on improving the overall performance of PET scanners (Gong et al 2020, Sanaat and Zaidi 2020, Sanaat et al 2021a, 2021b). Some studies improved PET's performance by DL-based positioning in monolithic crystals, clearly outperforming conventional event positioning algorithms (Sanaat et al 2020b). To optimize the coincidence timing resolution in time-of-flight (TOF) PET, experimental measurements consisting of scanning a 68Ga point source shifted repetitively with steps of 5 mm (over a 15 cm range between the two detector modules) across the PET scanner's field-of-view was employed to train a convolutional neural network (Berg and Cherry 2018). This technique enabled to improve significantly the TOF coincidence time resolution from 527 ps to approximately 185 ps. In another work, Hong et al used Monte Carlo (MC) simulations and DL models to synthesize images that could be produced by a scanner with a small crystal bin size artificially from a scanner with large crystal size (Hong et al 2018). The EndoTOFPET-US is a scanner consisting of an external detector plate and a PET detector extension to an endoscopic ultrasound probe designed for prostate and pancreatic cancer imaging (Aubry et al 2013). A number of studies attempted to improve PET scanners' performance by introducing novel configurations for PET scanners. For instance, Zein et al proposed a new model of the Siemens Biograph Vision PET scanner with an extended axial FOV and sparse detector module rings (Zein et al 2021). Their model consisted of a non-static PET scanner, wherein the rings move in the axial direction.
Micro insert is a full-ring small animal PET scanner whose scintillators are connected through optical fibers to photosensors that provides high spatial resolution within a reduced imaging FOV (Wu et al 2008). Another study reported that a conventional PET scanner equipped with a Silicon detector probe in coincidence with the main scanner can produce images with higher spatial resolution compared to the scanner alone (Brzeziński et al 2014). Zoom-in PET combines a high-resolution detector with a conventional PET scanner to generate high-resolution images (Qi et al 2011). Another novel configuration was also introduced for plant imaging, which extends with a vertical FOV. In order to make imaging possible for different size plants, they assumed two moveable half-cylinders that can be separated at a distance up to 40 mm (Antonecchia et al 2021).
A number of novel ideas for hardware development were proposed in the literature, focusing mostly on upgrading the detector module's physical performance. For instance, creating microscopic defects inside monolithic scintillators through laser-induced optical barriers used to combine the high resolution and high sensitive characteristics of pixelated and monolithic crystals has been reported (Sabet et al 2012). A similar technical approach was used to create a belt of reflector defects inside a monolithic crystal to change the direction of optical photons inside monolithic crystals toward the photosensor (Sanaat et al 2019). Labella et al demonstrated that if a prismatoid light guide array uses inter-crystal light sharing could lead to a better depth of interaction estimation and spatial resolution (LaBella et al 2020). Polaroid-PET is also a recently introduced concept that enhances PET scanner performance through adding a layer of Polaroid between the scintillator and photosensors to remove the internal-crystal reflection of optical photons and enhance the spatial resolution (Sanaat et al 2020b). Sanaat et al proposed a preclinical PET scanner where half of the detector blocks have thick monolithic crystals while the second half has thin crystal elements. The thick crystals increase the sensitivity whereas thin crystals improve the spatial resolution (Sanaat et al 2020a). Huber et al designed a compact PET scanner for prostate cancer imaging using a pair of external curved detector arrays placed above and below the patient (Huber et al 2006, 2011). The array at the bottom is fixed while the array at the top can move vertically to enable adjusting to patient size to increase the sensitivity.
The only transformable PET scanner reported in the literature can switch between whole-body scanning mode (83 cm detector ring diameter) and brain scanning mode (54 cm detector ring diameter) (Li et al 2007). The scanner has 12 rectangular detector modules equipped with bismuth germanate (BGO) scintillators with a crystal size of 2.7 × 2.7 × 18 mm3 and photomultiplier tubes as photodetectors.
In this work, we propose Active-PET concept, a novel multi-purpose and dynamic configuration of clinical PET scanners that can mechanically switch between different geometrical modes. Half of the detector modules provide high-sensitivity (thick crystals with large pixel size) whereas the second half consists of high-resolution detectors (thin crystals with small pixel size). Furthermore, the linear translational mechanism behind the detector modules repositions the detector modules forward and backward in the transverse direction to adapt the diameter of the gantry. This degree of freedom and the two high-sensitivity and high-resolution detector modules enable to change the geometry of the scanner according to the desired characteristics. We assessed four different configurations corresponding to various applications, including (i) large bore with thick and thin detectors for large subjects, (ii) small-bore with thick detectors for applications requiring high-sensitivity, such as cell tracking, (iii) small bore with thin detectors for high-resolution imaging to address the needs of preclinical and paediatric imaging, and (iv) non-cylindrical configuration for prostate and breast scanning and image guidance for therapy planning. The current study aims at evaluating prospectively the imaging performance of Active-PET to provide guidance prior to the actual construction of the prototype. The non-cylindrical configuration provides two major advantages, namely placing the detectors close to the breast and pelvis improves the spatial resolution and sensitivity and makes the device suitable for interventional procedures and treatment planning verification, including online dose monitoring in ion therapy.
2. Materials and methods
We first describe the geometry of Active-PET and its switchable modes along with the specifications of the two different detector modules used in the simulation study. Then, the details of GATE simulations and image reconstruction are described. Finally, the validation and performance evaluation will be discused.
2.1. Geometrical configuration of Active-PET
Active-PET is intended to be a switchable scanner that can be geometrically adapted to respond to users' needs and requirements (see supplemental video (available online at stacks.iop.org/PMB/67/155021/mmedia)). Active-PET has 4 rings, each including two groups of high-resolution and high-sensitivity Lutetium Oxyorthoscilicate (LSO(Ce)) pixelated detector blocks (24 for each group, overall 48 detector modules per ring), one with large pixel pitch (4 × 4 mm2) and crystal thickness (20 mm), referred to as high-sensitivity detector modules (figure 1(f)) and another one with small pixel pitch (2 × 2 mm2) and crystal thickness (10 mm), referred to as high-resolution detector modules (figure 1(g)). Furthermore, each raw of detector modules is connected to a linear motor (actuator) that can displace the detectors forward and backward in the direction of the radial axis and vary the gantry diameter to fit the object to be scanned according to the targeted application. The diameter of the gantry can change from 150 mm to 842 mm to accommodate various subjects from mice to humans. The detectors can accommodate circular, oval, and semi-planar geometries. In this work, five configurations were simulated and investigated: Large gantry with high-resolution and high-sensitivity detectors (gantry diameter = 842 mm) (figure 1(b)), small gantry with high-resolution detectors (gantry diameter = 421 mm) (figure 1(c)), small gantry with high-sensitivity detectors (gantry diameter = 421 mm) (figure 1(d)), switchable partial oval shape gantry (figure 1(e)) where the scanner shape changes during scanning by replacing high-resolution detector modules with high sensitive ones (major axes = 350 mm). To evaluate the concept of online switchable PET scanner, partial PET was defined to be switchable during scanning. This implies that during the first half of the scan, the high-resolution detectors are close to the patient whereas during the second half of the scan, the high-sensitivity detectors get close. The ROOT files of these two modes get merged and reconstructed (Brun and Rademakers 1997). The detailed specifications of each configuration along with the Biograph mCT PET scanner are summarized in table 1.
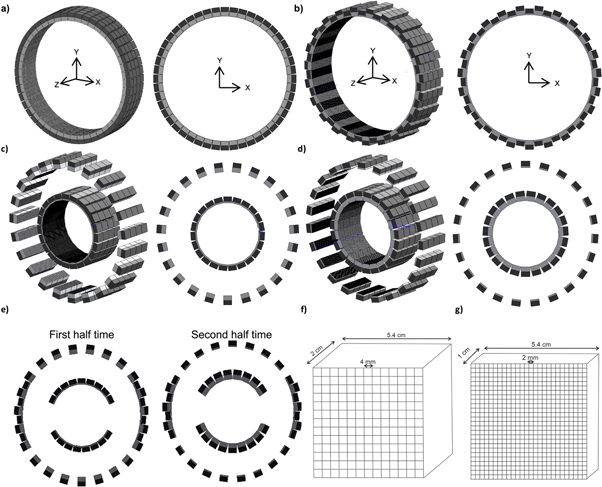
Figure 1. The 3D and 2D graphical representations of (a) the Biograph mCT and Active-PET configurations corresponding to: (b) a large gantry with high-resolution and high-sensitivity detector modules, (c) a small gantry with high-resolution detector modules, and (d) small gantry with high-sensitivity detector modules. (e) The switchable partial-ring PET scanner that can change between two different acquisition modes. (f) The high-sensitivity, and (g) high-resolution detector modules used in Active-PET. The light grey represents the crystal (with different thicknesses) while the dark grey is the photosensor (with a similar thickness).
Download figure:
Standard image High-resolution imageTable 1. Active-PET and Biograph mCT scanner design specifications as implemented in GATE simulations.
| Biograph mCT | Small gantry high-resolution | Small gantry high-sensitive | Large gantry high-resolution high-sensitive | Partial-ring | |
|---|---|---|---|---|---|
| Axial FOV | 218 | 218 | 218 | 218 | 218 |
| Transaxial FOV | 700 | 350 | 350 | 700 | 350 |
| Detector ring diameter | 842 | 421 | 421 | 842 | 421 |
| Crystal pitch | 4 × 4 | 2 × 2 | 4 × 4 | 4 × 4 and 2 × 2 | 4 × 4  2 × 2 2 × 2 |
| Crystal thickness | 20 | 10 | 20 | 20 and 10 | 20  10 10 |
| Number of rings | 4 | 4 | 4 | 4 | 4 |
| Detector blocks per ring (Thick + Thin) | 48 + 0 | 0 + 24 | 24 + 0 | 24 + 24 | 0 + 17  17 + 0 17 + 0 |
| Crystals per block | 13 × 13 = 169 | 26 × 26 = 676 | 13 × 13 = 169 | 169 and 676 | 13×13 =169 |
2.2. Active-PET detector modules
The main idea behind the Active-PET concept lies in the use of two detector modules presenting different characteristics (high-resolution and high-sensitivity) and a dynamic gantry. In Active-PET, thick scintillator crystals with large pixel size are exploited to maintain/boost the sensitivity, whereas thin scintillator crystals with thinner and small pixel size are utilized to retain/enhance the spatial resolution. The schematics of the detectors used in these configurations are illustrated in figures 1(f) and (g).
2.3. Monte Carlo simulations
We employed the GATE (Geant4 application for tomographic emission) simulation package (Jan et al 2004), an advanced open-source software developed by the international OpenGATE collaboration for numerical simulations in medical imaging and radiotherapy. The toolkit is well tested and widely used for emission tomography simulation. We used the Hoffman 3D brain phantom (Hoffman et al 1990) to evaluate the performance of our model with respect to image quality. The physical characteristics, including time and energy window, crystal material, dead time, and TOF resolution of all simulated scanners, except the detectors' size and their arrangements, were kept constant and similar to those of the Biograph mCT scanner (table 1). The readout considered for our simulation includes the energy acceptance window (435–650 keV), the coincidence time window (4.1 ns), and the detector dead time (80 ns). The gap between each detector was assumed to be similar to that of the Biograph mCT. The coincidence time resolution was set to 1.0 ns, the energy resolution to 10% at 511 keV,and the energy window to 435–650 KeV. The GATE toolkit output in our simulation was a ROOT file that stored all the interactions inside the detectors.
2.4. Image reconstruction
CASToR (Merlin et al 2018) was utilized for image reconstruction of cylindrical PET scanner geometries through generating the geometry file (*.geom) from GATE's mac file and then reconstructing using order-subsets expectation maximization (OSEM) with 5 iterations and 21 subsets. To generate a relevant system matrix for the partial-ring geometry, a look-up table (*.LUT) including the geometrical configuration of the detectors was designed for ROOT-based file creation suitable for image reconstruction. The system matrix is calculated by means of single ray tracing. The reconstruction parameters (subsets and iterations) were selected to achieve the highest contrast recovery at minimum background noise following a grid search. For each configuration, PET data were reconstructed using a range of iteration/subset numbers and then picked those producing the highest image quality. We used 5 iterations and 21 subsets on the Biograph mCT scanner, whereas we used 5 iterations and 15/18 subsets, respectively, for the high sensitivity and high-resolution scanners.
2.5. Validation and performance evaluation
The simulation code was previously validated based on NEMA NU2-2007 standards (Perkins et al 2007) and the results described in detail in previous work (Ghabrial et al 2018). In this study, we assessed the performance of the Biograph mCT using the NEMA NU2-2018 updated version of the NEMA standard (Association and NEMA 2018) and compared the results with the proposed scanner configurations as baseline. The performance characteristics of the PET scanner for different scanning modes were investigated through measuring the spatial resolution, sensitivity, noise equivalent count ratio (NECR), count-rate performance, and image quality. The reconstruction used in Ghabrial et al work used filtered back projection implemented in STIR (Thielemans et al 2012), whereas we used OSEM algorithm implemented in CASToR (Merlin et al 2018). Nevertheless, the calculated metrics in both works were in good agreement.
2.5.1. Spatial resolution
Based on NEMA NU2-2018 standards, the spatial resolution was estimated through placing a 22Na point source in two transaxial planes, one in the center of the axial FOV and the other at one eighth of the axial FOV. In each plane, the spatial resolution was measured at two positions (1 cm and 10 cm) in the transverse direction. The activity of the point source was chosen sufficiently low (3.9 MBq) so that the random coincidence rate does not exceed more than 5% of the total count rate. At the two above-mentioned positions, the axial, radial, and tangential resolutions were calculated in terms of full-width-at-half-maximum (FWHM) and full-width-at-tenth maximum (FWTM) of the point spread function (PSF).
2.5.2. Sensitivity
The sensitivity is calculated using a phantom consisting of a 70 cm length polyethylene tube (inner diameter 1 mm, outer diameter 3 mm) filled with 3.9 MBq of 18F. Five aluminum tube shields with the same length but different diameters were designed to simulate attenuation media. They cover the line source progressively to increase photon attenuation. The line source was placed in two radial locations, once at the center of the FOV and one at 10 cm offset from the center of the axial FOV. At each position, five simulations were conducted and the aluminum sleeve was added step by step to increase attenuation. Each simulation continued till 10 000 true coincidences per slice were obtained. The system sensitivity was then measured using the NEMA NU2-2018 standard.
2.5.3. Count rate and noise equivalent count ratio
To estimate the scatter fraction and count-rate performance based on NEMA NU2-2018, a scatter phantom consisting of a 70 cm long polyethylene cylinder and 20 cm diameter was designed. A void cylindrical tube with 6.4 mm diameter and 69 cm length with 45 mm offset from the axial axis of the cylinder was considered. A 69 cm long polyethylene plastic tube filled with 45 kBq ml−1 of 18F was considered as a line source and placed in the void space of the scattering phantom. The true, random, scatter and noise equivalent count rates (NECR) were calculated accordingly.
2.6. Mechanical engineering design aspects
A linear actuator is an electric jack that converts circular motion to linear movements. Actuators can alternate between forward and backward movement by changing the polarity of the motor. The power and speed of movement of an actuator depends mainly on its gearbox. As a rule of thumb, fast speed motors have less power and less accuracy and vice versa.
The length of the screw and shaft (called stroke) is one of the basic differences between actuators available from different vendors as it can change from 50 mm to 450 mm. According to our design, an actuator with 350 mm stroke was adopted. By assuming the weight of each detector module to be around 1.5 kg for each array of detectors, we need an actuator that supports pulling and pushing with 60 Newton for four detector modules.
2.7. Electronical engineering design aspects
The front-end electronics should be chosen in a way to minimize the weight and size as much as possible. The currently available actuators are able to pull and push a the force of 4k to 6k Newtons, which is more than enough for any kind of PET detector.
Using the flat flexible cable to transmit the photomultiplier signal from the detectors to processors would be ideal for the suggested scanner. These flat wires are widely used for controlling moveable objects (e.g 3D printers, cutter plotters, computer numerical control (CNC) machines,...) and they are resistant to folding/bending. Flat cables are easy to use and do not need any specific equipment but they can decrease the signal-to-noise ratio. To address this issue, Bieniosek et al suggested transmitting signals by electro-optical fibers, which are less sensitive to noise and are not as heavy as conventional coaxial cables (Bieniosek and Levin 2015).
3. Results
3.1. Validation
The performance evaluation of the simulated Biograph mCT according to NEMA NU2-2007 standard exhibited good agreement between the measured and simulated spatial resolution, sensitivity, and NECR (Ghabrial et al 2018). The sensitivity and spatial resolution bias at the center of the axial FOV were around 0.5% and 13%, respectively. The NECR plot extracted from GATE followed perfectly the experimentally measured NECR.
3.2. Active-PET performance evaluation
Figure 2 shows the sinograms of three-point sources in the central plane located at 1 mm and 10 mm off center along the Y-axis and 10 mm off center along the X-axis reflecting the simulation of all PET geometrical configurations. The sinograms provide insight regarding the performance of the different configurations.
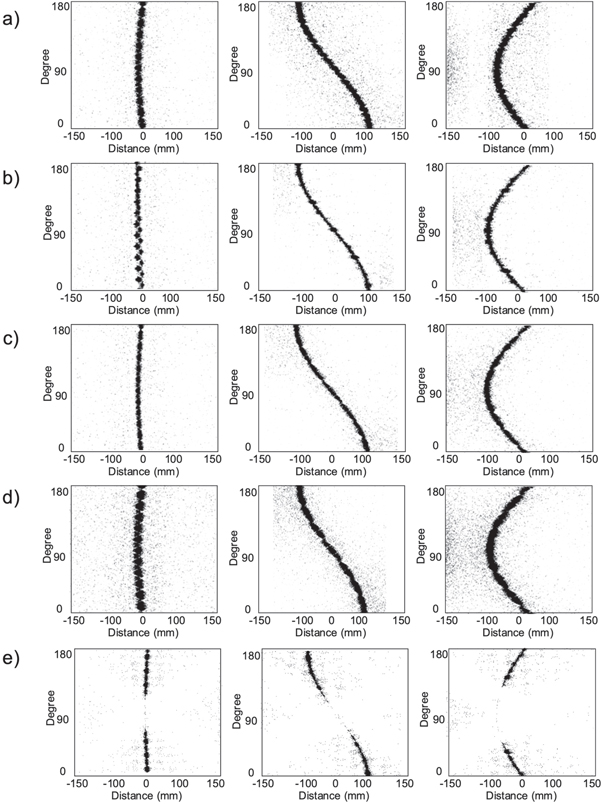
Figure 2. The simulated sinograms corresponding to the geometry of: (a) the Biograph mCT, (b) large gantry with high-sensitive and high-resolution detector modules, (c) small gantry with high-resolution detectors, (d) small gantry with high-sensitive detectors and (e) partial-ring PET. The first and third columns correspond to a point source with 1 cm and 10 cm offset from the center of the FOV and in the Y-direction. The second column corresponds to a point source with 10 cm offset from the center of the FOV along the X-axis.
Download figure:
Standard image High-resolution imageThe spatial distribution of the underlying signals, intensity, and uniformity of the sinograms are related to the spatial-resolution, sensitivity, and geometrical aspects. The widest and thinnest sinograms are associated with scanners with small bore and high-sensitivity and high-resolution detector modules, respectively. The partial-ring PET illustrates a gap/uniformity in the sinogram corresponding to the lack of detector modules on two sides of the scanner.
The estimated sensitivity for the different configurations at the center of the FOV and at 10 mm off-center are presented in figure 3. For all configurations, the sensitivity reaches its peak at the center of the FOV and starts to decrease towards the corners of the FOV. At the center of the FOV, the highest sensitivity (15.98 kcps MBq−1) was achieved by a small gantry and high-sensitivity detector, while the configuration with a small gantry and high-resolution had the smallest sensitivity (6.12 kcps MBq−1). The scanner equipped with high-sensitivity and high-resolution detectors has 16% sensitivity less than the Biograph mCT (7.31 versus 8.78 kcps MBq−1).
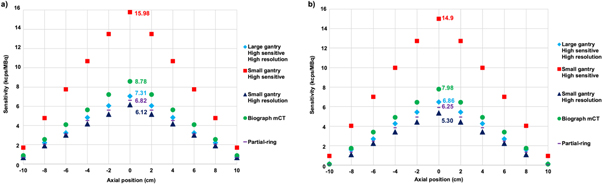
Figure 3. The calculated sensitivity along the z-axis at: (a) the CFOV and (b) 10 cm offset from the CFOV for all geometrical configurations including the Biograph mCT.
Download figure:
Standard image High-resolution imageThe tangential, radial, and axial spatial resolution for the full-ring cylindrical configurations and partial-ring configuration are reported in tables 2 and 3, respectively. The results support well the observations from the sinograms where the scanner with a small gantry and thin crystals (high resolution detectors) showed the smallest tangential, radial, and axial spatial resolution (2.2 mm, 2.3 mm, 2.5 mm FWHM, respectively). The large gantry (with high-sensitivity and high-resolution blocks) outperformed by 10%, 10%, and 8.5% the Biograph mCT scanner in terms of tangential, radial, and axial spatial resolution, respectively. The small gantry with high-sensitivity detectors showed a spatial resolution very close to the Biograph mCT at the center of the axial FOV (3.5 mm versus 3.7 mm, 3.6 mm versus 3.8 mm, and 3.5 mm versus 3.4 mm FWHM for tangential, radial, and axial directions, respectively). The partial-ring PET scanner outperformed the mCT scanner in terms of axial spatial resolution at the center of the FOV (2.9 versus 3.5 mm FWHM).
Table 2. Spatial-resolution results for three different configurations along with the Biograph mCT scanner. The FWHM and FWTM were reported for tangential (T), radial (R), and axial (A) directions (in mm) for a point source located at 1 cm and 10 cm distances from the CFOV.
| Biograph mCT | Large gantry high-resolution high-sensitive | |||||||||||
|---|---|---|---|---|---|---|---|---|---|---|---|---|
| FWHM (mm) | FWTM (mm) | FWHM (mm) | FWTM (mm) | |||||||||
| Distance (mm) | Tangential | Radial | Axial | Tangential | Radial | Axial | Tangential | Radial | Axial | Tangential | Radial | Axial |
| 10 | 3.7 | 3.8 | 3.5 | 7.5 | 7.5 | 7.7 | 3.3 | 3.4 | 3.2 | 7.2 | 7.3 | 7.5 |
| 100 | 4.2 | 4.7 | 5.4 | 8.2 | 8.6 | 10.3 | 3.9 | 4.4 | 5.1 | 7.8 | 8.2 | 9.9 |
| Small gantry high-sensitive | Small gantry high-resolution | |||||||||||
| FWHM (mm) | FWTM (mm) | FWHM (mm) | FWTM (mm) | |||||||||
| Tangential | Radial | Axial | Tangential | Radial | Axial | Tangential | Radial | Axial | Tangential | Radial | Axial | |
| 10 | 3.5 | 3.6 | 3.4 | 7.3 | 7.4 | 7.6 | 2.2 | 2.3 | 2.5 | 3.6 | 3.8 | 4.2 |
| 100 | 4 | 4.5 | 5.2 | 8 | 8.5 | 10.1 | 2.3 | 2.5 | 3.8 | 6.4 | 6.6 | 7.3 |
Table 3. Spatial resolution results for partial-ring configurations. The FWHM and FWTM were reported for tangential, radial, and axial directions (in mm) for a point source at 1 cm and 10 cm distance from the CFOV.
| Distance (mm) | Partial-ring PET | |||||
|---|---|---|---|---|---|---|
| FWHM (mm) | FWTM (mm) | |||||
| Tangential | Radial | Axial | Tangential | Radial | Axial | |
| 10 | 3.7 | 3.7 | 2.9 | 7.2 | 7.3 | 7.3 |
| 100 | 4.1 | 4.6 | 4.8 | 8.1 | 8.5 | 9.5 |
Figure 4 depicts the plots of prompt, true, random, and scatter counts for the different configurations. Figure 5 shows the NECR carve for the different configurations, supporting the results obtained for the sensitivity.
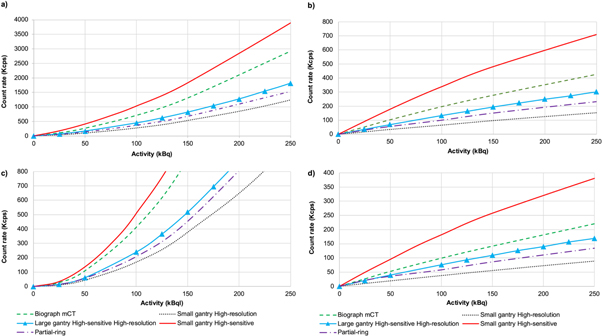
Figure 4. Plots of count rates showing: (a) prompts, (b) trues, (c) randoms, (d) scatter for the simulated configurations of PET scanners compared with the Biograph mCT.
Download figure:
Standard image High-resolution image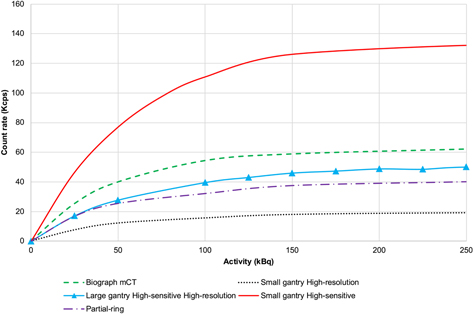
Figure 5. NECR performance for the simulated configurations of the Active-PET scanner compared to the simulated mCT PET scanner.
Download figure:
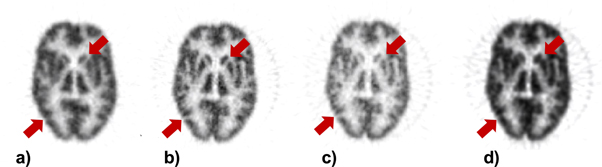
Standard image High-resolution imageThe reconstructed images of the Hoffman 3D brain phantom for the different configurations are illustrated in figure 6. The configuration with a large gantry (high-sensitivity and high-resolution detector modules) showed better image quality providing the highest anatomical details preservation relative to the Biograph mCT. As an example, the Caudate and Putamen regions are more distinguishable from each other and other regions. The scanner with a small gantry and high-resolution detector modules shows better image quality compared to the one with high-sensitivity detector modules, while it may lead to underestimation of radiotracer uptake (the red arrow in the occipital lobe).
Figure 6. Reconstructed images of the Hoffman 3D brain phantom corresponding to the geometry of: (a) the Biograph mCT, (b) configuration with large gantry including high-sensitive and high-resolution detectors (c) configuration with small-gantry and high-resolution detectors, (d) configuration with small gantry and high-sensitivity detectors. The red arrows indicate two regions presenting different uptake patterns for image obtained on each scanner.
Download figure:
Standard image High-resolution image
4. Discussion
High spatial resolution and high sensitivity can minimize the partial volume effect and noise characteristics, especially when scanning small objects and when the scanning time is short or the injected activity is small. In the field of nuclear medicine imaging, especially in PET, there is always a desire to have both high sensitivity and high spatial resolution, while the tradeoff between these two parameters makes the realization of this goal barely feasible. One of the major reasons for this limitation is the fixed configuration of PET scanners from their first invention time in the 1970s. Furthermore, in recent years, the success of dedicated organ-specific PET scanners in providing high sensitivity/high spatial resolution raised the desire of using these categories of PET scanners, although having several scanners in one center is costly and space-consuming (González et al 2018, Catana 2019). In this study, we attempted to address the above-mentioned tradeoff/limitation by designing a new PET scanner with variable gantry size and two types of detector modules that can adapt its geometry based on the users' needs. Our suggested multipurpose PET scanner (Active-PET) can switch between different geometrical modes to provide systems dedicated for brain, axilla, breast, prostate, whole body, preclinical, cell tracking, and pediatrics imaging, as well as image guidance for interventions, without increasing manufacturing cost. Active-PET is able to get the detectors close to objects to increase the solid angle coverage of the scanner. A small bore size leads to the reduction of the non-collinearity effect whereas using a thin scintillator decreases the parallax error.
Zein et al reported a spatial resolution degradation of 0.49 mm FWHM in the axial direction at 1 mm off-center of the transaxial FOV and 1% sensitivity reduction relative to the Biograph Vision PET scanner (Zein et al 2021). Using detectors with thick (10 mm) and thin (2 mm) monolithic scintillators in a preclinical PET scanner enabled to improve the spatial resolution (0.7 mm FWHM) and absolute sensitivity (3.7%) in comparison with conventional PET scanners with an average crystal thickness (6 mm) (Sanaat et al 2020a). The oval shape scanner presented by Huber et al achieved a pick absolute sensitivity of 25.54 kcps MBq−1 at the center of the FOV and transverse spatial resolution of 4 mm FWHM at 1 cm (Huber et al 2006, 2011). In this scanner, the elliptical shape of the gantry has a 45 cm and 70 cm minor and major axes, respectively, and a total of 80 detectors. Although this scanner showed better sensitivity than our partial-ring PET, its spatial resolution is around 8% less than Active-PET. The comparison between this model and Active-PET highlights the influence of the distance between the two scintillation detectors' array thickness, and void regions in the scanner.
The non-cylindrical configuration with some adjustments provides access to the subject (void areas without the detectors) from left and right sides. Such PET scanners are required for online ion (proton) therapy verification. Partial angular coverage PET systems would offer direct access/irradiation of the proton beam to the target subject, while the proton range could be instantly verified by the PET detectors. Evidently, the beam should not encounter obstacles (detectors) in its path when entering into the patient from the left or right side. This can be achieved by adding another degree of freedom in the Z-axis (by adding rails parallel to this axis) to extend the axial FOV virtually.
In Li et al study, the absolute sensitivity in whole-body mode and brain mode is 4.2% and 9.2% for a 22Na point source at the center of the FOV. The spatial resolution for the same point source at the center of FOV was found to be 4 mm and 3.9 mm FWHM for whole-body and brain modes, respectively. In comparison with Active-PET, the abovementioned scanner does not have different detector modules and is not able to switch to various geometrical shapes, such including the oval geometry. Moreover, the transformation time takes 1.5 h, which is carried out manually (Li et al 2007).
We assume that Active-PET uses a similar configuration as the Biograph mCT in terms of number of crystals, photodetectors, electronics, ..etc for imaging, and other mechanical parts for bed motion and other components (ignoring the lower amount of crystals used on Active-PET compared to the Biograph mCT, since half of the detectors have half crystal thickness). Hence, the main components' cost would not change, the only additional cost would be for linear motors plus the electronics. According to our estimates, its cost would be approximately equivalent to two detector modules with a large crystal. We appreciate that the fabrication cost for Active-PET would be higher than a conventional scanner. Yet, considering the multipurpose application of this scanner and space requirements, the overall cost will be compensated.
This work suffers from three main limitations. The first one is the lack of a dedicated reconstruction method for the switchable partial-ring scanner, wherein we considered the system matrix of the partial high-sensitivity scanner. This would lead to suboptimal image reconstruction since the system matrix would not correctly reflect the highest resolution that can be achieved. An optimized reconstruction algorithm would further enhance the performance of this configuration. We simply applied conventional reconstruction methods for the cylindrical geometry with some approximations. The second limitation is the non-uniformity in reconstructed images for the scanner with mixed high-resolution and high-sensitivity detector modules owing to differences in detector sensitivity. Although in the Hoffman 3D brain phantom images, we did not observe severe non-uniformities, it could be more visible in the uniform phantom. The last limitation is the lack of experimental evaluation to confirm the simulation results.
5. Conclusion
We simulated and evaluated a new PET scanner design, referred to as Active-PET, which unlike conventional PET scanners contains two types of high-resolution and high-sensitivity detector modules whose position can change depending on the application. By using the linear motor behind each array of detector modules, the gantry size/diameter can be adapted. Active-PET can cover a wide range of applications, such as brain, axilla, breast, prostate, whole-body, preclinical and pediatric imaging, as well as cell tracking, and image guidance for interventions.
Acknowledgments
This work was supported by the Eurostars program of the European commission under grant E! 114021 ProVision and the Private Foundation of Geneva University Hospitals under Grant RC-06–01.