
Abstract
Objective. Experimental determination of beam quality kQ factors for two types of Farmer ionization chambers, NE2571 and IBA FC65-G, in a scanned proton beam for three nominal energies (140 MeV, 180 MeV and 220 MeV) based on water calorimetry. Approach. Beam quality correction factors were determined comparing the results obtained with water calorimetry and ionometry. Water calorimetry was performed to determine the absorbed dose at a depth of measurement in water of 5 g cm−2, limited by the extension of the calorimeter glass vessel used. For the ionometry, two chambers of each type were included in the study. The ionization chambers were calibrated in terms of absorbed dose to water in 60Co at the Swedish Secondary Standard Dosimetry Laboratory, directly traceable to the BIPM, and were used according to the IAEA TRS-398 Code of Practice. Main results. The kQ values determined in the present work have been compared with the values tabulated in TRS-398 and its forthcoming update and also with those obtained in previous water calorimetric measurements and Monte Carlo calculations. All results were found to agree within the combined uncertainties of the different data. Significance. It is expected that the present work will serve as an experimental contribution to kQ-factors for the two chamber types and three scanned proton beam qualities used.
Export citation and abstract BibTeX RIS

Original content from this work may be used under the terms of the Creative Commons Attribution 4.0 licence. Any further distribution of this work must maintain attribution to the author(s) and the title of the work, journal citation and DOI.
1. Introduction
The recommended method to obtain the beam quality correction factor, kQ,Q 0 , for a user's ionization chamber is by a direct determination of the absorbed dose to water calibration coefficient at the two beam qualities Q and Q0, each under reference conditions, see IAEA TRS-398 (Andreo et al 2000). However, at present there is no Primary Standards Dosimetry Laboratory (PSDL) providing such direct reference calibrations for proton beams, and the kQ,Q 0 factors supplied by dosimetry recommendations are still based on chamber calibrations in 60Co as the reference beam quality Q0. In this case, the beam quality factor is usually denoted kQ . Furthermore, due to the limited amount of both experimental data and Monte Carlo calculated values, these beam quality factors are still in the forthcoming updated version of IAEA TRS-398 based on analytical calculations using the expression in TRS-398 proposed by Andreo (1992).
Even if some experimental determinations of kQ factors in proton beams have been done over the years (see Renaud et al 2020), the amount of data is rather limited and even more so in scanned proton beams (Gagnebin et al 2010, Medin 2010, Sarfehnia et al 2010).
In the present work, experimental beam quality correction factors, kQ , for three qualities of proton scanned beams are determined comparing the absorbed dose to water determined with a sealed water calorimeter with the dose that would be determined following IAEA TRS-398 using two NE2571 and two FC65-G Farmer-type ionization chambers. These have been calibrated in terms of absorbed-dose-to-water in 60Co gamma rays at the Swedish Secondary Standards Dosimetry Laboratory (SSDL), which is traceable to the BIPM.
2. Material and methods
2.1. Sealed water calorimeter
The main part of the water calorimetry equipment used in the present project was constructed at the department of medical radiation physics in Malmö, Sweden, and used both in a passive scattered clinical proton beam and in an experimental scanned proton beam for determinations of ionization chamber beam quality correction factors, kQ , (Medin et al 2006, Medin 2010). The design closely follows the Canadian National Research Council (NRC) sealed water calorimeter (Seuntjens and Palmans 1999, Medin et al 2004) and a detailed description can be found in those papers.
A new glass vessel (see figure 1) was purchased from the NRC for the present project in order to simplify the procedure and make measurements at the Swedish Skandion proton clinic more efficient since it is permanently sealed and does not need to be re-filled on multiple occasions in order to obtain a reliable determination of the absorbed dose. Previous work (Medin et al 2006, Medin 2010) had been conducted with a glass vessel which was not permanently sealed. The presence of even very small amounts of organic impurities (more than a few ppb) will affect the N2 aqueous system used in the previous and present work, and one major advantage of the new permanently sealed glass vessel is that it is more stable over time after it has been properly cleaned, filled, saturated with N2-gas, and sealed, a procedure which was performed at the Canadian PSDL (NRC).
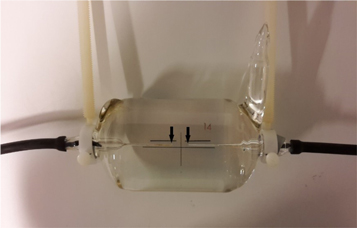
Figure 1. The glass detection vessel with the thermistor probes (indicated by arrows) aligned at the centre.
Download figure:
Standard image High-resolution imageThe temperature increase due to irradiation is measured at the centre of the cylindrical glass vessel filled with high-purified water (outer diameter = 67.5 mm, wall thickness = 1.16 mm) using two thermistor probes (shown in figure 1) connected to a Wheatstone bridge circuit. Measurements are performed at 4 °C in order to avoid problems associated with convective heat transfer (Seuntjens et al 2000).
2.2. Ionization chambers
Two cylindrical ionization chamber types have been used in the present work: the NE2571 Farmer chamber (Phoenix Dosimetry Ltd., Sandhurst, UK), and the waterproof FC65-G Farmer chamber (IBA Dosimetry, Schwarzenbruck, Germany). Two chambers of each type were used, thus, in total four chambers. Both chamber types have a graphite wall and a central electrode of aluminium. The cavity length for the NE2571 chamber is 24.1 mm, the inner cavity radius is 3.2 mm, and its wall thickness is 0.065 g cm−2. The nominal cavity volume is 0.69 cm3 according to the manufacturer. The corresponding dimensions for the FC65-G chamber are 23.1 mm, 3.1 mm, 0.073 g cm−2 with a thin layer of plastic on its outside. Its nominal cavity volume is 0.65 cm3 according to the manufacturer. The two FC65-G chambers were operated at a polarizing potential of −400 V on the outer electrode, thus collecting negative ions on the central electrode. The corresponding polarizing potential for the two NE2571 chambers was −350 V.
The ionization chambers were positioned on the central axis of the proton beams with their axis at the reference depth of 5 g cm−2.
2.3. Experimental setup
Measurements were performed using the experimental beam line at the Skandion clinic in Uppsala at three nominal proton energies (140 MeV, 180 MeV and 220 MeV). The experimental beam line includes the same type of proton treatment head (nozzle) as the two clinical gantries but without the rotational gantry construction—a horizontal beam line is used instead (see figure 2).
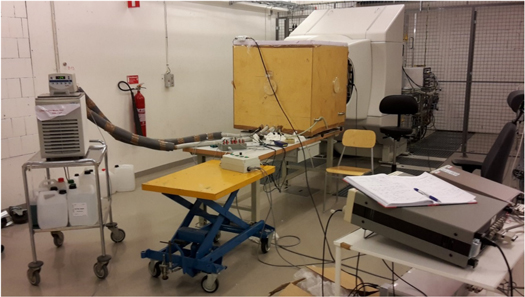
Figure 2. The water calorimeter set up in front of the treatment head (nozzle) in the experimental beam line.
Download figure:
Standard image High-resolution imageThe beam output was calibrated before each set of measurements (typically consisting of 10 separate irradiations) by updating the scanning controller with the room temperature and pressure. The internal transmission monitor signal is converted to a number of protons and that conversion is established by measuring the monitor reading corrected for room atmospheric conditions. The signal from the internal transmission ionization chamber IC2 was noted for each irradiation, but the functioning of the IBA system makes it unnecessary to normalize the result with this signal due to the calibration of output via the scanning controller. Therefore, unnormalized absorbed doses were used.
The water equivalent depth of measurement was 5.0 g cm−2 for the three energies, which corresponded to average proton energies of about 110 MeV, 157 MeV and 201 MeV at that depth in water, obtained from the corresponding measured residual ranges (Rres = 9.38 g cm−2, 17.30 g cm−2 and 26.28 g cm−2) and ICRU 90 stopping-power values (Seltzer et al 2016). The choice of a measurement depth of 5.0 g cm−2 was due to the cylindrical dimension of the glass vessel used and it may be noted that the update of TRS-398 will recommend that the reference dosimetry of scanned proton beams be performed at the depth of 1 g cm−2 or 2 g cm−2, depending on nominal energy. The implications of this recommendation on the present work are discussed in section 5 below.
A field-size of 10 × 10 cm2 at an average virtual SSD of 220.3 cm (SSDx = 184.3 cm, SSDy = 221.7 cm) was used. The beam from the cyclotron at the Skandion clinic can be considered to be continuous since the time between pulses is very short compared to the ion collection time in the ionization chamber and to the signal acquisition time in the water calorimeter. The absorbed dose for each energy was delivered in a single scan with a spot-scanning technique depositing 1.5 MU per spot with a spot spacing of 2.5 mm, a process that takes about 15 s. The approximately Gaussian shaped proton beams have the FWHM values given in table 1. The average of FWHMx and FWHMy has been used as input in the heat transfer calculations described in section 4.1. To determine the FWHM a single spot was shot on a Lynx PT detector manufactured by IBA Dosimetry, and the resulting images were analysed using the myQA software from the same company.
Table 1. FWHM (in mm) of the proton scanned beams at the depth of measurement in water (5.0 g cm−2).
| 140 MeV | 180 MeV | 220 MeV | |||
|---|---|---|---|---|---|
| 9.4 | 10.5 | 8.0 | 8.8 | 7.1 | 7.2 |
In order to ensure a constant heat defect (see section 4.1) throughout the measurements, the calorimeter was pre-irradiated before the first measurement. During the pre-irradiation of the water, small concentrations of H2O2, H2 and O2 are produced, which then remain essentially unchanged with further absorbed dose (Klassen and Ross 2002). The result from previous computer simulations of the heat defect has been used to ensure a large enough pre-dose (over 100 Gy) to the N2-gas saturated water (Medin et al 2006).
The water calorimeter was irradiated during 15 s, which corresponds to a single scan as described above, delivering around 2.3 Gy at the depth of measurement. Each irradiation was preceded by a 120 s pre-irradiation period and proceeded by a 120 s post-irradiation period with the beam turned off in order to determine the temperature rise caused by irradiation (see section 3.1). The same irradiation time and dose rate were used for all the ionization chamber measurements. When switching to ionometry measurements, the 4 °C water in the tank was replaced with water at room temperature.
2.4. Ripple effect
In a scanned proton beam, lateral ripple effects due to spot misalignments can lead, especially at shallow depths, to non-negligible uncertainties and fluctuations in the response of a detector. These spot misalignment effects are usually systematic because of the limited resolution of the wire chambers or strip detectors commonly used for determining the spot position. At the Skandion clinic where the present study was conducted, the maximum misalignment is about 0.3 mm, but in some systems it can be up to 0.5 mm and AAPM report 224 (Arjomandy et al 2019) gives a tolerance of 1 mm. In order to investigate the possible influence from this effect, random offsets of the spot positions were simulated for an integrating area representing a Farmer chamber according to figure 3.
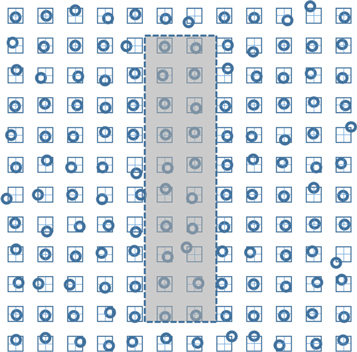
Figure 3. Simplified simulation of random offsets of the spot positions. The small squares are the nominal (planned) spot positions spaced 2.5 mm in both scan directions. The circles are the spot positions with a random offset distributed rectangularly in both directions with a half-width of 0.3 mm. The grey shaded area is the projected area perpendicular to the beam direction of a Farmer type ionization chamber with a diameter of 6 mm and a length of 24 mm. The circular lateral profile of a single spot was assumed to be Gaussian with a FWHM of 8 mm and the contribution to dose was integrated over the shaded area, both for the nominal spot positions and the randomized positions. In reality, the field simulated is much larger (200 mm × 200 mm) in order to ensure lateral secondary proton equilibrium.
Download figure:
Standard image High-resolution imageThe ratio of the integrated dose for the randomized spot positions and for the nominal spot positions was calculated and this was repeated a hundred times with different random samplings so as to determine a standard deviation of this ratio. The exercise was then also repeated for a 1 mm × 1 mm integrating area representing the effective area over which the calorimeter samples a signal.
3. Theory
3.1. Water calorimetry
The theoretical basis of the data analysis has previously been described in Medin (2010) but is reproduced here for completeness.
The absorbed dose to water at a beam quality Q, Dw,Q , is determined according to the equation:

where cw is the specific heat capacity of water, ΔTw is the temperature rise due to irradiation and k is the product of correction factors that are all close to unity:

which are discussed in section 4.1.
The temperature rise ΔTw is determined using two high precision thermistors. The data obtained from a calorimeter run consist of the measured potential difference, VA−VB, between two arms in a Wheatstone bridge operated in AC-mode (1.0 V, 4.5 Hz). A variable resistor and capacitor are used to balance the resistive and capacitive impedance in the bridge, respectively. The output from the bridge circuit is monitored during a pre- and post-irradiation period (in the present work 120 s each), and these drifts are then extrapolated to the mid-time of the irradiation to give the offset, VA−VB, caused by the irradiation. The change in bridge voltage is then converted to the corresponding change in thermistor resistance, using a theoretical model of the bridge circuit. Finally, the change in thermistor resistance is converted to the change in temperature, ΔTw, using the thermistor sensitivity measured from a calibration of the thermistor probes which had been performed at the Canadian PSDL (NRC) before the delivery of the sealed glass vessel.
3.2. Ionometry
When an ionization chamber is calibrated in 60Co, the calibration beam quality index Q0 is usually omitted in the equation from IAEA TRS-398 (Andreo et al 2000) and the absorbed dose to water Dw,Q is given by

where MQ is the chamber reading corrected for influence quantities, ND,w is the calibration coefficient of the ionization chamber in terms of absorbed-dose-to-water, and kQ is the beam quality correction factor that corrects ND,w for the differences between the reference beam quality at the standards dosimetry laboratory (60Co) and the user's beam quality (Q).
kQ is calculated using the analytical equation in TRS-398

where (sw,air ) are the stopping power ratios water/air, p the chamber perturbation correction factors, and Wair the mean energies expended to produce an ion pair in dry air for the beam qualities Q and 60Co, respectively.
One of the quantities influencing MQ in equation (3) is the correction for ion recombination in the ionization chamber, ks. IAEA TRS-398 provides three options based on the two-voltage-method: continuous beam, pulsed beam and pulsed-scanned beam. The beam originating from the IBA cyclotron at the Skandion clinic can be considered as a continuous beam in this context, as discussed in section 4.2.
When the absorbed dose is measured with water calorimetry, as both methods must yield the same absorbed dose to water, it can be written that

and the beam quality correction factor, kQ , can be obtained directly using:

4. Basic data and correction factors
4.1. Water calorimetry
The same value for the specific heat capacity of water, cw, was used as in the previous work by Medin et al (2006) and Medin (2010). At 4 °C, cw is equal to 4.2048 J g−1 K−1 (Osborne et al 1939). Since the value was quoted to five significant figures in the original work, it would indicate an uncertainty of the order of 0.01%. An updated analysis was discussed in Medin et al (2006) and based on this, an uncertainty of 0.05% was adopted in Medin (2010) and the same uncertainty estimate has been used in the present work.
The correction factor for conductive heat transfer, kc, from the irradiated glass vessel, thermistor probes, and also due to a varying local dose profile was calculated using complete 4D simulations of the heat transport with the COMSOL Multiphysics® 7 software package (time dependence and three special dimensions). Thermal and physical parameters of water and glass (Pyrex) were obtained from Palmans (2000) except cw which was taken as above to be consistent with the value used in the absorbed dose determination. In order to perform the heat transfer calculations, the ratio of the absorbed dose in glass to that in water, Dglass/Dw (= sglass,w, assuming unperturbed proton fluence), has to be known. This was estimated using stopping power values from ICRU 49 (Berger et al 1993) for Pyrex glass and ICRU 90 (Seltzer et al 2016) for water; the latter is based on a value of 78 eV for the mean excitation energy, the I-value, which is 4% higher than the value in ICRU 49. The residual range was converted to an average proton energy (110 MeV, 157 MeV and 201 MeV, respectively), yielding sglass,w ratios of 1.21, 1.20 and 1.20.
The irradiation conditions described in section 2.3 were fully simulated in 4D, including 10 repeated irradiations of the calorimeter and delay drift times between consecutive irradiations (120 s post- and pre-irradiation times). Since the temperature at the position of each thermistor is affected not only by short term effects (heat originating from the glass probes) but also by long-term effects (heat originating from the glass walls, reaching the thermistors after several minutes), it is important to perform the heat transfer calculations according to the same time sequence as the measurements were conducted. Depending on the irradiation conditions, kc may vary with the accumulated heat and should be evaluated for each single irradiation in a set of measurements. The correction factor kc was, as in a previous investigation (Medin 2010), found to be stable for at least up to 10 consecutive irradiations (equal to normal operation of the calorimeter during the measurements in the present work), and does not vary significantly from 0.999. The average value for the 10 consecutive irradiations for that previous analysis is given in table 2 and used for the three proton energies since the effect did not vary significantly between the energies used. The uncertainty given in the table refers to the estimated standard deviation (k = 1) for each kc used in the determination of Dw and does not only reflect the variation of kc between different irradiations.
Table 2. Correction factors used in the calculation of absorbed dose based on water calorimetry. The uncertainties quoted in the last row correspond to the relative standard uncertainty (k = 1). The uncertainties of kv = 1.000 and kt = 1.000 are considered to be negligible.
| Energy (MeV) | Rres (g cm−2) | kc | kp | kdd | kρ | 1/(1 −kHD) |
|---|---|---|---|---|---|---|
| 140 | 9.38 | 0.999 | 0.9967 | 0.998 | 1.0000 | 1.001 |
| 180 | 17.30 | 0.999 | 0.9988 | 0.998 | 1.0000 | 1.001 |
| 220 | 26.28 | 0.999 | 0.9990 | 0.999 | 1.0000 | 1.001 |
| unct: | 0.1% | 0.05% | 0.3% | 0.05% | 0.4% |
The correction for convective heat transfer, kv, is set to unity since it is generally accepted to be negligible when the calorimeter is operated at 4 °C (see Seuntjens et al 2000).
The factor kp is a correction for the perturbation effects of the glass vessel on the radiation field and it was experimentally determined at the depth of calorimetric measurements using a small RK ionization chamber. Since the new glass vessel is permanently sealed, the older version (see Medin 2010) was used for these measurements. It has an opening at each end and could therefore be placed over the RK chamber, which was fixed to a stem on a plate resting firmly at the bottom of the water tank. The glass vessel was secured in place with threads holding it in a stable position. Repeated irradiations were done for the three proton beam energies. The glass vessel was then carefully removed without affecting the position of the ionization chamber and irradiations were repeated. The ratio of ionization chamber readings without and with the presence of the glass vessel gives the correction factor and is provided in table 2. The difference in glass wall thickness between the new glass vessel and the old one is on average 0.16 mm of Pyrex. By considering this difference and the mean energy of the proton beam at the depth of the glass wall, an estimate based on total proton stopping powers from ICRU 49 (Berger et al 1993) yields an energy difference after passing the two different glass walls of 0.2 MeV or less. The effect of this energy difference on the determined value of kp is within the estimated uncertainties.
The factor kdd corrects for the lateral non-uniformity of the radiation field and was determined with a Lynx detector from IBA Dosimetry, consisting of a fluorescent screen in a light-proof concealing. The results were analysed using the myQA software, also from IBA Dosimetry. These measurements were performed in air with a 50 mm block of Solid Water in front of the Lynx detector. Additionally, measurements were also done in the calorimeter water tank using EBT3 radiochromic films (Gafchromic®) at the depth of calorimetric and ionometric measurements (5 g cm−2). The film was placed facing the beam at the front of a 5 cm thick PMMA block which was used to secure the film at a stable position for each irradiation. The films were scanned 24 h after irradiation and results were used to confirm the field homogeneity determined with the Lynx detector. The uncertainty was estimated by evaluating kdd not only at the position of the two thermistors but also over an area covering the thermistor position ±2 mm in each orthogonal direction, i.e. using a square with side 4 mm. These results were averaged for each beam and compared to the result obtained at a central positioned square of the same dimensions.
The factor kρ corrects for the difference in water density between 4 °C and room temperature, and requires knowledge of both the change in density with temperature and the slope of the depth-dose distribution at the depth of measurement for the beam quality used. The density at 4 °C is 0.18% higher than the density at 20 °C, i.e. the depth of measurement should be multiplied with a factor of 1.0018, which yields the following factors with which the calorimetric results should be multiplied; 140 MeV: 0.9997, 180 MeV: 0.9994, and 220 MeV: 0.9990. All these factors are within the uncertainty of each determined depth-dose distribution but have been applied in the interest of stringency.
The factor kt takes into account the possibility that radiation could produce changes in thermistor response that remains after the radiation is turned off. This factor is assumed to be unity since investigations by Ross et al (2000) indicated that the level of absorbed dose which was used in the present work does not affect the response of the thermistors.
The factor 1/(1-kHD) corrects for the chemical heat defect, i.e. the contribution of radiation-induced chemical reactions to the measured radiation-induced temperature rise. A detailed calculation of this effect has been performed in a scattered pulsed proton beam with similar irradiation properties regarding the absorbed dose and pre-irradiation of the N2-gas saturated water (Medin et al 2006). A minor non-zero heat defect was determined in that work, and was attributed to the fact that a steady state of products affecting the heat defect is impossible to achieve at the absorbed dose levels employed if the LET reaches a sufficiently high value. Since the absorbed dose and LET properties of the present beams are comparable, the same small non-zero heat defect has been adopted in the present work. A conservative uncertainty of 0.4% has been assigned to the value of kHD for pure N2-gas saturated water to take into account the experimental difficulties in reducing the level of impurities sufficiently when creating a 'pure water system', and the use of previous detailed simulations for a scattered proton beam with similar physical properties.
The uncertainty in the thermistor sensitivity is estimated to be 0.2% (k = 1), as applied in Medin et al (2006).
4.2. Ionometry
The ionization chambers included in the present study had been calibrated in terms of absorbed-dose-to-water in 60Co (beam quality Q0 ) at the Swedish SSDL (SSM) traceable to the BIPM; their calibration coefficients are given in table 3. The correction factor for non-uniformity of the radiation field at the position of the ionization chambers kdd,IC was 0.998 for the 140 MeV beam, 1.000 for the 180 MeV beam, and 1.000 for the 220 MeV beam. The uncertainty was found to be 0.2%, estimated by moving the square representing the chamber volume (22 mm length and 6 mm width) in the myQA software 2 mm in vertical and lateral directions respectively, which due to the larger volume-averaging effect of the ionization chamber resulted in a smaller value than for the thermistor probes. All the stated uncertainties correspond to the estimated standard uncertainty (k = 1).
Table 3. Calibration coefficients measured in 60Co at the Swedish SSDL for the Farmer type ionization chambers included in the study. The stated uncertainty from the standards laboratory is 0.5% (k = 1).
| Chamber | ND,w (mGy nC−1) |
|---|---|
| FC65-G #3049 | 48.09 |
| FC65-G #3171 | 48.12 |
| NE2571 #650 | 45.31 |
| NE2571 #3591 | 45.25 |
The correction for ion recombination, ks was evaluated at the used polarization voltages assuming a continuous scanned beam. This is the case for a cyclotron since the period between pulses is short and the pulse duration is long compared to the collection time of the ions in the chamber air volume (Palmans et al 2006 and Liszka et al 2018). Using this method yields the recombination correction factors given in table 4, where also the corrections for polarity effects (kpol) are presented.
Table 4. Correction factors for recombination and polarity effects for the chambers used at the various energies. (Not all chambers were used for all beams.).
| 140 MeV (Rres = 9.38 g cm−2) | 180 MeV (Rres = 17.30 g cm−2) | 220 MeV (Rres = 26.28 g cm−2) | ||||
|---|---|---|---|---|---|---|
| Chamber | ks | kpol | ks | kpol | ks | kpol |
| FC65-G #3049 | 1.0078 | 1.0005 | 1.0093 | 1.0000 | 1.0122 | 0.9996 |
| FC65-G #3171 | 1.0077 | 1.0005 | 1.0094 | 1.0000 | 1.0123 | 0.9996 |
| NE2571 #650 | — | — | 1.0145 | 1.0000 | — | — |
| NE2571 #3591 | — | — | 1.0149 | 1.0000 | — | — |
5. Results
5.1. Water calorimetry at the Skandion clinic proton beam
In total 70 measurements were performed for the 140 MeV proton beam yielding an absorbed dose to water of 2.460 Gy (±0.55%). The stated relative uncertainty refers to the combined experimental standard uncertainty (k = 1), applying the factors described in section 4.1. Results are presented in figure 4 divided into sessions where each set consists of measurements made on a separate day. The corresponding results for 180 MeV (78 measurements,) and 220 MeV (66 measurements) are 2.425 Gy (± 0.51%) and 2.442 Gy (± 0.59%), respectively. Results are presented in figures 5 and 6. The horizontal lines represent the overall mean value ± the standard deviation. It should be noted that the data points include different number of measurements, resulting in a slight difference between the overall mean value and the mean value of the data points (most noticeable in figure 6).
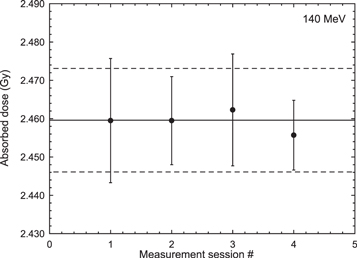
Figure 4. Calorimeter results obtained with the 140 MeV scanned proton beam at the Skandion clinic. Each measurement session/set was performed on a separate day during one week. The uncertainty bars represent the standard deviation (k = 1) of the measurands of each set. Horizontal lines represent the overall mean value ± its standard deviation (0.55%).
Download figure:
Standard image High-resolution image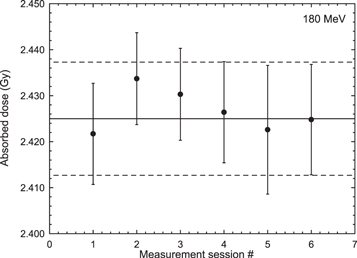
Figure 5. Calorimeter results obtained with the 180 MeV scanned proton beam at the Skandion clinic. Each measurement session/set was performed on a separate day during a time span of nine months. The uncertainty bars represent the standard deviation (k = 1) of the measurands of each set. Horizontal lines represent the overall mean value ± its standard deviation (0.51%).
Download figure:
Standard image High-resolution image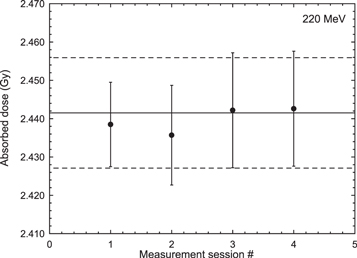
Figure 6. Calorimeter results obtained with the 220 MeV scanned proton beam at the Skandion clinic. Each measurement session/set was performed on a separate day during one week. The uncertainty bars represent the standard deviation (k = 1) of the measurands of each set. Horizontal lines represent the overall mean value ± its standard deviation (0.59%).
Download figure:
Standard image High-resolution image5.2. Ionometry at the Skandion clinic proton beam including determination of kQ
The four Farmer-type ionization chambers included in the study were irradiated on various sessions according to table 5. The normalized values in the tables represent the product of the corrected chamber reading, MQ , (averaged over 5–9 measurements for each chamber on each session) and the ionization chamber calibration coefficients given in table 4. The results in table 5 yield a mean value for MQ ND,w of 2.396 Gy for the two FC65-G chambers used in the 140 MeV beam with a relative uncertainty of 0.70% referring to the combined experimental standard uncertainty (k = 1) with contributions from (i) the reading of the ionization chambers, including their uncertainties in positioning (affected by field homogeneity and slope of the depth-dose distribution around the depth of measurement) and the method of normalisation, (ii) correction factors for recombination and polarity effect, and (iii) calibration of the ionization chambers at the 60Co reference beam quality. The corresponding values for the 180 MeV and 220 MeV beams and the FC65-G chambers are 2.376 Gy (± 0.70%) and 2.389 Gy (± 0.70%), respectively. In the 180 MeV beam, the NE2571 chambers were used yielding the result of 2.385 Gy (± 0.70%).
Table 5. Ionization chamber results in the three scanned proton beams. The values, in Gy, correspond to the product MQ ND,w, i.e. the corrected chamber reading multiplied by the chamber calibration coefficient; note that kQ is not included. Each session represents a completely new set-up of the equipment in the experimental area; the different sessions were separated by a month for the 140 MeV and 220 MeV beam measurements and spanned over a year in the 180 MeV beam.
| Beam | Session | FC65-G #3049 | FC65-G #3171 | NE2571 #650 | NE2571 #3591 |
|---|---|---|---|---|---|
| 140 MeV | 1 | 2.391 | 2.392 | — | — |
| 2 | 2.398 | 2.403 | — | — | |
| Average value | 2.394 | 2.397 | — | — | |
| 180 MeV | 1 | — | 2.378 | — | — |
| 2 | 2.384 | 2.382 | — | — | |
| 3 | — | 2.367 | — | — | |
| 4 | — | — | 2.390 | 2.384 | |
| 5 | — | — | 2.382 | — | |
| 6 | 2.368 | 2.370 | — | — | |
| 7 | 2.376 | 2.379 | — | — | |
| Average value | 2.376 | 2.375 | 2.386 | 2.384 | |
| 220 MeV | 1 | 2.386 | 2.390 | — | — |
| 2 | 2.384 | 2.395 | — | — | |
| Average value | 2.385 | 2.392 | — | — |
Applying equation (6) to the results above, i.e. dividing the absorbed dose to water  obtained with the calorimeter by the product MQ
ND,w determined with the ionization chambers, yields the experimentally determined kQ
factors presented in table 6. The uncertainties shown correspond to the combined experimental standard uncertainty (k = 1). The conversion of these kQ
values to those corresponding at the depth of 2 g cm−2 is described under section 6 'Discussion and conclusions'.
obtained with the calorimeter by the product MQ
ND,w determined with the ionization chambers, yields the experimentally determined kQ
factors presented in table 6. The uncertainties shown correspond to the combined experimental standard uncertainty (k = 1). The conversion of these kQ
values to those corresponding at the depth of 2 g cm−2 is described under section 6 'Discussion and conclusions'.
Table 6. Experimentally determined kQ factors at a reference depth of 5 g cm−2 in water, comparing water calorimetry and ionometry using equation (6).
| Chamber | 140 MeV (Rres = 9.38 g cm−2) | 180 MeV (Rres = 17.30 g cm−2) | 220 MeV (Rres = 26.28 g cm−2) |
|---|---|---|---|
| FC65-G | 1.027 ± 0.009 | 1.021 ± 0.009 | 1.022 ± 0.009 |
| NE2571 | — | 1.017 ± 0.009 | — |
5.3. Ripple effect
The standard deviation of the ratio of the integrated dose for the randomized spot positions and for the nominal spot positions for the Farmer projected area was 0.4%, which can be considered as an upper limit since the response of the chamber reduces laterally when moving away from the centre (in the horizontal direction in figure 3) due to the reduced projected length of the chamber along the beam axis. This value is comparable with results extracted from table 5 but it should be emphasized that they also include the effect of set-up uncertainties.
The corresponding result for the smaller 1 mm × 1 mm integrating area was found to be 1% which is consistent with the fact that a small integrating area will be more sensitive to local lateral dose fluctuations. The situation for the water calorimeter is however much more complex due to the effect of heat transfer and its influence on the measured signal. The way the calorimeter senses temperature means that the signal will initially be dominated by temperature rises in the close vicinity of the thermistors but the longer the measurement time, the more heat from the surroundings will diffuse towards the measurement point and thus the more the temperature rise at larger distances will contribute to the signal which will gradually wash away the effect of local temperature fluctuations. It is in this context interesting to note that if the results presented in figures 4–6 are divided into measurement sets/dates the fluctuation of the results is comparable, or in some cases less, than the corresponding fluctuations for the ionization chambers (see table 7). This comparison suggests that the 1% result obtained via the simplified integration of spot positions overestimates the effect when temperature distributions are taken into account due to the complex process of heat transfer.
Table 7. Water calorimetry results divided into sets of measurements performed on various days. The results for the 180 MeV beam stretched over 9 months between the first and the last set. Measurements for the other two energies stretched over a week. The experimental relative standard uncertainty (k = 1) of the separate values ranges from 0.1% to 0.3% mainly depending on the number of measurements in each set. The overall experimental relative standard uncertainty (k = 1) is below 0.1% for each energy.
| 140 MeV | 180 MeV | 220 MeV | |||
|---|---|---|---|---|---|
| Set | Dw (Gy) | Set | Dw (Gy) | Set | Dw (Gy) |
| 1 | 2.460 | 1 | 2.422 | 1 | 2.438 |
| 2 | 2.460 | 2 | 2.434 | 2 | 2.436 |
| 3 | 2.462 | 3 | 2.430 | 3 | 2.442 |
| 4 | 2.456 | 4 | 2.426 | 4 | 2.443 |
| — | — | 5 | 2.423 | — | — |
| — | — | 6 | 2.425 | — | — |
6. Discussion and conclusions
The beam quality correction factors presented in table 6 for the NE2571 and FC65-G Farmer-type ionization chambers can be compared with kQ values determined experimentally (Medin et al 2006, Medin 2010) or by Monte Carlo (MC) calculation from other authors (Gomà et al 2016, Gomà and Sterpin 2019, Baumann et al 2020, Kretschmer et al 2020, Baumann et al 2021). Additional data sources are the analytically calculated kQ (Rres) values tabulated in IAEA TRS-398 (Andreo et al 2000), where Rres is the proton residual range commonly used as beam quality specifier, and the values by Palmans et al (2022) to be included in the update of TRS-398. To be noted is that the Wellhöfer-IC70 was the predecessor of the present IBA FC65-G chamber. All the uncertainties quoted below are estimated standard uncertainties (k = 1).
The MC calculations have been performed for monoenergetic proton beams (and 60Co γ-rays). With the exception of Baumann et al (2021), the publications cited do not include Rres, which depends on the depth of measurement (z) and the practical range (Rp) at which the absorbed dose beyond the Bragg peak has fallen to 10% of its maximum value. To enable a comparison with real beams, a lookup table of Rp(E) values for monoenergetic protons has been calculated with the most recent version of the MC code PENH (Salvat 2013, Salvat and Quesada 2020), so that values of Rres(E) can be calculated for the depth of interest z using Rres = Rp − z. It is assumed that other MC codes yield very similar Rp(E) values; this is the case with the Rres(E) given in Baumann et al (2021), for which the root-mean-square deviation from the corresponding PENH values is 0.06 g cm−2. It should be noted that the kQ factors in these MC publications were provided at a reference depth of 2 g cm−2, whereas the measurements in the present work were performed at 5 g cm−2 due to the diameter of the cylindrical sealed glass vessel of the calorimeter. In order to compare the results of the present work with the MC-calculated values, the former were corrected to 2 g cm−2 using sw,air values based on the stopping-power data provided in ICRU 90 (Seltzer et al 2016) and by interpolating between the incident proton energies used in the publications. Due to the slow variation of sw,air with energy, this procedure will introduce a correction of less than 0.02%. The difference in the displacement correction factor, pdis , between the depths of 5 g cm−2 and 2 g cm−2 has also been taken into account. The values were obtained from Palmans et al (2020) and the correction factors to apply to the measured data in table 6 are 1.0005 (for 140 MeV), 1.0024 (180 MeV) and 1.0031 (220 MeV).
For the NE2571 chamber type, the present measurements were only performed at the nominal proton energy of 180 MeV (Rres = 17.30 g cm−2), yielding an average kQ value of 1.019 ± 0.009 when converted to 2 g cm−2. The experimental kQ values derived at the same reference depth to compare were 1.029 ± 0.013 (Medin 2010) obtained in a beam with similar residual range as the present 180 MeV beam, and 1.020 ± 0.007 (Medin et al 2006), obtained using a passive scattered proton beam with similar residual range. The displacement correction factors for these two beams were obtained from depth-ionization distributions published in the papers by Medin et al (2006) and Lorin et al (2000), respectively. The MC-calculated values in the references cited, differed by −0.1% to 1.5% from the presently determined kQ values at 2 g cm−2, respectively. The values from the IAEA TRS-398 and TRS-398 update (from Palmans et al 2022) were 1.039 ± 0.018 and 1.023 ± 0.014, that is 2% and 0.4% higher than the presently determined kQ values, respectively. The comparison is presented in figure 7, where it can be seen that all the results have overlapping k = 1 uncertainty bars.
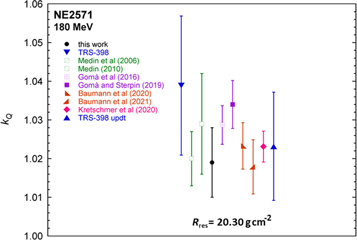
Figure 7. Comparison of beam quality correction factors for the NE2571 Farmer-type ionization chamber in a 180 MeV proton beam. The calorimetry-based derived kQ value at 2 g cm−2 depth of this work is compared with experimental (Medin et al 2006, Medin 2010), Monte Carlo-calculated (Gomà et al 2016, Gomà and Sterpin 2019, Baumann et al 2020, Kretschmer et al 2020, Baumann et al 2021) and analytically calculated (IAEA TRS-398; Palmans et al 2022 for the TRS-398 update) values.
Download figure:
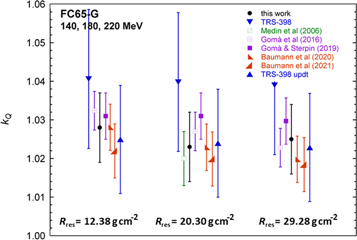
Standard image High-resolution imageFor the FC65-G chamber type, measurements performed at the nominal proton energies of 140 MeV (Rres = 9.38 g cm−2), 180 MeV (Rres = 17.30 g cm−2) and 220 MeV (Rres = 26.28 g cm−2) yielded average values at 2 g cm−2 of 1.028, 1.023 and 1.025 respectively, all with an estimated standard uncertainty of 0.009. An experimental value of 1.020 ± 0.007, after being corrected to 2 g cm−2, was measured by Medin et al (2006) in a beam with similar residual range as the present 180 MeV beam. The differences with the MC-calculated values for the references cited varied between −0.6% and 0.8%. The values from IAEA TRS-398 had the largest differences, these varying between 1.2% and 1.6%, whereas for the update of TRS-398 (from Palmans et al 2022) differences were between −0.2% and 0.3%. The comparison is presented in figure 8, where it can be seen that all the results have overlapping k = 1 uncertainty bars.
Figure 8. Comparison of beam quality correction factors for the FC65-G Farmer-type ionization chamber in 140, 180 and 220 MeV proton beams. The calorimetry-based derived kQ values at 2 g cm−2 depth of this work are compared with experimental (Medin et al 2006), Monte Carlo-calculated (Gomà et al 2016, Gomà and Sterpin 2019, Baumann et al 2020, Baumann et al 2021) and analytically calculated (IAEA TRS-398; Palmans et al 2022 for the TRS-398 update) values.
Download figure:
Standard image High-resolution image
The present work yielded a ratio of beam quality factors between the FC65-G chamber and the NE2571 chamber of 1.004 for the 180 MeV proton beam. Taking uncertainties into account, this result is not significantly different from the result 1.000 reported by Gomà and Sterpin (2019) for MC calculations averaged over two beam qualities of 160 MeV and 200 MeV at the depth of 2 g cm−2. Palmans et al (2001) obtained experimentally a similar result (0.999) for an unmodulated beam in the plateau region when comparing the responses of two NE2571 chambers to a Wellhöfer-IC70 chamber.
It can be concluded that when the stated uncertainties in each data source are taken into account, none of the previously published results differs significantly from the experimental kQ factors obtained in the present work. The best overall agreements are with the MC results obtained by Goma et al (2016) and Baumann et al (2020) and with the analytical calculations by Palmans et al (2022) for the update of IAEA TRS-398.
Ripple effects are a potential contributing factor to the uncertainty of measurands in scanned proton beams, which may differ between various beams/facilities. However, the results obtained with water calorimetry in the present work do not show the same magnitude of variation as obtained using the simplified approach described in section 2.4. This is expected to be a result of the complex heat transfer process during irradiation.
It is expected that the present work will serve as an experimental contribution to the determination of kQ factors for the two Farmer chamber types used at the three scanned proton beam qualities.
Acknowledgments
Support provided by project grant SSM2015-4787 by the Swedish Radiation Safety Authority is gratefully acknowledged.