

Abstract
Following collapse of a histotripsy cloud, residual microbubbles may persist for seconds, distributed throughout the focus. Their presence can attenuate and scatter subsequent pulses, hindering treatment speed and homogeneity. Previous studies have demonstrated use of separate low-amplitude (~1 MPa) pulses interleaved with histotripsy pulses to drive bubble coalescence (BC), significantly improving treatment speed without sacrificing homogeneity. We propose that by using electronic focal steering (EFS) to direct the therapy focus throughout specially-designed EFS sequences, it is possible to use low-gain regions of the therapy beam to accomplish BC during EFS without any additional acoustic sequence. First, to establish proof of principle for an isolated focus, a 50-foci EFS sequence was constructed with the first position isolated near the geometric focus and remaining positions distributed post-focally. EFS sequences were evaluated in tissue-mimicking phantoms with gas concentrations of 20% and 100% with respect to saturation. Results using an isolated focus demonstrated that at 20% gas concentration, 49 EFS pulses were sufficient to achieve BC in all samples for pulse repetition frequency (PRF) ⩽ 800 Hz and 84.1% ± 3.0% of samples at 5 kHz PRF. For phantoms prepared with 100% gas concentration, BC was achieved by 49 EFS pulses in 39.2% ± 4.7% of samples at 50 Hz PRF and 63.4% ± 15.3% of samples at 5 kHz. To show feasibility of using the EFS-BC method to ablate a large volume quickly, a 1000-foci EFS sequence covering a volume of approximately 27 ml was tested. Results indicate that the BC effect was similarly present. A treatment rate of 27 ± 6 ml min−1 was achieved, which is signficantly faster than standard histotripsy and ultrasound thermal ablation. This study demonstrates that histotripsy with EFS can achieve BC without employing a separate acoustic sequence which has the potential to accelerate large-volume ablation while minimizing energy deposition.
Export citation and abstract BibTeX RIS
1. Introduction
Histotripsy is a noninvasive, non-thermal ultrasound ablation technique that uses high-amplitude (peak rarefactional pressure amplitudes >10 MPa), short-duration (as few as ~1.5 cycles), focused acoustic pulses at low duty cycle (<1%) to homogenize tissue by means of finely-controlled acoustic cavitation (Cain 2003, Xu et al 2004, 2005, Parsons et al 2006, Xu and Bigelow 2011, Xu et al 2012, Wang et al 2013, Simon et al 2015, Bigelow et al 2017). In vivo studies have demonstrated the potential use of histotripsy for several clinical applications where tissue disruption is desired including cancer (Styn et al 2010, 2012, Schade et al 2012, Khokhlova et al 2014, Li et al 2015, Hoogenboom et al 2016), thrombosis (Maxwell et al 2009, 2011a, Zhang et al 2016), benign prostate hyperplasia (Hall et al 2009, Hempel et al 2011, Darnell et al 2015), congenital heart disease (Xu et al 2010, Miller et al 2011, Owens et al 2011, Miller et al 2013), renal calculi (Duryea et al 2011a, 2011b, 2013), and applications in the brain (Gateau et al 2011a) including intracerebral hemorrhage (Sukovich et al 2016).
During the expansion phase of de novo histotripsy cavitation, gas diffuses into the bubble from the host medium, increasing its gas content by what Bader and Bollen estimate to be more than five orders of magnitude (Bader and Bollen 2018). The inertial collapse of an acoustic cavitation bubble cloud is commonly followed by one to three rebounds of diminishing amplitude (Tomita and Shima 1990, Coleman et al 1992, Matula et al 2002, Xu et al 2007). Following the final cavitation collapse, the focal zone can be littered with tens (Flynn and Church 1984) to hundreds (Brennen 2002) of residual microbubbles with radii <1 micron to tens of microns (Flynn and Church 1984, Church 1989, Coleman et al 1992, Akhatov et al 2001). Micron-scale bubbles may then persist for up to seconds even in degassed media (Epstein and Plesset 1950). Sources of residual nuclei described in the literature include the primary cavitation bubble itself, incomplete fusion of individual bubbles during the expansion of the cloud, particularly at the periphery of the cloud (Pishchalnikov et al 2006b), and fission of the primary bubble during collapse (Brennen 2002). If a subsequent pulse arrives before residual microbubbles have sufficient time to dissolve, they can function as cavitation nuclei for subsequent pulses in a phenomenon known as the cavitation memory effect (Flynn and Church 1984, Henglein 1987, Fowlkes and Crum 1988, Yavas and Leiderer 1994, Wang et al 2012, Duryea et al 2015). The presence of such pre-existing microbubbles within the focal zone or along the intervening acoustic propagation path can result in attenuation (Wijngaarden et al 1972, Arora et al 2005, Pishchalnikov et al 2006a) and scattering of the therapy pulse (Maxwell et al 2011a, Wang et al 2012) as well as distortion (Wiksell and Kinn 1995, Wang et al 2012) of the intended focal zone. Previous studies have shown that the cavitation memory effect can hinder fractionation efficiency and homogeneity during histotripsy treatment (Roberts et al 2006, Wang et al 2009, Wang et al 2012, Lundt et al 2017).
Strategies for mitigating the cavitation memory effect can be broadly categorized as passive or active. In the passive approach, sufficient time is provided between pulses such that residual nuclei dissolve passively, driven by the Laplace pressure and at rates dependent on the dissolved gas concentration in the host medium (Epstein and Plesset 1950, Duncan and Needham 2004). Because the time required for passive dissolution may be >1 s for microbubbles of the size remaining after histotripsy cavitation collapse, the practical implementation of a passive approach for therapeutic applications necessitates electronically steering the therapy focus to other locations within an ablation zone defined by a grid of numerous overlapping foci during the off-time for a given focus (Lundt et al 2017).
An active strategy, termed bubble coalescence (BC), follows each high-amplitude therapy pulse with a moderately long (tens to thousands of cycles), lower-amplitude (~1 MPa) BC pulse which drives residual nuclei together within several milliseconds by means of the secondary Bjerknes force (Bjerknes 1906, Kornfeld and Suvorov 1944, Blake 1949, Rosenberg 1953, Duryea et al 2014, 2015). Previous studies have demonstrated that histotripsy with BC can significantly increase ablation speed (Duryea et al 2014, 2015a, 2015b, 2015c, Shi et al 2018) by allowing a relatively high pulse repetition frequency (PRF) for histotripsy (e.g. PRF = 100 Hz for a single focus) while maintaining high treatment homogeneity. In these studies, separate acoustic sequences for histotripsy and BC were transmitted. The BC sequences found to be optimal in the studies by Duryea et al and Shi et al deposited approximately 30% additional acoustic energy (relative to the histotripsy therapy pulses) within the −6 dB region of the therapy focus (Duryea et al 2015c, Shi et al 2018). The ablation of large tissue volumes may require a high PRF in order to achieve a clinically practical total treatment time. For such an application, the additional acoustic energy associated with a separate BC sequence may pose a risk of tissue heating or require the prolonging of treatment times.
For the passive strategy using electronic focal steering (EFS), foci at a certain distance from the current focus experience a low-gain acoustic pressure field from the side lobes of the therapy beam similar in amplitude to sequences used for BC. If an EFS sequence were arranged appropriately, populations of nascent residual nuclei would experience a series of short, low-amplitude acoustic pulses. In this manner, each therapy pulse would have the potential to serve the dual-purpose of exciting cavitation at the current EFS focus and driving BC at the foci which recently preceded it. This strategy for mitigating the cavitation memory effect would not require a separate BC sequence. In this study, we hypothesize that while electronically steering the histotripsy therapy focus, low-gain regions of the therapy beam can be used to drive BC. Low-gain regions of the transmitted sound field are defined here to be those <20 dB down from the peak pressure. We investigated the feasibility of this approach and examined the behavior of a population of residual nuclei under the influence of low-gain regions of the therapy beam while executing a specially-designed EFS sequence. The sequence consisted of 1 EFS position near the transducer's geometric focus and 49 which followed it and resided ⩾2λ away. The region of the first EFS focus was monitored by optical camera for each pulse in the sequence. The success criteria for BC was defined as the consolidation of the residual microbubble population into a single bubble or a dense cluster of bubbles no greater than 1 mm in its greatest dimension as visualized during expansion by a low-gain region of the EFS beam, serving as an acoustic probe pulse. One important application of EFS-BC is to enable rapid and homogenous ablation of a large volume target, such as tumors in the liver, kidney, and pancreas. Finally, to demonstrate proof of concept for large-volume ablation using the EFS-BC method, a 27 ml volume was treated by EFS-BC with 1000 steering points.
2. Methods
2.1. Experimental setup
The transducer used for this study (figure 1), as previously described (Lundt et al 2017), was a hemispherical phased array with 256 individually addressable elements. It had a center frequency of 250 kHz, a 30 cm aperture, and a 15 cm focal distance. It was controlled by a field programmable gate array (FPGA) digital circuit and generated acoustic pulses approximately 1.5-cycles in duration as shown in figure 2. Histotripsy pulses in this study generated cavitation by the intrinsic threshold mechanism (also termed microtripsy) (Lin et al 2014). Experiments in which BC behavior was investigated at an isolated focus were performed in transparent tissue-mimicking agarose hydrogel phantoms measuring 127 mm × 70 mm × 13 mm and secured using a 3D printed holder designed such that no part of the holder blocked the ultrasound propagation path to the focus (Lundt et al 2017). The center of the monitored focus was at least 20 mm from the holder where pressure was ~26 dB down from the peak pressure, such that scattered pressure at the monitored focus would be expected to be negligible. Experiments in which BC behavior was investigated for large-volume ablation were performed in agarose gel phantoms measuring 50 mm × 40 mm × 50 mm. One group of phantoms for large-volume contained only gel to allow optical imaging of cavitation. Agarose gel was prepared by adding low melting point agarose powder (DSA20070, Dot Scientific, Burton, MI) at 1 g per 100 ml to deionized water and bringing the mixture to a boil. A previous study in our lab found the elastic modulus of gels prepared with this agarose concentration to be 21.7 ± 1.0 kPa which is on the order of physiological values of soft tissue (Vlaisavljevich et al 2015a). The hot gel was then vacuum filtered to 0.2 μm (12-566-218, Thermo Scientific, Waltham, MA) to remove dust and debris, poured into a mold with the gel holder, and allowed to cool to room temperature. Prior to use, phantoms were placed in a room temperature water bath held at either approximately 20% or 100% dissolved gas concentration with respect to saturation, depending on the experiment to be performed and allowed to equilibrate (Bhunia et al 2016) for ⩾12 h prior to use for phantoms 13 mm thick and ⩾48 h prior to use for phantoms 50 mm thick.
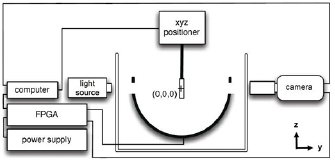
Figure 1. Diagram of experimental setup. Geometric focus is labeled (0, 0, 0).
Download figure:
Standard image High-resolution image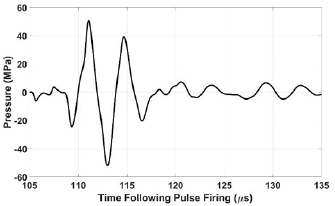
Figure 2. Acoustic waveform at EFS position (0, 3, 0) estimated by the linear summation of hydrophone measurements from individual elements. t = 0 corresponds to the time at which the pulse was fired.
Download figure:
Standard image High-resolution imageTo monitor the ablation resulted from histotripsy cavitation damage, a second group of phantoms with identical dimensions was prepared with a layer 1 mm thick containing red blood cells (RBCs) at 5% concentration and positioned in the middle of the phantom. Similar to the approach described previously (Maxwell et al 2010), the RBC layer was initially opaque and became transparent tracking with the progression of cavitation damage, thereby allowing real-time optical monitoring. Porcine blood obtained from a local abattoir (Dunbar Meant Packing, Milan, MI) where it was mixed 10:1 with citrate-phosphate-dextrose solution (C7165, Sigma-Aldrich, St. Louis, MO, USA). RBC phantoms were then stored in a bath of phosphate buffered saline held at either approximately 20% or 100% gas concentration for ⩾48 h prior to use.
These gas concentrations were selected in an attempt to represent two distinct aspects of cavitation activity in vivo. First, for a given host medium, the acoustic pressure threshold for the heterogeneous nucleation of inertial cavitation is influenced by the size and number density of endogenous stabilized nuclei (Harvey et al 1944, Yount 1979, Atchley 1989, Bunkin et al 1995). In an in vivo setting, endogenous nuclei are believed to be relatively small and sparse (Miller et al 2000, Coussios et al 2007, Gateau et al 2011b), due to physiological filtration and cleaning mechanisms (Williams et al 1989). Agarose gel, in contrast has been described as 'hyper-nucleated', containing relatively large nuclei at high number density (Yount 1984). Previous studies have suggested that cavitation nucleation behavior in vivo can be approximated in agarose gel by degassing phantoms during preparation (Maxwell et al 2010, 2013). Second, the dissolution time of a microbubble is dramatically shorter in degassed a medium than one near gas-saturation (Epstein and Plesset 1950, Duncan and Needham 2004, Kapodistrias and Dahl 2012). Literature values for the gas concentration in living mammalian tissues are approximately 90%–95% relative to saturation in water (Lategola 1964, Church 1989). Thus, one group of samples was prepared with approximately 20% gas concentration to mimic the nucleation behavior of endogenous nuclei in vivo (Xu et al 2006, 2007a, Wang et al 2012), while a second group of samples was prepared with 100% gas concentration to mimic the dissolution behavior of residual nuclei in vivo. Gas concentration was measured by a dissolved oxygen probe (Orion Star A323, Thermo Scientific, Waltham, MA).
The transducer was oriented facing upward and the gel phantom was affixed to a 3D positioning system as shown in figure 1. For experiments involving an isolated focus, the activity of residual nuclei at a single focus located at (0 mm, 3 mm, 0 mm) was monitored by an optical camera. Subsequent references to coordinate positions omit the unit (mm) unless otherwise indicated. This position, slightly offset from the geometric focus (0, 0, 0), was selected to reduce the impact of cavitation expansion and collapse signals reflected and refocused by the surface of the transducer on residual nuclei (Parsons et al 2006). It was observed that the reflection of cavitation signals originating at a position (x, y, z), were refocused to a mirrored position (−x, −y, −z).
The ultrasound pressure waveform at (0, 3, 0) was characterized using a hydrophone with robust directivity-response (HGL-0085, Onda, Sunnyvale, CA). At the acoustic pressure used for experimentation, cavitation was generated instantaneously. Thus, direct measurement was not possible. For the calibration procedure, each of the array's modules was driven individually at the voltage used for experimentation. Individual waveforms were then summed in a linear fashion to estimate the therapy waveform. The peak rarefactional pressure amplitude (P−) at (0, 3, 0) was estimated to be approximately 52 MPa. While underestimation of nonlinear effects is a limitation of this approach, several factors limited the extent of error from nonlinear effects. The transducer's f-number was very low (0.5) and the ratio of active area to total aperture surface area was modest (0.57). Thus, waveforms from individual modules interacted minimally until very near the focus (Vlaisavljevich et al 2017). The center frequency (250 kHz) was also fairly low (Carstensen et al 1980, Muir and Carstensen 1980). Additionally, nonlinear acoustic propagation impacts the compressional phase to a greater extent than the rarefactional phase (Kreider et al 2013, Yuldashev et al 2013), which is of primary interest for histotripsy therapy in the absence of shock scattering (Maxwell et al 2011b).
2.2. Formation of residual nuclei
The time-course of cavitation activity and the formation of residual nuclei were investigated using an optical camera (FL3-U3-120S3C-C, FLIR Integrated Imaging Solutions, Richmond, BC, Canada) equipped with a telephoto lens (107-306, Sigma Corporation, Ronkonkoma, NY). In this configuration, images had a resolution of approximately 3 μm/pixel. Bubble clouds were backlit by a custom-built strobe light emitting flashes 5 μs in duration as measured by a photodetector (DET02AFC, Thorlabs, Newton, NJ). The histotripsy focus was electronically steered to (0, 3, 0) and pulses with approximately 52 MPa P − were fired at 5 s pulse repetition period (PRP). One frame per pulse was captured for 200 pulses. The timing of frame-capture was incremented by 5 μs for each pulse starting at 10 μs prior to the arrival of the pulse at the focus. In this manner, a series of images tracking the evolution of typical cavitation growth and collapse was reconstructed, covering a 1 ms span beginning slightly before the arrival of the histotripsy pulse at position (0, 3, 0). The principle limitation of this composite approach is that it fails to account for the inter-pulse variation in cavitation dynamics (i.e. collapse time).
2.3. Passive dissolution of residual nuclei
To provide a reference for subsequent BC experiments, the passive dissolution behavior of residual nuclei was monitored by optical imaging. The histotripsy focus was electronically steered to (0, 3, 0) and pulses were fired at 5 s PRP to allow sufficient time for the dissolution of residual bubbles between pulses. For each pulse, 50 frames were captured at 100 ms intervals with the first frame captured at 10 ms following the initial cavitation expansion. Images were post-processed in MATLAB by converting greyscale images to binary and measuring the size distribution of residual nuclei for each frame. The segmentation script used to create the binary image was calibrated by imaging opaque polystyrene beads 25 μm in diameter (Stock No. 42730, Alfa Aesar, Ward Hill, MA) placed in a disposable hemocytometer (C-Chip, SKC, Inc., Covington, GA) and submerged at the focal position (0, 3, 0). 25 μm beads were selected because this was observed to be the approximate initial size of the residual nuclei of interest.
2.4. Bubble coalescence: proof of principle with an isolated focus
In this experiment, a specially-designed 50-foci EFS trajectory was constructed in which the first EFS position lay at (0, 3, 0) and positions 2:50 lay in the plane z = 12 mm (2λ away) with a minimum of 5 mm of center–center spacing between these positions as shown in figure 3. This configuration was selected to investigate the behavior of residual nuclei under the influence of low-gain regions of the therapy beam at EFS position 1 with this position in relative isolation. The criteria for achieving BC was defined as the consolidation of residual nuclei into a single bubble or dense cluster of bubbles no greater than 1 mm in greatest dimension as visualized during expansion by the low-gain regions of EFS-BC pulses which also served as acoustic probe pulses. This value was chosen empirically as residual bubbles were observed to coalesce to a central locus with a steady-state size approximately 0.75 mm in greatest extent.

Figure 3. Diagram of EFS positions for investigation of BC behavior at an isolated focus. Monitored focus, EFS position 1, appears in dark grey. EFS positions 2:50, appear in light grey. The optical camera was oriented along the y-axis. Units are millimeters. Ultrasound propagation was in the positive z-direction.
Download figure:
Standard image High-resolution image2.4.1. Characterization of low-gain regions of the therapy beams
Low-gain regions of the therapy beams experienced at the monitored focus were characterized in the free field using a hydrophone (HGL-0085, Onda, Sunnyvale, CA). Its tip was positioned at (0, 3, 0) facing the array and with its axis oriented vertically, similar to the configuration displayed in figure 1. The therapy beam was then steered throughout EFS positions 2:50. Because the driving voltage used for experimentation generated acoustic pressures exceeding the operating range of the hydrophone, these measurements were collected with the driving voltage set to 20% of the value used for experimentation and linearly extrapolated. Waveforms were captured and averaged by an oscilloscope and transferred to a PC. Throughout EFS positions 2:50, the mean ± standard deviation of peak compressional and rarefactional pressure amplitudes were 3.5 ± 0.7 MPa and 2.7 ± 0.6 MPa, respectively. These waveforms contained approximately 3–7 cycles with the first cycle having the highest amplitude. A typical low-gain waveform appears in figure 4.
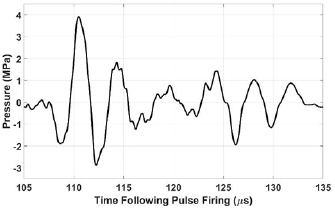
Figure 4. Linearly extrapolated waveform at (0, 3, 0) while electronically steering the therapy focus to (−10, 8.7, 12).
Download figure:
Standard image High-resolution image2.4.2. Characterization of residual nuclei during EFS
The coalescence behavior of residual nuclei during EFS was characterized in a tissue-mimicking agarose hydrogel phantom. We hypothesize that using the low-gain field generated at EFS position 1, when the focus is steered to EFS positions 2:50, will induce BC at EFS position 1. The phantom was positioned such that EFS position 1, (0, 3, 0), was centered within the phantom, and EFS positions 2:50 were at least 10 mm from the gel holder. The PRF within EFS bursts through positions 1:50 was varied from 50 Hz to 5 kHz. The burst repetition frequency for the overall EFS burst was 0.2 Hz for all tests. For each data set, the phantom was repositioned such that the EFS position 1 lay within an untreated region of the phantom. EFS position 1, (0, 3, 0), was monitored by a high speed optical camera (Phantom V2012, Vision Research, Wayne, NJ) equipped with a telephoto lens (107-306, Sigma Corporation, Ronkonkoma, NY) and two teleconverters (MC 2X N-AF DGII, Bower, Long Island City, NY) and backlit with an LED light source (CLU550-3626C1-40AL7G4-B24, Citizen Electronics, Fujiyoshida, Japan) operated in continuous mode. Frames covered a region measuring 4.21 mm × 6.57 mm at the focal plane and had a resolution of approximately 8 μm/pixel. The camera was set up to capture one frame with a 10 μs exposure per EFS pulse. The time of frame capture was set at 113 μs following firing the earliest phased array element such that the midpoint of the exposure was approximately synchronized with the maximum radii of residual nuclei, having been re-excited by the low-gain regions of the therapy beam. In addition to driving BC, low-gain regions of the therapy beam also functioned as a probe for optical monitoring, expanding residual nuclei to facilitate their visualization. Control data were acquired for both gas concentrations by generating a cavitation bubble cloud at EFS position 1, waiting 1–50 ms, and then delivering a single pulse to EFS position 2 which functioned as a probe to re-excite residual nuclei at EFS position 1. These data serve as a reference for the spatial distribution of residual nuclei under passive conditions.
Data were processed in MATLAB (Mathworks, Natick, MA) where images were first high-pass filtered to remove out-of-focus cavitation bubbles which were observed to traverse the field of view commonly at high PRF and/or high gas concentration. Images were then converted to binary using a locally adaptive thresholding method (Bradley and Roth 2007). The vertical and horizontal spatial extent of the residual microbubble population was recorded for each frame.
2.5. Bubble coalescence: large-volume ablation
To demonstrate proof of principle for large-volume ablation using EFS-BC, a 1000-foci EFS grid was constructed in which foci were arranged in a 10 × 10 × 10 modified hexagonal close-packed structure with center–center spacing of dxy = 2.5 mm in the lateral direction and dz = 3.3 mm spacing the axial direction, resulting in a total volume of approximately 27 ml centered about the point (0, 0, 0). The overall 1000-foci EFS grid was then decimated into eight separate, interleaved 125-foci sub-grids. By arranging the firing order of the EFS sequence to execute each sub-grid sequentially, it maintained the condition that foci temporally adjacent in the firing order were separated by at least 2dxy in the lateral direction and 2dz in the axial direction. The goal of this approach was to reduce the cavitation memory effect by coalescing residual nuclei prior to exposing recently-cavitated focal positions to high-gain regions of subsequent EFS beams. The sub-grid firing order, shown in figure 5 by arrows 1–3, was selected to display the activity of residual nuclei for observation by the camera.
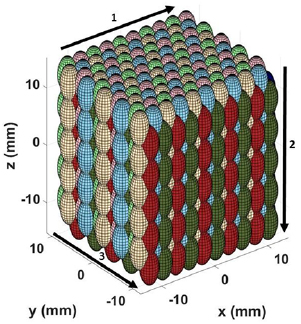
Figure 5. Diagram of EFS positions for proof of principle in a 1000-foci 3D steering grid. The firing order of the eight 125-foci sub-grids was red, dark blue, light green, light blue, dark green, dark brown (not visible in displayed orientation), pink and light brown. The firing order within each sub-grid progressed as indicated by the numbered arrows starting in the upper left corner. The optical camera was oriented along the y-axis. Units are millimeters. Ultrasound propagation was in the positive z-direction.
Download figure:
Standard image High-resolution image2.5.1. Large-volume ablation in transparent gel phantom
This experiment served to monitor the activity of residual nuclei in the context of a large-volume ablation treatment using a strategically arranged EFS sequence. Agarose gel phantoms measuring 50 mm × 40 mm × 50 mm were treated with 200 pulses per EFS focus at a PRF of 1 kHz and monitored by high speed camera (Phantom V2012, Vision Research, Wayne, NJ) equipped with a telephoto lens (107-306, Sigma Corporation, Ronkonkoma, NY) and backlit as described above. Frames measured 640 pixels × 752 pixels and covered a region measuring 35.6 mm × 41.9 mm at the focal plane. The camera was set up to capture twenty frames per pulse at intervals of 25 μs beginning at 50 μs following the firing of the pulse. Frames captured prior to the arrival of the pulse at the EFS focus were subsequently used for background subtraction during image processing. The exposure was set to 24 μs. Each pulse was intended to serve three purposes in this experiment: (1) generation of a cavitation bubble cloud was within the high-gain focal region, (2) coalescence of residual nuclei generated at recently treated foci by means of the low-gain regions of the therapy beam, and (3) acoustical probing for visualization of bubbles which have a static size below the resolution limit of the camera. The time-interval of frame capture was approximately 125–149 μs following firing the pulse. This interval was selected to account for the time of flight and corresponding range of phasing delays associated with the distance of these EFS sites from the geometric focus.
2.5.2. Large-volume ablation in RBC phantoms
This experiment sought to demonstrate the ablation efficacy of the EFS-BC technique by monitoring cavitation damage produced in tissue-mimicking phantoms. The setup was identical to that used in 2.5.1 with the exception that only one frame per repetition of the EFS sequence was captured following the completion of each EFS grid repetition. The authors define a single repetition as the delivery of 1 pulse per location throughout each focus of the 1000-foci grid. Images were analyzed in MATLAB by segmenting regions of unfractionated material within a rectangular region inset from the lesion boundary and measuring approximately 22 mm × 29 mm. Segmentation was performed by a locally adaptive binarization method (Bradley and Roth 2007). The extent of fractionation was defined as the ratio of the number of unfractionated pixels within a rectangular region to the total area of this region. Complete fractionation was defined as the ratio of unfractionated pixels to total region pixels being equal to 1.
3. Results
3.1. Formation of residual nuclei
The expansion and collapse sequence of the cavitation cloud generated by a histotripsy pulse was recorded by optical imaging and analyzed. Images collected at selected time-points are displayed in figure 6. The first frame (t = 0) corresponds to the arrival of the primary rarefactional excursion (see figure 2) of the acoustic pulse at the focus. At this time-point, the cavitation cloud expanded rapidly via the intrinsic threshold mechanism (Lin et al 2014). The first cavitation collapse was found to occur at approximately 375 μs following the arrival of the pulse at the focus. Frames captured at 0, 10 and 30 μs show heterogeneous bubble size, spatial density, and extent of fusion behavior. Pishchalnikov et al suggested that bubble clouds appearing to undergo coalescence may in fact retain a thin layer of fluid separating some bubbles (Pishchalnikov et al 2003, 2006b). The frame captured at 210 μs displays a layer of small microbubbles (~5–50 μm in radius) surrounding the primary cavitation bubble. The timing of the appearance of these microbubbles is consistent with the reflection and refocusing of the cavitation expansion shockwave by the surface of the therapy array. This frame also shows the ragged surface of the primary bubble cloud which may promote fission upon collapse. In the frame captured at 550 μs, distinct fission of the cavitation bubble cloud following collapse is observed. The frame captured at 570 μs displays what is likely re-excitement of the residual microbubble population by the primary cavitation collapse signal, reflected by the surface of the therapy array. This assertion is based on the estimated amplitude of these reflected signals being only approximately 2 MPa peak-to-peak which is insufficient to nucleate such cavitation de novo in filtered, degassed aqueous media (Apfel and Holland 1991, Maxwell et al 2013, Vlaisavljevich et al 2015b).

Figure 6. Cavitation bubble cloud images. Each frame displays a unique cloud generated by a separate pulse captured at a different time-point. Collectively, the full image sequence displays the progression of cavitation growth, collapse, and rebounds. Time of frame-capture relative to the arrival of the pulse at the focus appears above each frame. Frames captured at 0, 10, and 30 μs show individual bubbles with heterogeneous size and spatial density throughout the focus. Frames captured between 200–225 μs (only frame captured at 210 μs is presented) display a thin layer of small bubbles surrounding the primary cloud. In the frame captured at 550 μs, after the cloud has undergone at least one collapse, the primary bubble has undergone fission. The frame captured at 570 μs likely shows the population of residual nuclei re-excited by the cavitation collapse signal reflected at the transducer surface (see text for explanation). Direction of ultrasound propagation was from bottom to top. Scale bar = 1 mm.
Download figure:
Standard image High-resolution image3.2. Passive dissolution of residual nuclei
The passive dissolution behavior of residual microbubbles was monitored optically starting 10 ms following the arrival of the pulse at the focus to allow sufficient time for the cessation of violent cavitation activity and damping of large local oscillations of the host medium (Miller et al 2015). At 10 ms following the arrival of the pulse at the focus, the mean and maximum radii of residual microbubbles generated in phantoms degassed to 20% saturation were observed to be 4.4 ± 0.4 and 11.2 ± 1.4 μm, respectively. In gas-saturated phantoms, the mean radius was 10.2 ± 0.9 μm and the radius of the largest bubble per pulse was 23.2 ± 4.8 μm. Figure 7 displays the dissolution behavior of the largest residual bubble of the population created by each pulse. The largest residual microbubble generated by each pulse persisted for 1.0 ± 0.4 s in gel at 20% gas-saturation and 170 ± 110 s gel at 100% gas-saturation before dissolving below the camera's resolution limit of 3 μm.
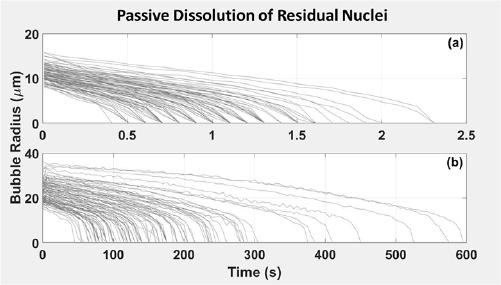
Figure 7. Passive dissolution behavior of residual microbubbles in gel at (a) 20% and (b) 100% gas saturation. Each line corresponds to the largest single bubble within a given population, each of which was generated by a separate histotripsy pulse. N = 100.
Download figure:
Standard image High-resolution image3.3. Bubble coalescence: proof of principle with an isolated focus
Representative high-speed imaging sequences of the coalescence behavior of residual nuclei at an isolated focus under the influence of low-gain regions of the therapy beam appear in figures 8(b) and (d). Frames corresponding to EFS positions 2:50 were captured when residual nuclei were at their approximate maximum re-excitement radii. In addition to driving BC, EFS pulses 2:50 provided a mechanism for interrogating the spatial distribution of residual nuclei which would otherwise be too small to resolve with the imaging equipment used. Control data appear in figures 8(a) and (c).
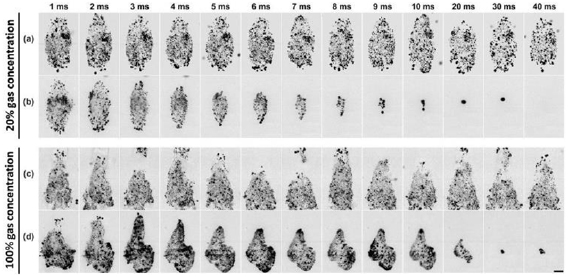
Figure 8. Representative high-speed imaging sequences of coalescence behavior of residual nuclei under the influence of low-gain regions of the therapy beam in gel with 20% (b) and 100% (d) gas concentration. Control image sequences in which only one EFS pulse is applied as a probe to the population of residual nuclei in gel with 20% (a) and 100% (c) gas concentration. The time of image capture relative to initial cavitation expansion appears above each column. PRF = 1 kHz for sequences (b) and (d). Scale bar = 1 mm.
Download figure:
Standard image High-resolution imageBC behavior was tracked by measuring the maximum projected extent of the residual microbubble population. PRFs tested ranged from 50 Hz to 5 kHz. These data are displayed in figure 9. For gels with 20% gas concentration, the number of pulses required to achieve BC ranged from 4.2 ± 0.6 pulses at 50 Hz PRF to 22.6 ± 7.0 pulses at 5 kHz PRF. For gels with 100% gas concentration, the number of pulses required to achieve BC ranged from 27.0 ± 9.6 pulses at 50 Hz PRF to 41.6 ± 3.3 pulses at 5 kHz PRF. No coalescence effect was observed for control data in which a single probe pulse was used. These results provide strong support for our hypothesis that low-gain regions of the transmitted sound field generated by a histotripsy transducer during EFS can be used to drive BC.
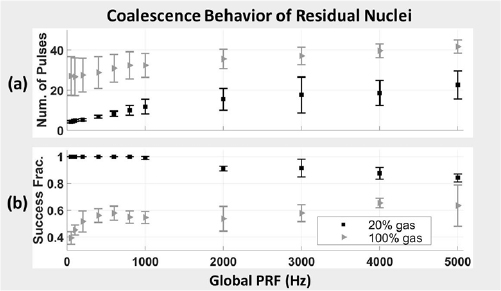
Figure 9. Coalescence behavior of residual nuclei at EFS position 1 under the influence of low gain regions of the therapy beam while electronically steering the therapy focus throughout EFS positions 2:50. (a) Mean number of pulses from EFS positions 2:50 required to achieve coalescence to a single bubble or dense bubble cloud no more than 1 mm in greatest dimension. Error bars represent ± standard deviation of successful samples. (b) Success fraction in achieving coalescence to a single bubble or dense bubble cloud no more than 1 mm in greatest dimension within 49 EFS pulses. Samples collected using gel with 20% gas concentration appear as black squares. Samples collected using gel with 100% gas concentration appear as grey triangles.
Download figure:
Standard image High-resolution imageThe complete disappearance of residual microbubbles within approximately 0–5 EFS pulses following complete coalescence was commonly observed in gel at 20% gas concentration treated with PRF ⩽ 1 kHz. In moderate-PRF cases (⩽100 Hz), bubble disappearance commonly preceded complete coalescence. These data are displayed in figure 10 and the final frame of figure 8(b). The annihilation of a cavitation bubble driven at high amplitude in degassed media has been described previously in the literature and is believed to result from high-amplitude surface instabilities which promote fission of the bubble into a very large number of very small daughter bubbles which then dissolve rapidly (Nyborg and Hughes 1967, Crum and Nordling 1972, Gaitan et al 1992, Krefting 2003, Mettin 2007). The size and number of daughter bubbles produced by fission may be dictated by the order of the surface oscillation mode present prior to collapse (Frost and Sturtevant 1986, Brennen 2002).

Figure 10. Annihilation of residual nuclei at EFS position 1 under the influence of low gain regions of the therapy beam while electronically steering the therapy focus throughout EFS positions 2:50 in agarose gel at 20% gas concentration. (a) Number of pulses required to achieve annihilation. Each datum represents the mean of successful samples ± standard deviation. (b) Success fraction for achieving annihilation. Each datum represents the mean of ten samples ± standard deviation.
Download figure:
Standard image High-resolution imageBy comparing the time required to achieve coalescence and annihilation of residual microbubbles, it can be seen that this active BC strategy is considerably faster than the passive approach. At 50 Hz PRF, the slowest PRF tested, the time required to remove all residual nuclei from gel at 20% gas concentration by BC and annihilation was 93 ± 13 ms compared to 1.0 ± 0.4 s relying on passive dissolution alone. While bubble annihilation was not observed at any PRF in gel with 100% gas concentration or for PFR >1 kHz in gel with 20% gas concentration, the consolidation of residual nuclei into a region 1 mm or less in diameter is expected to reduce the impact of the cavitation memory effect compared to the initial distribution of residual nuclei which encompassed the entire focal region. The time required to coalesce residual microbubbles to a region <1 mm in diameter was 84 ± 11 ms and 540 ± 190 ms using EFS-BC at 50 Hz PRF compared to 1.0 ± 0.4 s and 170 ± 110 s to achieve passive dissolution in gel with 20% and 100% gas-saturation, respectively.
In gel phantoms with 20% gas concentration, the success rate of achieving BC within 49 pulses decreased slightly with increasing PRF. BC was achieved in 100% ± 0% of cases for PRF ⩽ 800 Hz. BC was achieved in 98.9 ± 1.2% cases at 1 kHz PRF and in 84.1% ± 3.0% of cases at 5 kHz PRF. In gel phantoms with 100% gas concentration, the success rate for achieving BC increased somewhat with increasing PRF. Here, BC was achieved in 39.2% ± 4.7% of samples at 50 Hz PRF and 63.4% ± 15.3% of samples at 5 kHz. For all EFS BC tests, ten samples were collected for each PRF at new, untreated locations in the gel. Each sample location was treated with 100 bursts of the EFS sequence. Thus, values reported here represent the mean ± the standard deviation of 1000 EFS bursts.
3.4. Bubble coalescence: large-volume ablation
Representative images displaying the coalescence behavior of residual nuclei while executing a 1000-foci EFS sequence in transparent gel phantoms appear in figure 11. These images show the expansion of the de novo cavitation bubble cloud at the current EFS focus generated within the high-gain focal region of the therapy beam as well as re-excitement of residual nuclei persisting from previous pulses by lower-gain regions of the beam. BC behavior was assessed qualitatively by observing the spatial extent of residual bubble populations as a function of the number EFS-BC pulses they had experienced since their creation. For both gas concentrations tested, the current EFS focus was trailed by discrete populations of residual nuclei at locations corresponding to the EFS foci which recently preceded it. Consistent with results described in section 3.3, these populations of residual microbubbles diminished in spatial extent as a function of the number of EFS-BC pulses applied. For phantoms at 20% gas concentration, it was common for a cloud of residual nuclei generated by a given focus to disappear entirely after approximately ten subsequent EFS-BC pulses. For phantoms at 100% gas concentration, coalesced populations of residual bubbles were observed to persist for >50 pulses following their generation.
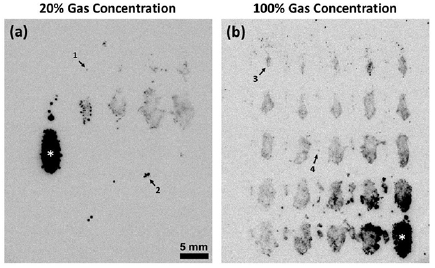
Figure 11. Images of bubble activity while executing a 1000-foci EFS grid in agarose gel phantoms at (a) 20% gas concentration and (b) 100% gas concentration. An asterisk indicates current EFS focus in each image. The time-interval of frame-capture was approximately 125–149 μs following firing the pulse. Progression of firing order was from left to right starting in the upper left corner of each image. Trailing the current foci are progressively more-coalesced clouds of residual nuclei generated by preceding pulses. Arrow 1 indicates the smallest visible coalesced bubble trailing the current EFS focus in image (a). Arrow 2 indicates an example of a small cluster of bubbles persisting for approximately 22 pulses at the time of frame-capture. Arrow 3 indicates a population of bubbles generated 24 pulses prior to the current pulse and having undergone nearly complete coalescence. Arrow 4 indicates a faintly visible coalesced population of bubbles generated 38 pulses prior to the current pulse. These images suggest that the number of pulses necessary to achieve BC in a 1000-foci grid is consistent with data displayed in figures 8–10 in which a single focus in isolation was monitored. PRF = 1 kHz. Direction of ultrasound propagation was from bottom to top of images. Scale bar applies to both images. Supplementary video 1 corresponds to figure 11(a). Supplementary video 2 corresponds to figure 11(b) (available at stacks.iop.org/PMB/63/225010/mmedia). 20 frames were collected per histotripsy pulse at 40,000 frames/s as described in section 2.5.1.
Download figure:
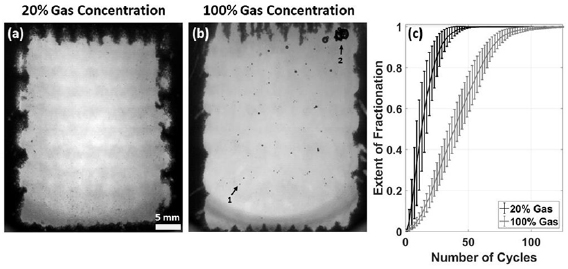
Standard image High-resolution imageTo demonstrate the therapeutic capacity of the EFS-BC technique, RBC phantoms were treated with the same acoustic parameters applied to transparent gels as described in section 2.5.1. Representative images of lesions generated in RBC phantoms at 20% and 100% gas concentration appear in figures 12(a) and (b), respectively. For RBC phantoms at 20% gas concentration, 59.5 ± 12.1 repetitions of the EFS sequence were found to be sufficient to achieve 99.9% fractionation, corresponding to a treatment rate of 27 ± 6 ml min−1. For RBC phantoms at 100% gas concentration, 123.4 ± 14.5 repetitions were found to be sufficient to achieve 99.9% fractionation, corresponding to a treatment rate of 13 ± 2 ml min−1. Figure 12(c) displays the progression of fractionation as a function of the number of repetitions of the EFS grid. These data support the applicability of the EFS-BC technique for large-volume ablation using a large 3D steering grid.
Figure 12. Treatment of RBC phantoms with a 1000-foci EFS grid. (a) Representative image of RBC phantom with 20% gas concentration following the application of 60 repetitions of 1000-foci EFS grid. (b) Representative image of RBC phantom with 100% gas concentration following the application of 123 repetitions of 1000-foci EFS grid. Arrow 1 indicates an example of a bubble likely coalesced from a single EFS focus and characteristic of those generated in the experiment described in section 2.4. Arrow 2 indicates a cluster of large bubbles resulting from a secondary coalescence process in which the coalesced bubbles from multiple foci would agglomerate, translate toward the distal portion of the lesion, and merge. This phenomenon was observed following approximately 90 repetitions of the 1000-foci EFS grid. Direction of ultrasound propagation was from bottom to top of images. (c) Progression of fractionation as a function of the number of repetitions of the EFS grid applied to the phantom. A value of 0 represents no fractionation and a value of 1 represents complete fractionation. PRF = 1 kHz. Each datum and error bar represent the mean and standard deviation, respectively, of five samples. Supplementary video 3 corresponds to figure 12(a). Supplementary video 4 corresponds to figure 12(b). One frame was collected per repetition of the EFS grid as described in section 2.5.2. The number of repetitions is displayed in the upper left corner of each video and the extent of fractionation appears in the upper right.
Download figure:
Standard image High-resolution image
4. Discussion
This study demonstrates a novel acoustic technique for driving the coalescence of residual nuclei by using low-gain regions of the therapy beam during EFS. Similar to previous BC studies, the technique directs short bursts of low-amplitude ultrasound to promote the aggregation and coalescence of residual nuclei mediated by the secondary Bjerknes force (Duryea et al 2014, 2015a, 2015c). However, rather than using an acoustic sequence separate from therapy pulses as in those previous studies, the technique described herein utilizes low-gain regions of the therapy beam to drive BC. By employing specially-designed EFS sequences, each pulse serves the dual-purpose of generating cavitation at the present EFS therapy-focus as well as driving BC at recently treated foci which harbor populations of residual microbubbles. This EFS-BC method is expected to increase ablation speed without the deposition of additional acoustic energy associated with a traditional, separate BC sequence. The ultimate treatment rate of histotripsy in vivo is limited by the cavitation memory effect and the heating of tissue surrounding the therapy target. The findings in this study are significant in part because they demonstrate proof of principal regarding management of residual nuclei without the deposition of any additional acoustic energy during histotripsy therapy.
The mechanism responsible for bubble coalescence is postulated to be the secondary Bjerknes force (Mettin 2007, Duryea et al 2014). The mutual force between two microbubbles under the influence of the secondary Bjerknes force varies with the inverse of the square of their separation distance (Bjerknes 1906, Kornfeld and Suvorov 1944, Blake 1949, Rosenberg 1953). The dynamics of a cloud of insonified residual microbubbles can be described as an N-body problem somewhat analogous to gravitational interactions in a galaxy or the electromagnetic interactions in a plasma where the system possesses a volumetric centroid (Bjerknes 1906, Crum 1975, Barbat et al 1999, Mettin 2007). In this study, clouds of residual microbubbles under the influence of EFS-BC pulses, coalesced to the approximate centroid of the initial distribution of residual nuclei within the focal zone. While the cloud and coalesced bubble(s) were observed to translate slightly in aggregate away from the transducer due to the primary Bjerknes force, the mutual attraction mediated by the secondary Bjerknes force dominated the motion of individual microbubbles within the cloud. Nonlinear behavior encountered at high driving pressures is likely responsible for the disparity in the magnitude of the two Bjerknes forces. Mettin et al found that at high driving pressures, the magnitude of the secondary Bjerknes force may increase by a factor of 103–106 relative to the linear response associated with lower pressures (Mettin et al 1997). The nonlinear regime for the secondary Bjerknes force begins at approximately 50 kPa (Oguz and Prosperetti 1990, Mettin et al 1997, Doinikov 2003, Jiao et al 2015). Pressures experienced at EFS position 1 while firing at EFS positions 2:50 (P+, P − =3.5 ± 0.7, 2.7 ± 0.6 MPa) were two orders of magnitude higher than the threshold for nonlinearity. Additionally, the radius of a single bubble linearly resonant at driving frequency of 250 kHz is 11.1 μm (Minnaert 1933, Leighton 1994) which is within the range of residual nuclei generated in the present study.
The number of pulses required to achieve BC was consistently higher for gel phantoms with 100% gas concentration compared to those with 20% as displayed in figure 9. While a precise formulation of the relevant bubble dynamics is beyond the scope of this study, the authors hypothesize that the greater number, number density, and spatial distribution of residual bubbles generated at 100% gas concentration and the potential of these microbubbles to grow by rectified diffusion to well beyond resonance size are likely responsible for the disparity. Additionally, it was observed that for both gas concentrations tested, the number of pulses required to achieve BC increased with PRF, the trend being more pronounced at 20% gas concentration. The authors attribute this trend to passive dissolution of very small bubbles between pulses. Control data for gel phantoms at 20% gas concentration indicate that expanded bubbles near or below the high speed camera's resolution limit (~8 μm diameter) which appear as a haze between larger, individually resolvable bubbles are no longer detectable after approximately 10 ms as displayed in figure 8(a). The theory of Epstien and Plesset applied here predicts that dissolution times <10 ms would correspond to bubbles with static radii of < ~1 μm (Epstein and Plesset 1950, Kapodistrias and Dahl 2012, Bhunia et al 2016).
The per-pulse fractionation rate observed for the 1000-foci EFS grid applied to RBC phantoms at 20% gas concentration is approximately twice as fast that observed in a previous study using similar acoustic parameters in which fractionation progression at a single lesion was monitored (Lundt et al 2017). The authors attribute this increase in per-pulse efficiency to the BC effect and to greater mobility of material within the 1000-foci lesion boundary. It was observed that during the first approximately 15 EFS sequence repetitions, fractionation occurred primarily at discrete locations centered about the EFS points with material between EFS points remaining largely unfractionated and stationary. After approximately 15 repetitions, unfractionated material could be seen translating in directions generally inward from the lesion perimeter and opposite the direction of ultrasound propagation. This result suggests that the destructive capacity of a cavitation cloud is most pronounced near its center and that perhaps a more finely-spaced EFS grid would facilitate a greater per-pulse fractionation efficiency. While the FPGA digital circuit driving system used in the present study was limited to distributing 1024 EFS positions throughout 27 ml, an EFS sequence could be conceived in which each of the total number of pulses (=Nfoci * Nrepetitions) delivered throughout the treatment would correspond to a unique spatial position within the treatment volume. Such an approach would more homogeneously distribute what appears to be the most efficient portion of each focus, thereby better utilizing its ablation capacity. By comparison, ablation rates common for thermal ablation using high-intensity focused ultrasound (HIFU) and radio frequency (RF) ablation are approximately 2 ml min−1 (Gazelle et al 2000, Shiina et al 2005, Köhler et al 2009, Kim et al 2012).
The EFS-BC technique is intended to accelerate the large-volume ablation such as tumors in the liver, kidney, and pancreas. The two limiting factors for treatment speed for histotripsy are the cavitation memory effect and the risk of heating. Previous studies have suggested that it may be advantageous to arrange an EFS sequence strategically for volume ablation such that spatial positions of temporally adjacent EFS foci are separated sufficiently in space so that residual nuclei do not compromise therapeutic cavitation activity (Duryea et al 2015a, Lundt et al 2017). Using a passive strategy like this for the management of residual nuclei, treatment speed is ultimately constrained by the dissolution time of residual nuclei and the steerable range of the transducer. The BC effect observed herein is likely inherent to any EFS sequence to some extent and is believed to account partly for the enhanced efficiency of EFS over mechanical steering alone (Zhang et al 2016). However, a strategic EFS-BC sequence is fundamentally different from an EFS sequence based on passive dissolution in that the management of residual nuclei is based on the number of pulses required to achieve BC rather than a fixed dissolution time. Additionally, previous studies using separate BC sequences achieved BC but deposited 30% additional acoustic energy. When using a high PRF to achieve a high ablation rate for a large-volume target, the additional acoustic energy may pose the risk of heating overlying and surrounding tissue. The EFS-BC technique demonstrated herein has the potential to remove the need for the additional energy deposition associated with a separate BC sequence. In the present study, we demonstrate the use of a strategic EFS-BC sequence to treat a large volume. The presented EFS-BC method may allow us to circumvent the limiting factors of cavitation memory effect and the risk of heating, thus enabling a more rapid ablation of a large volume.
While the present study was restricted to the intrinsic threshold regime of histotripsy (also referred to as microtripsy) (Lin et al 2014), it is expected that the EFS-BC technique described herein would be applicable for pulsing regimes with a greater number of acoustic pulse cycles including shock scattering (Maxwell et al 2011a) and boiling histotripsy (Khokhlova et al 2011). In these cases, the additional cycles may drive BC more rapidly. For shock scattering, the persistence of a large coalesced bubble, located centrally within each EFS location could be particularly beneficial as it could function as a scattering target for subsequent pulses and perhaps alleviate some of the need for sustaining pulses (Wang et al 2012, Park et al 2013). Similarly, for boiling histotripsy, the more rapid formation of such a centrally located bubble could be beneficial if the proposed mechanism of action is indeed ultrasonic atomization (Simon et al 2012).
Outside of the potential to accelerate histotripsy volume treatment, the BC effect demonstrated for gels at 100% gas concentration generates a large, relatively stable bubble with several noteworthy features. In the experiments which monitored an isolated EFS focus and using gel phantoms with 100% gas concentration, at least one bubble with a static radius ⩾10 μm was found to persist for the 5 s between EFS bursts in all but 63 of 11 000 EFS bursts applied. This phenomenon was not observed in any gel with 20% gas concentration. The size of the largest bubble persisting between cycles was found to increase with PRF and cycle number. This bubble was found to be as large as 96 μm in static radius and would be expected to persist for many minutes before dissolving. Several studies have demonstrated the potential of microbubbles for aberration correction (Psychoudakis et al 2004, Pernot et al 2006, Haworth et al 2008, Gateau et al 2011). The BC technique described in the present study has the potential to provide a single, quasi-stable scattering target for aberration correction completely noninvasively and without the need for any exogenous contrast agent.
5. Conclusion
Heat deposition and the cavitation memory effect impose ultimate treatment rate limitations on histotripsy. This study demonstrates proof of principle regarding a novel method for mitigating the cavitation memory effect by utilizing low-gain regions of the therapy sound field to drive the aggregation and coalescence of residual nuclei by means of the secondary Bjerknes force during electronic focal steering. Because the technique utilizes each pulse for the dual-purpose of generating cavitation at the current therapy focus as well as driving bubble coalescence, it is more energy-efficient than using a separate acoustic sequence. By addressing the cavitation memory effect without the deposition of any additional heat beyond that of the therapy sequence, the technique described in this study has the potential to elevate the achievable treatment rate of histotripsy volume ablation using electronic focal steering.
Acknowledgments
This work was supported by a grant from National Cancer Institute of the National Institutes of Health under Award Number R01-CA211217, a Research Scholar Grant from the American Cancer Society (RSG-13-101-01-CCE), a grant from National Institute of Biomedical Imaging and Bioengineering (NIBIB) of the National Institutes of Health under Award Number R01EB008998, and a grant from National Institute of Neurological Disorders and Stroke (NINDS) of the National Institutes of Health under Award Number R21NS093121. Disclosure notice: Drs Tim Hall, Charles Cain and Zhen Xu have financial interests and/or other relationship with HistoSonics Inc.