

Abstract
The 0.35 T 60Co MRIdian system (ViewRay Inc., Mountain View) has been in clinical use in our institution since May 2016. For quality assurance (QA) of dose delivery and end-to-end testing for this machine, a reliable dosimeter is required. However, it is possible that a magnetic field may cause perturbations to dosimetry measurements. For static magnetic fields, there is conflicting information in the literature concerning EBT film behaviour, while for real-time MR imaging such information is not available at all. The purpose of this study was to investigate the suitability of EBT3 GafChromic film for MRIdian QA, both with and without real-time MR imaging.
EBT3 film sheets were irradiated in water using the MRIdian and a conventional linear accelerator (Linac) for reference. Dose calibration measurements were first performed up to 8 Gy for both machines. The MRIdian measurements were performed with and without real-time MR imaging. Second, film sheets were irradiated at seven different angles with respect to the B0-field. Optical density and dose values were analysed for the three colour channels.
In both the film dose-response and B0-field orientation measurements, the mean dose values were within the 1% uncertainty range of prescribed dose values for the red and green channels, for both machines. There were no dose deviations detected between the MRIdian and Linac film measurements, nor for different B0-field orientations. In addition, the film dose-response measurements during real-time imaging were within 1.5% of the reference Linac measurements.
EBT3 GafChromic film can be used for absolute dosimetry during real-time MR imaging independent of its orientation in the B0-field. This makes it a suitable dosimeter for patient-specific QA measurements and end-to-end testing of 0.35 T MRI-radiotherapy devices.
Export citation and abstract BibTeX RIS
1. Introduction
The first MR-guided radiotherapy unit, which became clinically available, is the 0.35 T 60Co MRIdian system (ViewRay Inc., Mountain View). The MRIdian system consists of a rotating gantry with three 60Co sources and an integrated 0.35 T whole-body MRI system. A detailed description of the system has been provided by Mutic and Dempsey (Mutic et al 2014). Since then, daily online MR-guided adaptive radiotherapy has become routine in several institutions and recent studies have featured its potential clinical advantages (Acharya et al 2016, Bohoudi et al 2017, Bruynzeel et al 2017, Fischer-Valuck et al 2017, Palacios et al 2017, Henke et al 2018).
Stereotactic MR-guided adaptive radiation therapy is now daily routine in our institution. For safe implementation of an MR-guided radiotherapy program in clinical practice, two essential aspects need to be considered: (1) patient-specific quality assurance (QA) of the intended absolute dose and (2) comprehensive end-to-end testing to ensure an accurate delivery of the intended dose. For these purposes an appropriate and easy to use dosimeter applicable in a (fluctuating) magnetic field is required, as it has been reported that the magnetic field affects the QA equipment and dosimetry measurements (Reynolds et al 2013, 2014, Smit et al 2013, 2014a, 2014b, Houweling et al 2016). For ionization chambers, it has been observed that the degree of disturbance depends on the magnetic field strength and geometric orientation of the ionization chamber with respect to the beam and magnetic field (Meijsing et al 2009). However, the majority of these dosimetry devices are not easy to use in a magnetic field. Several corrections must be applied to derive the delivered dose and the geometric setup is limited or cannot be used for the required patient-specific QA in MR-guided radiotherapy.
Our institution has vast experience in film dosimetry for dosimetric plan QA and end-to-end testing (van Battum et al 2008, 2009, 2016). EBT3 GafChromic film (Ashland Inc.) is a suitable tool for absolute 2D measurement of photon beams. It has high spatial resolution, near-tissue equivalence and very little energy dependence for megavoltage photon beam energies (Bekerat et al 2014). Furthermore, GafChromic films have no macroscopic paramagnetic properties (i.e. experience shows there is no attraction to the 0.35 T magnet of the MRIdian), can be handled in daylight and may be cut into pieces for use in phantoms of various shapes.
EBT3 film consists of an active layer and two outer polyester layers. The active layer comprises rod-shaped crystals containing monomers and a dye. The uniformity of the monomer-dye ratio per crystal is essential for accurate film dosimetry. When EBT3 film is exposed to ionizing radiation, a polymerization process occurs in the active layer, whereby monomers are converted into dipole polymers (McLaughlin et al 1996). The number of polymers is related to the delivered dose, which is indicated by the changing optical density (OD) of the film, and can therefore be read-out by a commercial flatbed scanner. Various factors can affect the relationship between polymer conversion and response to dose. Earlier research has shown (van Battum et al 2016) that the film read-out per pixel (R(x,y)) is influenced by film-induced light polarization of the scanner light beam, variation in optical path length, and cross talk, i.e. light scattering on the film (Schoenfeld et al 2014, 2016). The magnitude of these influencing factors increases with dose due to the creation of more dipole polymers per crystal. In addition, the orientation of the film with respect to the scanner also affects R(x,y), resulting in over- or underestimating the dose. This is because as the polymers are created, they have a preferred orientation due to the manufacturing process (van Battum et al 2016).
The use of GafChromic film in a magnetic field requires thorough investigation since the polymerization process and the preferred polymer orientation might be influenced by the presence of a magnetic field (Chiriac et al 2000), with or without real-time MR imaging. The exact physical mechanism underlying the effect of a magnetic field on the polymerization process is not completely understood. Our hypothesis is that both the static magnetic field and radiofrequency (RF) energy during imaging can play a role in the film dose-response relationship. The static magnetic field might influence the polymer amount and orientation. Involved monomers become charged for a fraction of time due to the loss of one or more electrons induced by radiation. First, the effect of the magnetic field on those monomers is unknown. Second, the final effect of the Lorentz force on the free electrons in the crystal, for instance creating unequal distribution of ionized monomers in that crystal, is unknown. In addition, the created polymers constituting the film might also align according to the uniform static magnetic field, a process which is also dependent on the field strength. The result is that the created polymers might be changed in amount as well as in their preferred orientation in comparison with the situation without a magnetic field. When film is used during imaging, the RF energy can play an additional role in the chemical polymerization process. These changes in polymer amount and orientation might result in a different absorption property for red, green and blue light, and thus a change in dose value, when using a flatbed scanner as the read-out system. Arguments against our hypothesis can also be given. For instance, high-energy electrons created with Compton scattering travel over several crystals counterbalancing the suggested unequal ionized monomer distributions in crystals. Overall, the final effect on absolute dose due to the presence of a magnetic field should be experimentally determined.
In the literature, Reynoso et al (2016) reported that the EBT2 film response in a 0.35 T machine decreased by up to 15% in the red and green channels. In a similar way, Reyhan et al (2015) showed a decrease in the dose-response relationship of films that were exposed to a 1.5 T static magnetic field. They described a correction when using GafChromic EBT2 film for absolute dosimetry in MRI-radiotherapy systems. Furthermore, they reported that overestimation of the dose increased with the Specific Absorption Rate (SAR) of the sequence being used. Raaijmakers et al (2007) reported a possible underdose effect in films that were exposed to the magnetic field and characterized the effect of the field strength on the polymerization process and GafChromic film response. Research by Delfs et al (2018) showed only a small effect of the magnetic field on the dose-response relationship of EBT3 film. Remarkably, other authors have used film dosimetry in a magnetic field for commissioning and evaluation studies, and have reported satisfactory results (Park et al 2015, Wooten et al 2015, Li et al 2015).
The aforementioned studies highlight the interest in film dosimetry in a magnetic field. However, the results reported in the literature on the effect of the static B0-field on the film read-out are conflicting and, as mentioned before, the physical process behind why the presence of a magnetic field might have an influence on film dose-response relationship can be discussed. In addition, a comprehensive investigation of EBT3 GafChromic film in a clinically available 0.35 T 60Co machine, i.e. during real-time MR imaging, has not yet been performed. The focus of the present study, therefore, was to perform a systematic investigation into the dose-response relationship of EBT3 GafChromic film in the presence of a magnetic field at 0.35 T. The aim was to assess the suitability of EBT3 film for QA purposes in 0.35 T MR-guided radiotherapy, (a) up to dose levels of 8 Gy, (b) at different orientations relative to the B0-field and (c) during real-time MR imaging.
2. Materials and methods
As mentioned above, the film orientation with respect to the B0-field might influence the film dose-response due to the underlying magnetic field influence on the polymerization process or polymer orientation in the film. Furthermore, during MR imaging the RF pulses deposit RF energy, which may also influence these processes. In this research, 'real-time' MR imaging refers to the MR imaging that was acquired during film irradiation. To generate this image RF pulses are transmitted, in contrast to 'without real-time' MR imaging, where only the static B0-field was present.
From previous research it can be concluded that the OD value obtained with an Epson flatbed scanner is proportional to the polymer orientation and magnitude of the polymerization process (van Battum et al 2016). Our hypothesis is that the OD value changes in magnitude if the B0-field or RF-energy deposit influences the polymerization process or the orientation of the polymers. In order to investigate this hypothesis, we have used a specific experimental setup and analysis.
3. Experimental setup
GafChromic EBT3 film sheets were cut into pieces (6.8 × 6.4 cm2) and on each film piece the original portrait orientation of the sheet was marked. The film pieces were irradiated with open fields in a 40 × 38 × 33 cm3 water phantom using the MRIdian system. For the MRIdian measurements, the field strength corresponds to 0.35 T at the film irradiation position.
For comparison, the same experimental setup was used to measure the films on a Linac (Varian 2300C/D, 6 MV), a system without a magnetic field. On both machines, film calibration measurements and film orientation measurements were performed (see explanation below). Table 1 shows the experimental conditions. Films from the same batch were used for both MRIdian and comparison Linac measurements. Due to a limited batch availability before the end of this research, a different film batch had to be used for the real-time MR imaging measurements. To avoid any impact on the results, experiments '3.1' and '3.3' were analysed separately.
Table 1. Reference conditions for film calibration, B0-field orientation influence and real-time MRI measurements.
| 3.1. Film calibration | 3.2. B0-field orientation | 3.3. Real time MRI | ||||
|---|---|---|---|---|---|---|
| MRIdian | Linac | MRIdian | Linac | MRIdian | Linac | |
| Field size | 10.5 × 10.5 cm2 | 10 × 10 cm2 | 10.5 × 10.5 cm2 | 10 × 10 cm2 | 10.5 × 10.5 cm2 | 10 × 10 cm2 |
| Depth | 5.0 cm | 1.5 cm | 5.0 cm | 5.0 cm | 5.0 cm | 1.5 cm |
| SSD | 100 cm | 100 cm | 100 cm | 100 cm | 100 cm | 100 cm |
| Dose | 1–8 Gy | 1–8 Gy | 3 Gy | 3 Gy | 1–8 Gy | 1–8 Gy |
| Energy | 60Co | 6 MV | 60Co | 6 MV | 60Co | 6 MV |
3.1. Film calibration measurements
Two film pieces were positioned in the water phantom at the machine-specific dosimetric reference depth of 5 and 1.5 cm, for the MRIdian system and Linac, respectively, with the film surface perpendicular to the beam axis. Figures 1(a) and (b) shows a schematic representation of the experimental setup. The film calibration measurements were performed four times with eight dose levels up to 8 Gy on both the MRIdian and Linac.
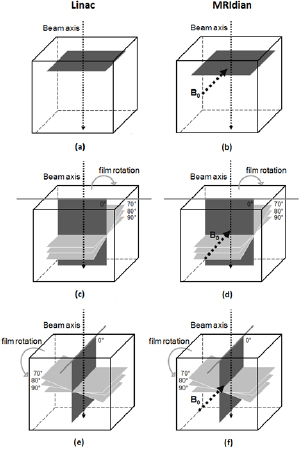
Figure 1. Schematic representation of the experimental setup for ((a) and (b)) film calibration measurements and ((c)–(f)) B0-field orientation influence measurements for the Linac (left) and MRIdian experiments (right). (c) and (d) Frontal orientation: in MRIdian experiments a B0-field is present and perpendicular to the film surface in its initial position. (e) and (f) Sagittal orientation: in MRIdian experiments a B0-field is present and parallel to the film surface in its initial position.
Download figure:
Standard image High-resolution image3.2. B0-field orientation influence
In order to investigate the film dose response at different film orientations with respect to the B0-field two initial film orientation setups were used: the frontal and sagittal orientation, with the film surface perpendicular and parallel to the B0-field, respectively (figure 1). From this starting orientation, film pieces were rotated in the B0-field, varying the crystal structure orientation of the film with respect to the B0-field (figures 1(c)–(f)). The same experimental set-up and film orientations were employed in both experiments, MRIdian and Linac.
A rotatable device was used to position the film sheets in the water phantom at each particular orientation with respect to the B0-field (figure 2). The film sheet was fixed on two sides in the device. Due to this rigid construction, sagging and bending of the film pieces was negligible. Starting at the frontal and sagittal orientation, the film pieces were rotated over seven angles from 0°–90°, and each was irradiated separately with 3 Gy. Since the measurement time was long, due to the low dose rate of the 60Co sources, and since a high sensitivity of both the red and green channels was required, only 3 Gy was investigated for the influence of the B0-field orientation. The film rotation point was aligned at the isocentre (at SSD 100 cm and 5 cm depth for both machines). In contrast to the Linac film calibration measurements, a depth of 5 cm was used for the orientation measurements, so that the film would be immersed in water at all angles. For each orientation, four measurement series were performed on both machines on separate days.

Figure 2. Photographic representation of the rotatable device, with a film sheet at angle 90° (left) and 45° (right) parallel to the B0-field.
Download figure:
Standard image High-resolution image3.3. Real-time MR imaging
The third experiment was designed to investigate the influence of RF pulses during irradiation. In 1978, the potential for RF power deposition and unwanted heating of the human body during MR imaging was described (Bottomley et al 1978). Hypothetically, during simultaneous irradiation and imaging, the RF energy might cause additional energy deposition, which is measured by SAR (in W kg−1 or W cm−3). The SAR varies quadratically with the field strength and flip-angle, and is proportional to the sample radius at lower frequencies (<100 MHz) (Stralka et al 2007, Bottomley 2008).
In order to investigate the effect of SAR at different dose levels, film calibration measurements were performed with dose levels up to 8 Gy on the MRIdian. The measurements were performed with RF pulses (real-time MR imaging) and without RFpulses (static B0-field only). As a proof-of-principle, one clinical imaging sequence was used to determine the effect of RF energy. The sequence corresponds to 0.35 T at the isocentre position, 60° flip angle, 2.1 ms repetition time, 0.91 ms echo time, number of averages 2, read-out bandwidth of 1351 Hz/px, 7.0 mm slice thickness and 1 × 1 mm2 pixel spacing.
The MRIdian calibration measurements were then again compared with calibration measurements on the Linac for the same film batch. For both machines, an identical experimental setup was used, as described in paragraph 3.2. The MRIdian measurements with and without RF pulses were performed during the same session. Linac measurements were performed without any type of imaging during irradiation.
3.4. Film analysis
All film pieces were scanned in portrait orientation with an Epson Expression 1680 Pro flatbed scanner in transmission mode 24 h after irradiation. The images were obtained in 48-bit RGB modus at 72 dpi and saved in TIFF format. For each film, the OD value for the red, green and blue channel was determined in a 2 × 2 mm area, located in the film rotation point coinciding with the isocentre, as a function of the irradiated dose value delivered. The OD value was computed as:

where I0(x,y) is the incident light intensity and It(x,y) is the transmitted light intensity detected by the scanner, both at pixel position (x,y) on the film. To eliminate any influence of the flatbed scanner over all film output measurements (van Battum et al 2016), a template was used for the scanning process to position each film piece at a reproducible location at the central scanner axis, so that the measuring point (film rotation point) was always located at the same position at the scanner glass plate. Furthermore, 16 warm-up scans were performed before scanning the film sheets (and empty-glass plate corrections were made in calculating OD values (I0(x,y)). Note that there was no unirradiated film measurement, since low dose signals yield large uncertainties, which makes it difficult to distinguish very small influences in OD.
For each measurement session, the corresponding dose response curve was used to obtain the dose (Gy) from OD values for the red and green colour channels, separately, for analysis of the B0-field orientation measurements. The blue channel signal was considered as the control signal, since all film pieces of the same film batch should yield the same dose response ratio of the red–blue and green–blue channels within experimental uncertainty for the same dose delivered. Measured dose values were compared to expected dose values.
4. Results
4.1. Film calibration measurements
Figure 3 shows the mean dose-response curves (OD versus dose) for each colour channel, separately, for the MRIdian and Linac, as well as the difference in OD measurements between both experiments. As can be seen from figure 3, both dose-response curves are almost identical and the maximum difference in OD value found was 0.9% for the red channel irradiated with 8 Gy.
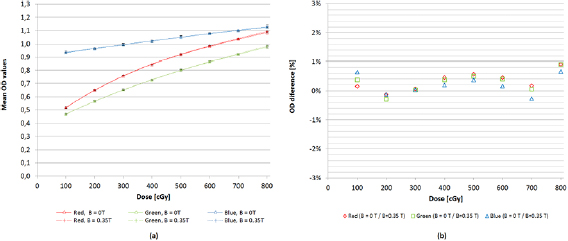
Figure 3. (a) Dose-response curves with mean OD values for each individual dose level between 0–8 Gy for the red, green and blue channel, respectively, with the magnetic field (MRIdian, dashed line) and reference (Linac, solid line) (N = 4). Symbols represent the measuring points (mean values) and the curves were calculated using a third-degree polynomial fit (b) percentage difference in mean OD values between MRIdian and Linac measurements for each dose value.
Download figure:
Standard image High-resolution imageFirst, the mean OD and its standard deviation (1 SD) was calculated over four measurements with the same dose delivery, for each dose point and colour channel, both for the MRIdian and Linac experimental setup. Second, over all dose values the mean, maximum and minimum values of the relative standard deviation (RSD) for all three colour channels were calculated (table 2). The mean RSD was found to always be ⩽0.9% for both MRIdian and Linac experiments.
Table 2. Mean, minimum and maximum RSD of OD values for film calibration measurements.
| MRIdian | Linac | ||||||
|---|---|---|---|---|---|---|---|
| Red | Green | Blue | Red | Green | Blue | ||
| Calibration plane | Mean RSD | 0.41% | 0.61% | 0.58% | 0.47% | 0.68% | 0.53% |
| Min RSD | 0.21% | 0.32% | 0.38% | 0.09% | 0.32% | 0.27% | |
| Max RSD | 0.72% | 1.07% | 0.88% | 1.01% | 1.19% | 0.93% | |
4.2. B0-field orientation influence
Figure 4 shows the percentage difference in OD values between frontal and sagittal orientation as a function of the angle of beam incidence. In both experimental conditions, MRIdian and Linac, the difference in OD values between frontal and sagittal orientation was less than 1%, irrespective of the film orientation angle.
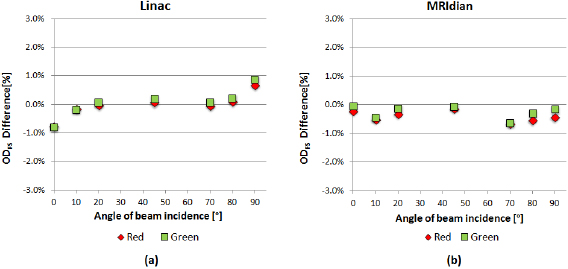
Figure 4. Percentage difference in mean OD value between frontal and sagittal orientation (ODFS) for the red and the green channel averaged over all measurements (N = 4) for both (a) the Linac and (b) the MRIdian experiments.
Download figure:
Standard image High-resolution imageThe mean, minimum and maximum RSD for the red, green and blue channels averaged over all film rotation angles for both the MRIdian and Linac B0-field orientation measurements are summarized in table 3. For both treatment units and all three colour channels the mean RSD (1 SD) of the OD values averaged over all film rotation angles was ⩽0.7%.
Table 3. Mean, minimum and maximum RSD of OD values for B0-field orientation influence measurements.
| MRIdian | Linac | ||||||
|---|---|---|---|---|---|---|---|
| Red | Green | Blue | Red | Green | Blue | ||
| Frontal orientation | Mean RSD | 0.44% | 0.59% | 0.29% | 0.18% | 0.27% | 0.24% |
| Min RSD | 0.17% | 0.20% | 0.07% | 0.12% | 0.25% | 0.25% | |
| Max RSD | 1.50% | 2.06% | 0.97% | 0.63% | 1.08% | 1.01% | |
| Sagittal orientation | Mean RSD | 0.66% | 0.69% | 0.60% | 0.40% | 0.53% | 0.66% |
| Min RSD | 0.65% | 0.59% | 0.20% | 0.38% | 0.32% | 0.25% | |
| Max RSD | 0.12% | 0.19% | 0.18% | 0.15% | 0.27% | 0.26% | |
The mean dose in frontal and sagittal orientation in both the MRIdian and Linac measurements is within 1.0% uncertainty range for the red and green channels (figure 5), where 3 Gy was the intended dose.

Figure 5. Mean dose values averaged over all film angles and measurements for both MRIdian and Linac experiments. Dotted lines represent +1% and −1% bandwidth of the intended dose of 3 Gy.
Download figure:
Standard image High-resolution image4.3. Real-time MR imaging
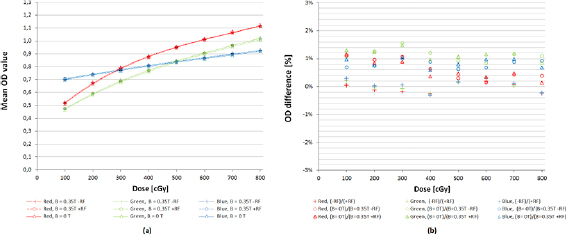
Figure 6 shows the mean dose-response curves for each colour channel, separately, for the real-time MRI measurements including the MRIdian, with (+RF) and without RF (−RF) energy, and Linac measurements. Figure 6(b) shows the difference in OD between these MRIdian and Linac experiments. The maximum difference in OD value found was between Linac and MRIdian −RF, which was 1.5% for the green channel irradiated with 3 Gy. This 1.5% difference corresponds to an absolute difference of 0.0108 OD, which is approximately a dose difference of 7 cGy. The percentage difference of the mean OD values between the (+RF) and (−RF) measurements is lower than 0.3%.
Figure 6. (a) Dose-response curves with mean OD values for each individual dose level between 0–8 Gy for the red, green and blue channel, respectively, with magnetic field (MRIdian, dashed line (−RF) and striped line (+RF), respectively) and reference (Linac, solid line) (N = 4). Symbols represent the measuring points (mean values) and the curves were calculated using a third-degree polynomial fit (b) percentage difference in mean OD values for each dose value for the three comparisons: MRIdian(−RF)/MRIdian(+RF), Linac/MRIdian (−RF) and Linac/MRIdian(+RF).
Download figure:
Standard image High-resolution image
5. Discussion
A safe implementation of MR-guided radiotherapy in the clinic requires end-to-end tests and dosimeters, which can be used in the presence of the magnetic field. In this study, we presented a detailed characterization of EBT3 GafChromic film in the presence of a 0.35 T magnetic field and compared the obtained results with those in the absence of the magnetic field.
We have found a small deviation of less than 1.5% in EBT3 GafChromic film dose response after irradiation with a MRIdian treatment unit at 0.35 T compared to the conventional Linac. These results are in line with a recent publication by Delfs et al (2018).
Different results were obtained by other groups (Reyhan et al 2015, Reynoso et al 2016), who reported a dose dependent on the response of EBT2 film in the presence of a magnetic field. A possible explanation for this difference could be the use of EBT2 instead of EBT3 in their experiment, the latter having been improved with a symmetrical support-layer construction and anti-Newton ring coating. In order to ascertain the exact cause of the discrepancy between both results, a study on film dose response in a 0.35 T including different film constructions such as EBT2, EBT3 and EBTXD film is warranted. In addition, Reyhan et al (2015) performed their measurements by imaging films in a separate 1.5 T MR scanner and irradiating films either before or after exposure to the magnetic field. This makes a comparison with our measurements in an integrated MRI irradiation system at 0.35 T not straightforward.
The difference in dose-response measurements with and without RF energy for the real-time experiment are within experimental uncertainty (mean RSD < 1%).
We can therefore conclude that the RF energy during real-time imaging has a negligible impact on the film dose-response measurements. It is worth noting that the design of this experiment included a repetition of the film calibration measurements described in section 3.1. A small difference between experiment (a) and (c) is that a different film batch was used in (c), which consequently resulted in different film dose-response curves. The results of both experiments show an overall excellent agreement with a maximum difference between the Linac and MRIdian (−RF) calibration measurements of 0.9% and 1.5% for both experiments (a) and (c), respectively. The small difference of 0.6% found is within the reported maximum uncertainty (see tables 2 and 4).
Table 4. Mean, minimum and maximum RSD of all OD values for SAR influence measurements.
| MRIdian | MRIdian | Linac | |||||||
|---|---|---|---|---|---|---|---|---|---|
| B = 0.35 T, −RF | B = 0.35 T, +RF | B = 0 T | |||||||
| Red | Green | Blue | Red | Green | Blue | Red | Green | Blue | |
| Mean RSD | 0.37% | 0.51% | 0.63% | 0.43% | 0.65% | 0.69% | 0.49% | 0.36% | 0.40% |
| Min RSD | 0.13% | 0.11% | 0.15% | 0.13% | 0.24% | 0.22% | 0.32% | 0.07% | 0.21% |
| Max RSD | 0.83% | 1.39% | 1.40% | 1.02% | 1.62% | 1.33% | 0.66% | 0.62% | 0.77% |
In this study, the triple colour correction was not used to obtain dose values. Instead, we chose to calculate both OD and dose values per colour channel, separately, in order to analyse the possible effect of the magnetic field on the three colour channels, individually. The blue channel read-out is mainly sensitive to the dye light absorption and only slightly sensitive to the light absorption of the polymers. Therefore, in well-constructed films the blue channel can be used as an indicator of film sensitivity variation, provided that the mixing of monomers and dye per crystal is constant. The latter can be tested by considering the constancy of the channel read-out ratio of red/blue and green/blue. From the OD to dose-response curves (experiment (a)), we can conclude from the blue channel data that the absolute mean OD and mean RSD values (⩽0.6%) for the MRIdian are similar to those of the Linac, indicating that film's sensitivity variation does not play a role in this study. Besides, the read-out ratio red/blue and green/blue per dose value is constant over all measurements with a mean SD of ⩽0.1% for both the MRIdian and Linac experiments. These results indicate no significant signal variation over the irradiated films due to manufacturing mistakes, and it was therefore unnecessary to correct for the film sensitivity variation in this study.
Considering the experimental setup and analysis of this study, we can conclude that there are no significant differences found for any of the film rotation angles and its corresponding B0-field orientation in both the MRIdian and Linac measurements. The sampling statistics are sufficient since the 2 × 2 mm area consists of approximately 36 pixels, and several repeat measurements were performed. Furthermore, the SD over all measurements is very small and the ratio between the three colour channels is relatively constant.
The mean RSD of the OD values of the MRIdian and Linac orientation measurements were ⩽0.7% for both the frontal and sagittal orientations in all three colour channels. This is in contrast to the use of for instance an ionization chamber, which has been reported to show an over- and under-response, up to 8.3% and 11.3%, respectively, depending on the orientation with respect to the magnetic field and its field strength (Meijsing et al 2009). Overall, we found the impact of the 0.35 T magnetic field on the dose response of EBT3 GafChromic film to be very small. Therefore, film measurements are now part of our QA routine in MR-guided radiotherapy.
6. Conclusion
MR-guided radiotherapy introduces new challenges and risk factors in the clinical process. As the use of daily MR-guided radiotherapy in the clinic is increasing, it is important to evaluate the dosimetric accuracy of available QA tools. This study began with the premise to investigate the suitability of EBT3 GafChromic film for QA purposes in a 0.35 T field with and without real-time MR imaging. Our results show that there is no relevant dose-response difference between MRIdian and Linac measurements, irrespective of the film orientation with respect to the B0-field. In addition, within experimental uncertainty of 1% there is no B0-field influence on absolute film dose-response measurements, nor any influence of the RF energy during real-time imaging.
Therefore, we can conclude that EBT3 GafChromic film can be used for absolute dosimetry in MR-guided radiotherapy, independent of its orientation in the magnetic B0-field and additional RF energy during real-time MR imaging. This makes it a suitable dosimeter for patient-specific QA measurements and end-to-end testing under the current conditions in a 0.35 T 60Co machine.
Acknowledgments
The authors acknowledge the contribution of Leah McDermott, Medical Physicist Expert, Department of Radiation Oncology Noordwest Ziekenhuisgroep. The authors declare that the research presented in this study is free from conflicts of interest.