

Abstract
In this paper, we present simulation studies for the second-generation MRI compatible SPECT system, MRC-SPECT-II, based on an inverted compound eye (ICE) gamma camera concept. The MRC-SPECT-II system consists of a total of 1536 independent micro-pinhole-camera-elements (MCEs) distributed in a ring with an inner diameter of 6 cm. This system provides a FOV of 1 cm diameter and a peak geometrical efficiency of approximately 1.3% (the typical levels of 0.1%–0.01% found in modern pre-clinical SPECT instrumentations), while maintaining a sub-500 μm spatial resolution. Compared to the first-generation MRC-SPECT system (MRC-SPECT-I) (Cai 2014 Nucl. Instrum. Methods Phys. Res. A 734 147–51) developed in our lab, the MRC-SPECT-II system offers a similar resolution with dramatically improved sensitivity and greatly reduced physical dimension. The latter should allow the system to be placed inside most clinical and pre-clinical MRI scanners for high-performance simultaneous MRI and SPECT imaging.
Export citation and abstract BibTeX RIS
1. Introduction
Because of the complementary nature of MRI and emission tomography, a combination of SPECT or PET with MRI shows great potential for both pre-clinical and clinical applications. MRI has excellent spatial and temporal resolution, as well as exquisite soft-tissue contrast, but limited sensitivity. SPECT and PET are highly sensitive molecular imaging modalities, but offer little structural information. While combined imaging studies of SPECT and MR could be carried out with sequential SPECT–MR scanners, simultaneous SPECT/MR imaging allows for dynamic and multi-parametric imaging studies that could reveal molecular changes related to physiology with high-resolution functional and anatomical images aided by exceptional soft tissue differentiation. Also, acquiring SPECT and MR images simultaneously allows for real-time spatial and temporal image co-registration, as well as MR-guided motion and partial-volume corrections, which could help to improve imaging resolution and data quantification. These aspects would be particularly important for small animal studies that require ultra-high spatial resolution SPECT and MR images co-registered with a precision greater than the spatial resolution of both modalities. In the longer term, simultaneous SPECT and MR image acquisition could benefit clinical cardiac imaging applications, which are confounded by dynamic, functional, geometric and metabolic indices of the heart, and challenges associated with complex cardiac and respiratory motion (Pitman et al 2002, Segars and Tsui 2002, Lee et al 2015).
While PET/MRI instrumentation has progressed greatly (Judenhofer et al 2008, Delso et al 2014), the development of combining SPECT and MRI instrumentation, especially systems allowing for simultaneous SPECT and MR imaging, has been lagging. This is partially due to the special technical challenges of integrating SPECT with MR scanners, including potential interference between them. First, the strong magnetic field could potentially affect the operation of SPECT detectors, such as MR-induced noise degraded energy and spatial responses (Tan et al 2011). Second, the electronic and metallic components of the SPECT system could also cause distortions and degradation in MR image quality (Cherry 2009, Samoudi et al 2015). Furthermore, the limited space inside MRI scanners would pose practical challenges to the use of conventional pinhole SPECT system designs, which typically require large magnification to ensure reasonable trade-offs between spatial resolution and sensitivity (Cherry 2009).
In recent years, several groups have devoted intensive effort to developing combined SPECT and MR imaging systems. Most notably, Wagenaar et al have reported the design considerations of an MRI compatible SPECT system based on CZT detectors (Wagenaar et al 2006). Tsui et al have presented a prototype of an MRI compatible SPECT system based on similar CZT detectors (Meier et al 2009). A consortium consisting of several groups in the EU proposed and developed both preclinical and clinical SPECT inserts using SiPM based detectors (Busca et al 2014a, 2014b, Salvado et al 2014, Hutton et al 2016). Karel Deprez et al have constructed an MRI compatible aperture using rapid additive manufacturing with selective laser melting of tungsten powder (Deprez et al 2013). And J Zajicek et al have presented an MR-SPECT insert using Timepix detectors (Zajicek et al 2017).
We have reported an ultrahigh resolution stationary MR compatible SPECT system (MRC-SPEC-I) for small animal imaging (Cai et al 2014). The MRC-SPECT-I detector ring has a diameter size of 156 mm and consists of ten energy-resolving photon-counting (ERPC) CdTe detectors (Meng et al 2009, Tan et al 2009). The CdTe in each detector has a sensing volume of 22.5 × 45 × 2 mm3, and is divided into 64 by 128 pixels, each with a 0.35 mm width. MRC-SPECT-I consists of forty 300/500 μm-diameter pinholes in a 66 mm diameter ring. We have demonstrated its ability to achieve a sub-500 μm resolution in simultaneous SPECT/MRI mode while working inside the Siemens Trio 3T clinical scanner (Lai et al 2015a).
Despite the success in developing the MRC-SPECT-I system, the preliminary evaluation (Lai et al 2014, 2016) revealed several limitations, which limit its use in many practical SPECT/MR imaging applications. First, the system has a relatively low geometrical sensitivity of around 0.02% with 40 pinholes of 350 μm diameter and 0.05% with 500 μm pinholes, which would be insufficient for potential dynamic SPECT imaging applications. Second, since the MRC-SPECT-I system was designed to have a reasonable magnification ratio to ensure an excellent imaging resolution, the system has a large outer diameter of 25 cm, which cannot be placed inside many pre-clinical MRI scanners for high-performance MR imaging (BRUKER 2018).
In this paper, we propose an inverted compound eye (ICE) camera design and a second-generation MRI compatible SPECT system (MRC-SPECT-II) based on ultra-high-resolution detector technologies. We will present the results from a comprehensive simulation study to demonstrate the tremendous performance benefit given by the ICE camera design and the MRC-SPECT-II system design over the existing MRC-SPECT-I system.
2. Method and materials
2.1. Design of the inverted-compound-eye gamma camera and the MRC-SPECT-II system
We have recently proposed an inverted-compound eye (ICE) gamma camera design (Lai et al 2013) for use with the MRC-SPECT-II system (figure 1). Each ICE camera uses a CZT or CdTe detector with a sensor area of 2.56 × 2.56 cm2 coupled to an aperture with 8 × 8 pinholes, each with a diameter of 300–500 μm (300 μm in this study). The shape of each pinhole restricts the projection from the object to a small area of around 3.2 mm × 3.2 mm on the detector. Each pinhole and its corresponding effective detector area form a micro-pinhole-camera-element (MCE). In our current design, each single ICE camera module has 64 MCEs.
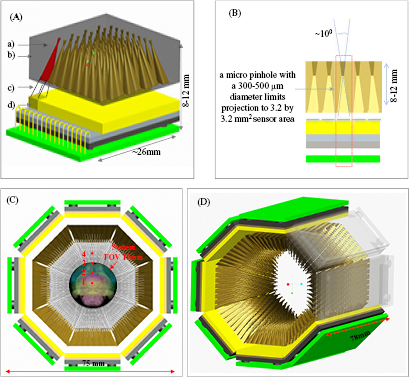
Figure 1. Initial design of the ICE module for SPECT imaging. In sub-figure (A), (a) the micro pinhole; (b) ICE aperture with 8 × 8 pinholes; (c) cone of pinhole restricting the projection to 3.2 mm × 3.2 mm sensing area; (d) CZT/CdTe detector with area 2.56 × 2.56 cm2. (B) Cross section of the ICE unit. (C) Transverse view of the MRC-SPECT-II system. The four selected points are used to study angular sampling and geometrical sensitivity. Point 1, Point 2, Point 3 and Point 4 are 0 mm, 2.5 mm, 5 mm and 7.5 mm away from the center of the FOV; the brain model is used with permission of the Allen Institute for Brain Science (Lein et al 2007, Allen Mouse Brain Atlas 2018). (D) 3D drawing of the MRC-SPECT-II system.
Download figure:
Standard image High-resolution imageThe current design of the MRC-SPECT-II system is also shown in figure 1. It has three detector rings along the axial direction, and each ring has eight ICE-camera modules. This gives a total of 24 modules and 1536 MCEs. Since each MCE has a small open angle and covers a fraction of the FOV, the distribution of the MCEs and their orientation could be critical in achieving a reasonable FOV and adequate angular sampling.
Within the eight ICE camera modules in a ring, there are in effect eight rings of MCEs along the axial direction. These rings focus on a FOV with a 1 cm diameter in the axial direction and provide a relatively uniform angular coverage. In the transverse direction, the MCEs in the first ring have all been designed so that the left boundaries of their individual angular coverage are always tangential to the left boundary of the system FOV. For each MCE in the second ring, the right boundary of its FOV is tangential to the right boundary of the system FOV. The 1st, 3rd, 5th and 7th rings of the MCEs are designed in a similar way to bias towards the left-hand side of the system-FOV, and the 2nd, 4th, 6th and 8th rings of the MCEs to bias towards its right-hand side. As we will show later in section 3.1, this design offers a relatively uniform angular sampling in an ultra-compact detection system.
2.2. Considerations on gamma ray detectors
To facilitate the specific ICE camera design, we have compared CZT detectors with small pixels of 100 μm to 400 μm pitch, and without depth of interaction (DOI) resolution and with a DOI resolution 500 μm. A gamma-ray imaging detector satisfying such requirements could be readily available, adopting existing electronics and detector technologies that have been developed and experimentally verified by our group, many other research groups, and commercial companies (Meng and He 2005a, 2005b, Groll et al 2017, Shen and Meng 2013, Ullberg et al 2013, Ballabriga et al 2006).
In this study, we propose to use the hybrid pixel-waveform (HPWF) detector design that has been developed by our group over the past several years (Meng and He 2005a, 2005b, Groll et al 2017, Shen and Meng 2013). In an HPWF detector, we use pixel readout circuitry to read out small anode pixels and digital waveform sampling circuitry working in coincidence with the anode readout circuitry to record the cathode waveform and to derive the DOI and energy information.
We have previously studied the performance benefit of using the cathode waveform to extract the energy and DOI information for gamma-ray interactions inside semiconductor detectors (Meng and He 2005a, 2005b). We have also constructed several prototype HPWF detector modules based on the ERPC CdTe detectors with 350 μm anode pixels (Groll et al 2017) and experimentally evaluated these detectors for single photon imaging applications (Shen and Meng 2013) and for coincidence (PET) imaging applications (Groll et al 2017).
In order to provide a HPWF detector that offers an imaging resolution of 100 μm, we propose to combine a cathode sampling circuitry with existing photon counting ASICs, such as the XC225 ASIC from AJAT/XCounter (Ullberg et al 2013) or the Medipix series ASICs (Ballabriga et al 2006). Please note that both the XC225 (with 100 μm pixel pitch) and the Medipix 3/4 (with 55 μm pixel pitch) ASICs implement various forms of charge sharing correction techniques to integrate the charge induced on neighboring (say 2 × 2) pixels. These schemes could significantly reduce small pixel detectors' charge-sharing effects on the effective spatial resolution (figure 6 and figure 7 in Ullberg et al (2013)), and also help to alleviate the impact of charge-sharing (and incomplete charge collection) on the detection efficiency.
Since these ASICs (XC225/Medipix) are designed for x-ray imaging and have a very high counting capability, the maximum count rate of the HPWF detector is limited by the cathode readout time. For a 2 mm CdTe detector with a bias voltage of 400 V, the maximum time of hole drifting is around 0.5 μs, and considering the shaping and other post-processing, the time (tp) needed to process one event could be extended to 2.5 μm. The maximum count rate will be around 400 K (i.e.  ). Considering that 1 mCi activity is concentrated at the center of the FOV, and the total detection efficiency of the MRC-SPECT-II system is 1%, then the entire system would detect 3.7 × 10⁵ photons per second distributed over 24 detectors. Each detector would receive an average of 1500 photons per second. So, the 400 k allowance (the photon flux allowed without inducing substantial dead time) is several orders of magnitude over the expected photon flux for MRC-SPECT-II applications.
2.3. Comparison with the MRC-SPECT-I system
In this study, we used our MRC-SPECT-I system (Cai et al 2014) as a benchmark to evaluate the MRC-SPECT-II system. The design parameters of MRC-SPECT-I and MRC-SPECT- II are summarized in table 1 and further detailed below.
Table 1. System parameters of MRC-SPECT-I and MRC-SPECT-II.
| Parameters/Systems | MRC-SPECT-I | MRC-SPECT-IIN1 |
|---|---|---|
| # of detector | 10 in one ring | 24 in three rings |
| Detector to object center | 78 mm | 30.9 mm |
| Detector volume |  mm3 mm3 |
 mm3 mm3 |
| Detector pixel size | 0.35 mm | 0.4 / 0.1 / 0.1 mmN1 |
| DOI resolution | 2.0 mmN2 | 0.5 / 2.0 / 0.5 mmN1, N2 |
| Number of pinholes | 40 in total, 4 per detector | 1536 in total, 64 per detector |
| Aperture to object center | 36 mm | 20.6 mm |
| Pinhole diameter | 0.45 mm | 0.3 mm |
| FOV (mm) | ϕ16 mm × 20 mmN3 | ϕ10 mm × 10 mm |
N1For MRC-SPECT-II, we simulated three systems: MRC-SPECT-II-A, MRC-SPECT-II-B, and MRC-SPECT-II-C. These systems were equipped with different detectors, and the corresponding detector parameters are given in the rows of 'Detector pixel size' and 'DOI resolution' in this table. N2Non-DOI detector had DOI information equal to the detector thickness, i.e. 2 mm. N3The aperture design of MRC-SPECT-I allowed projection overlapping; the non-overlapping region in the FOV was around ϕ12 mm × 20 mm.
Detectors: MRC-SPECT-I used an energy-resolved photon-counting CdTe detector. Each CdTe detector had an active volume of 22.5 × 45 × 2 mm3 and the anode side of the detector was divided into 64 × 128 pixels with 0.35 mm pitch.
By comparison, the MRC-SPECT-II system design outlined above was based on a CdTe detector with an active volume of 25.6 × 25.6 × 2 mm3. To evaluate different detector options, we compared the MRC-SPECT-II system with three different detector configurations. The first one, named MRC-SPECT-II-A, used the prototype HPWF, providing a DOI resolution of 0.5 mm and a pixel size of 0.4 mm (the original pixel size is 0.35 mm; here, we used 0.4 mm, to match the detector width, i.e., 25.6 mm). The second, called MRC-SPECT-II-B, used an ultra-high photon counting anode ASIC without cathode readout, which had x–y spatial resolution of 0.1 mm but no DOI resolving power. The third configuration, called MRC-SPECT-II-C, used the proposed HPWF detector, which had a pixel size of 0.1 mm and a DOI resolution of 0.5 mm.
System design: The MRC-SPECT-I system consisted of ten detectors in a closely packed ring with an inner diameter of 15.6 cm (the distance between two opposite detectors and an axial length of 2.25 cm. Inside the detector ring, there was a single ring of 40 pinholes of 300 μm or 500 μm diameter. The distance between the pinhole and the axis of the system is 33 mm) (Cai et al 2014, Lai et al 2015a). MRC-SPECT-I was designed to offer a FOV of around 16 mm diameter in transverse and 20 mm in axial. In this simulation study, we used 0.45 mm diameter pinholes for the MRC-SPECT-I system, to match the intrinsic resolution of MRC-SPECT-I and MRC-SPECT-II-C.
By comparison, the MRC-SPECT-II system consisted of 24 detectors in three rings (eight detectors per ring). Within each ring, the distance between the opposite detectors was around 60 mm, and the total length of the MRC-SPECT-II detection system was 8 cm. Each detector of 2.56 cm × 2.56 cm was coupled to a cluster of 8 × 8 pinholes that were all positioned in a plane parallel to the detector surface. The current design of the MRC-SPECT-II system had 1536 MCEs, each with a single pinhole. The distance between the detector front surface to the pinhole aperture plane was 9.7 mm, and the distance between the aperture plane and the axis of the system was 21.6 mm. This system design allowed for a FOV of around 10 mm diameter by 10 mm in axial direction.
2.4. System modeling, simulation, and reconstruction
In this simulation, the system response matrices (H) of MRC-SPECT-I and MRC-SPECT-II were pre-calculated using the line-trace method:

where Hmn is the probability of a photon emitted from the nth object voxel detected by the mth detector pixel; we calculated the probability at  for the object voxel at
  and then integrated over the sensing volume belonging to the mth detector pixel, i.e.
  (For MRC-SPECT-I, the sensing volume of each detector pixel is
  mm3; for MRC-SPECT-II-A,
  mm3; for MRC-SPECT-II-B,
  mm3; for MRC-SPECT-II-C,
  mm3).
mm3).  and
and  are the linear attenuation coefficients of CdTe and the aperture at 140 KeV respectively; ld and lp represent the distance that the photon travels in the aperture and the CdTe crystal before it is detected at
  .
.
The line-trace method does not take into account detector energy resolution or energy window effect, or Compton scattering. However, these simplifications should not significantly affect this method's reliability for the pre-clinical SPECT modeling. Most gamma rays with 140 keV and below interact with CdTe and CZT materials through photoelectric interaction, and the fraction of photoelectric effect is even higher for interactions of these gamma rays in collimator materials (Pt-90%/Ir-10%, density 21 g cm−3). Furthermore, for imaging a mouse's brain, the effect of Compton scattering and attenuation in the small object (1.5 cm in diameter) is negligible, given that the mean free patch of a 140 Kev photon is around 6.6 cm in water. For this imaging application, one can reasonably assume that most gamma-rays reaching the detector are coming directly from their originating emission site.
To experimentally evaluate the model, we compared the simulated pinhole response (the projection of a point source of 250 μm diameter through a given pinhole onto a CdTe detector of 2 mm thickness) to the pinhole response experimentally measured with identical geometry. In addition, we also compared the phantom images reconstructed with simulated and measured data under the same calibrated geometry. The simulated pinhole response matched reasonably well with the experimental response (figures 2A and B). On the other hand, image qualities of the experimental phantom degraded compared to the corresponding simulated results (figures 2C and D). We will discuss the potential reasons causing this degradation in section 4. Nevertheless, the simulation presented in this paper evaluated the potential performance MRC-SPECT-II could achieve.
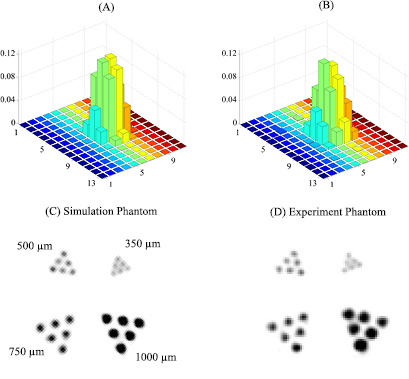
Figure 2. A comparison between simulated and experimentally measured system responses: (A) the simulation point response function (PRF) around the FOV center of MRC-SPECT-I; (B) the corresponding experimental PRF; (C) the reconstructed image using a simulation phantom; (D) the reconstructed image using experimental data acquired using MRC-SPECT-I system. The system and phantom geometries remained the same for both the simulation study and actual experimental measurements, where MRC-SPECT-I used forty 300 μm pinholes.
Download figure:
Standard image High-resolution imageAfter calculating the system matrix, we generated the noise free projection ( ) by
) by

where  is a digital phantom. In this study, we evaluated the system designs using three digital phantoms. The first was a resolution phantom that had four groups of hot rods with different sizes, which were surrounded by a uniform background. The radioactivity concentration in the hot rods was ten times that of the background. The second was a uniform phantom, and the third a mouse brain phantom developed by Beekman et al (2009). For all three phantoms, the region with activity was confined to within a roughly 1 cm diameter. They were all divided into 64 voxels in each dimension with a voxel size of 0.2 mm. More details of the digital phantoms can be found in figures 5 and 6.
The noise projection  then was generated using a Poisson noise model based on the noise-free projection. The images were reconstructed using post-filtered maximum-likelihood estimation (Shepp and Vardi 1982, Nuyts 2002):


where  is a maximum-likelihood (
 ) estimator and
  is post-smoothed
  , which is derived by using a 3D Gaussian post-filter, F.
2.5. Numerical performance indexes for comparing different system designs
In this study, we used resolution-variance trade-offs (Meng and Clinthorne 2004, Li and Meng 2011, Meng and Li 2013), to evaluate the proposed MRC-SPECT-II system design. We evaluated the spatial resolution and variance properties at different locations of FOV. By selecting reconstructed images at different EM iterations, we arrived at different trade-offs between imaging variance and spatial resolution, which were then plotted to obtain so-called resolution-variance trade-off curves, to compare different system designs.
In this study, the spatial resolution was presented by the FWHM of the local-impulse response (LIR) (Fessler and Rogers 1996),  , for a given pixel (jth) as:

where  is the mean of reconstructed images, and
  is a small impulse on the voxel j. The reconstructed image mean and pixel-wise variance were both derived by 500 random realizations.
3. Results
3.1. MRC-SPECT-II design dramatically improved sensitivity and angular sampling with an ultra-compact detection system
As shown in figure 3, we studied angular sampling provided by the MRC-SPECT-II system at four points of interest (POIs, shown with red dots in figure 1(C)) and compared it against corresponding sampling provided by the existing MRC-SPECT-I system. The MRC-SPECT-II system had 1536 pinholes covering FOV with a diameter of 10 mm. As a result, POI 1 was 'seen' by all MCEs in four adjacent rings with a total of 256 pinholes uniformly distributed across the 360° around the axis. POIs 2 and 3 were seen by at least half of the MCEs in four adjacent rings with >128 pinholes. By comparison, the MRC-SPECT-I system had only 40 pinholes distributed around the object. Thus, the MRC-SPECT-II system provided much better angular sampling without any translation of the object or the SPECT detection system.
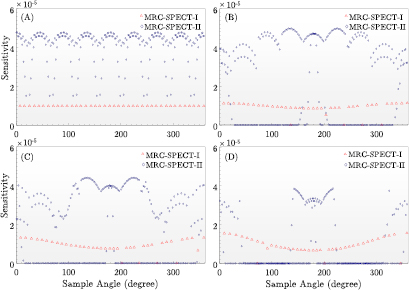
Figure 3. Comparing angular sampling of MRC-SPECT-I (red circles) and MRC-SPECT-II (blue diamond) at four locations shown in figure 1(C) as Point 1, Point 2, Point 3 and Point 4. Sample angle, on the x-axis, defines a gamma ray's emission direction in the transverse plane, i.e. the azimuthal angle with the reference center at the sample point (Point 1, Point 2, etc). And the angle is discretized with a step size of 0.5°. Sensitivity, on the y-axis, is the probability of the gamma ray being detected by the system at the corresponding sample angle.
Download figure:
Standard image High-resolution imageThe MRC-SPECT-II system design achieved better angular sampling with a highly compact geometry. The aperture-to-object distance was 21.6 mm for MRC-SPECT-II versus 36 mm for MRC-SPECT-I. More pinholes covering the FOV, together with shorter distance between the pinholes and the axis, enabled the MRC-SPECT-II system to provide a dramatically improved system sensitivity over the MRC-SPECT-I system. As shown in figure 4, using pinholes with a diameter of 0.3 mm, the peak sensitivity of the MRC-SPECT-II reached around 1.3% in the central FOV, and any point in the central transverse slice had sensitivity larger than 0.5%. Due to the highly focused geometry, the sensitivity had a large spatial variation. In the axial direction, the sensitivity at the boundary of FOV decreased to around 0.3%. In comparison, using 40 pinholes with a diameter of 0.45 mm, MRC-SPECT-I had a peak sensitivity of around 0.04%, about 30 times less than that of MRC-SPECT-II.

Figure 4. Transverse and axial geometrical sensitivity profiles for the MRC-SPECT-I and MRC-SPECT-II. Note that the profiles of the MRC-SPECT-I were scaled by a factor of ×20. The geometrical sensitivity is defined as the probability of a gamma ray being emitted at a sampled point and passing through pinholes.
Download figure:
Standard image High-resolution imageIt was equally important, from the MR-compatible SPECT view point, that the improved sensitivity and angular sampling were achieved with a greatly reduced system dimension (6 cm inner diameter for the MRC-SPECT-II detector-ring versus 15.6 cm diameter for the MRC-SPECT-I system). This enabled the MRC-SPECT-II system to be integrated into a wide variety of high-magnetic-field MR scanners (BRUKER 2018).
3.2. Resolution phantom studies
In order to evaluate the imaging performance of MRC-SPECT-II and different configurations, we have carried out a series of simulation studies and the results are shown in figure 5.
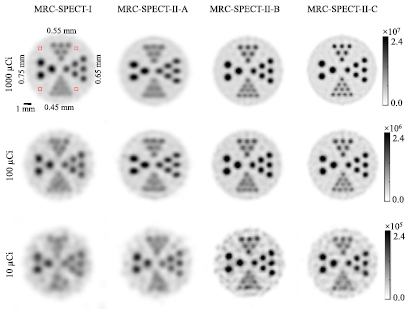
Figure 5. Images of a resolution phantom reconstructed at similar variance level; the filter FWHMs for the MRC-SPECT-II-C images at 1 mCi, 100 μCi, and 10 μCi were 0.3 mm, 0.4 mm, and 0.5 mm respectively. We varied the filter size of other systems to ensure their variance in the ROI (the four square regions, each having 4 × 4 × 10 (axial) voxels, marked in the upper left figure.) was similar to that of the corresponding MRC-SPECT-II-C images.
Download figure:
Standard image High-resolution imageIn figure 5, we found that the detector resolution played a significant role in improving the imaging qualities of MRC-SPECT-II. Given 1000 μCi activity, the features of the 0.65 mm hot rods were blurred by MRC-SPECT-II with the prototype HPWF (MRC-SPECT-II-A), while the features of the 0.45 mm hot rods were clearly resolved by MRC-SPECT-II with the proposed HPWF (MRC-SPECT-II-C). When the activity was reduced to 10 μCi, the reconstructed images of MRC-SPECT-II-A were distorted, but those of the proposed HPWF could still resolve features of 0.55 mm. Comparing the results of MRC-SPECT-II-B and MRC-SPECT-II-C, we found that DOI information allowed the system to resolve high resolution features. In the 1000 μCi case, DOI information (MRC-SPECT-II-C) could improve the system resolution from 0.55 mm to 0.45 mm.
Figure 5 compares images obtained with MRC-SPECT-I and MRC-SPECT-II. At high activity (1000 μCi), MRC-SPECT-II-C with proposed HPWF detector could achieve a resolution of around 0.45 mm, while MRC-SPECT-I only delivered 0.55 mm resolution images at the similar variance. When the phantom activity was reduced to 10 μCi, all of the hot rods in MRC-SPECT-I were distorted, while MRC-SPECT-II could still resolve features of 0.55 mm. Clearly, high system sensitivity and rich angular sampling made MRC-SPECT-II more immune to noise.
3.3. Mouse brain phantom studies
Compared to the resolution phantom used above, the brain phantom described in section 2.4 had a much broader distribution of activity, and allowed us to further evaluate the capability of MRC-SPECT-II. As shown in figure 6, we simulated a phantom filled with different activity levels ranging from 1 mCi to 5 μCi, and compared the reconstructed images at similar spatial resolution of around 0.5 mm. Given the >30 times greater sensitivity, the MRC-SPECT-II system offered greatly reduced imaging noise. With a very low activity of 5 μCi in the whole brain, the MRC-SPECT-I image became very noisy and virtually unusable, while the MRC-SPECT-II image retained reasonable quality.
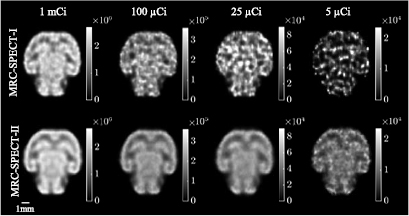
Figure 6. Reconstructed images of the mouse brain phantom; the reconstructed images had similar resolution for each activity level; MRC-SPECT-II with the proposed HPWF (MRC-SPECT-II-C) was used. Resolution was evaluated in terms of LIR (equation (5)) at the center of the FOV. The filter FWHM of MRC-SPECT-II was fixed at 0.5 mm, and we varied the filter size of MRC-SPECT-I to minimize the LIR difference.
Download figure:
Standard image High-resolution image3.4. Quantitative studies
In figure 7, we quantitatively evaluate benefits of an ultra-high pixel resolution detector. For the target spatial resolution in the range between 0.7 mm and 1.0 mm, the image variance at the center of the FOV using the proposed HPWF detectors (MRC-SPECT-II-C, 100 μm detector pixels) was around five times less than that of the prototype HPWF detectors (MRC-SPECT-II-A, 400 μm pixels). Figure 7 also demonstrates that it was challenging for the prototype HPWF detector system (MRC-SPECT-II-A) to get resolution better than 0.7 mm.
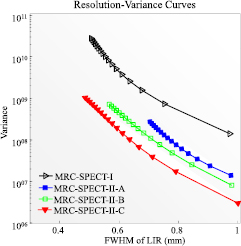
Figure 7. Resolution-variance trade-off curves. The results were derived by selecting different-iteration images of the uniform phantom. Resolution and variance were evaluated at the center of FOV and obtained through simulation with 500 realizations.
Download figure:
Standard image High-resolution imageFigure 7 also assesses the performance benefit of the DOI effect. We show that for target spatial resolutions in the range between 0.5 mm and 1 mm, the image variance at the center of the FOV obtained with DOI resolution of 500 μm was less than half of that without DOI information.
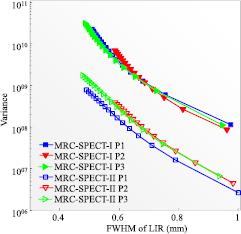
Compared with MRC-SPECT-I (figures 7 and 8), the image variance obtained with the MRC-SPECT-II system (MRC-SPECT-II-C) at the center of FOV was more than 20 times lower when the target spatial resolution was in the range between 0.5 mm and 1 mm. The non-uniformity of MRC-SPECT-II's sensitivity led to appreciable difference in the resolution-variance trade-offs for different spatial locations. As shown in figure 8, the variance increased by 50% when it was moved away from the center by 3.2 mm. Nevertheless, the MRC-SPECT-II system consistently allowed for a reduction in imaging variance by an order of magnitude at a given spatial resolution, when compared to the MRC-SPECT-I system.
Figure 8. Resolution-variance trade-off curves at different locations. P1 is at the FOV center, P2 and P3 are 3.2 mm away from the FOV center in the transverse and axial direction respectively; the same simulated data sets of MRC-SPECT-I and MRC-SPECT-II-C were used as the ones in figure 7.
Download figure:
Standard image High-resolution image
4. Discussions and conclusions
In this paper, we have proposed and evaluated the design of the second-generation MR-compatible SPECT system (MRC-SPECT-II) based on an inverted-compound-eye gamma-camera design. The ultra-high 3D resolution of the detector enabled MRC-SPECT-II to use a demagnification design without sacrificing resolution, and allowed the system to pack a large number (1536 in the current design) of micro-pinhole cameras around the object. Compared to the MRC-SPECT-I system, this configuration offers a dramatically improved detection efficiency, greatly enriched angular sampling, and a significantly reduced physical dimension. As we have demonstrated via simulation studies, these improvements enable the MRC-SPECT-II system to offer a dramatically improved image quality over the MRC-SPECT-I system, with a compact detection system that could be inserted in most pre-clinical MR scanners. Also, the performance of MRC-SPECT-II in terms of sensitivity and resolution was significantly better than current generation commercial scanners (Deleye et al 2013, Yu et al 2015, γ-Cube from Molecubes1), even though designing an MR-compatible SPECT system that allowed for simultaneous SPECT-MR studies would be subject to many extra constraints along with those for designing a regular SPECT system.
As the reader may have noticed, the current design of MRC-SPECT-II led to spatially variant sensitivity and angular sampling, and consequentially non-uniform image quality across the FOV. This issue could be readily resolved by re-distributing the pinhole positions and their angles of orientation, to direct more pinholes to cover the regions that have lower sensitivity in the current sensitivity profile shown in figure 4. Given the large number of degrees of freedom associated with the ICE camera design, one could fine-tune the design of the MRC-SPECT-II system. However, a systematic optimization will be computationally expensive, and the optimization should be highly specific to the imaging tasks. We would leave this optimization study to our future studies. Nevertheless, there is no doubt that the MRC-SPECT-II system design would lead to a dramatically improved imaging performance compared to the MRC-SPECT-I system.
Regarding the viability of constructing the MRC-SPECT-II system, most of the hardware components, such as the system gantry and collimators, can be readily produced with 3D printing techniques (Lai et al 2012, 2015b Deprez et al 2013, Cai et al 2014, Lai et al 2015a, Lai and Meng 2017). As discussed in section 2.2, we are currently developing the HPWF detector for use in the MRC-SPECT-II system. Given the recent advances in semiconductor detector and readout electronics, a detector with nearly perfect detection efficiency (as defined by the physical stopping power of CZT material and not degraded by the readout electronics), an excellent energy resolution could be achieved with this newer generation of CZT detectors. From experience learned from developing the MRC-SPECT-I hardware and from many other recent developments in CdTe/CZT detector technologies, we believe that a detector with the performance matching that being simulated in this study could be readily developed. The relevant progress will be presented in our future publications.
In section 2.4, we showed that the experimental image quality degraded compared to the simulated one. One of the potential causes was a mismatch between the calibrated and actual imaging geometry, including pinhole position, pinhole shape, etc. This issue will potentially become more critical in MRC-SPECT-II, given the large number of the micro-pinholes and the limited mechanical precision of current 3D printing techniques. In such a case, we could experimentally measure and validate the system response function by using a point source scanning across the object space (Lai and Meng 2017). This would allow us to incorporate the mechanical imperfections into the system model, and thereby minimize the impact of related systematic errors on imaging quality.
Acknowledgments
Research reported in this publication was supported by the National Institute of Biomedical Imaging and Bioengineering (NIBIB) under award number 1R21EB018001-01.