
Abstract
Recent studies have suggested that 18F-NaF-PET enables visualization and quantification of plaque micro-calcification in the coronary tree. However, PET imaging of plaque calcification in the coronary arteries is challenging because of the respiratory and cardiac motion as well as partial volume effects. The objective of this work is to implement an image reconstruction framework, which incorporates compensation for respiratory as well as cardiac motion (MoCo) and partial volume correction (PVC), for cardiac 18F-NaF PET imaging in PET/CT. We evaluated the effect of MoCo and PVC on the quantification of vulnerable plaques in the coronary arteries. Realistic simulations (Biograph TPTV, Biograph mCT) and phantom acquisitions (Biograph mCT) were used for these evaluations. Different uptake values in the calcified plaques were evaluated in the simulations, while three 'plaque-type' lesions of 36, 31 and 18 mm3 were included in the phantom experiments. After validation, the MoCo and PVC methods were applied in four pilot NaF-PET patient studies. In all cases, the MoCo-based image reconstruction was performed using the STIR software. The PVC was obtained from a local projection (LP) method, previously evaluated in preclinical and clinical PET. The results obtained show a significant increase of the measured lesion-to-background ratios (LBR) in the MoCo + PVC images. These ratios were further enhanced when using directly the tissue-activities from the LP method, making this approach more suitable for the quantitative evaluation of coronary plaques. When using the LP method on the MoCo images, LBR increased between 200% and 1119% in the simulated data, between 212% and 614% in the phantom experiments and between 46% and 373% in the plaques with positive uptake observed in the pilot patients. In conclusion, we have built and validated a STIR framework incorporating MoCo and PVC for 18F-NaF PET imaging of coronary plaques. First results indicate an improved quantification of plaque-type lesions.
Export citation and abstract BibTeX RIS

Original content from this work may be used under the terms of the Creative Commons Attribution 3.0 licence. Any further distribution of this work must maintain attribution to the author(s) and the title of the work, journal citation and DOI.
1. Introduction
Cardiovascular diseases (CVD) remains one of the leading causes of death in the Western world (Weintraub 2008). Moreover, there is an excessive rate of sudden death due to cardiovascular events (CVE) in apparently healthy patients without prior symptoms (Naghavi et al 2003). CVEs are frequently caused by the rupture of a vulnerable atherosclerotic plaque, resulting in thrombotic occlusion or distal embolization (Izquierdo-Garcia et al 2009). Recent studies have suggested that positron emission tomography (PET) with 18F-FDG (FDG) enables both visualization and quantification of arterial inflammation (Hacker 2012). Although most of the published 18F-FDG PET studies of atherosclerosis have focused on relatively large arteries, it is known that most of the deaths from CVE result from complications of vulnerable plaques in the smaller coronary arteries (Virmani et al 2006, Saam et al 2010). 18F-Sodium Fluoride (18F-NaF) is another promising marker targeting ongoing calcium deposition in vulnerable plaques. Due to the absence of physiological tracer accumulation in the myocardium, this tracer has been demonstrated to be advantageous for imaging calcifications in the coronary arteries (Joshi et al 2014).
Combined PET/CT systems can, in principle, provide high-resolution structural images of the coronary tree to facilitate precise assignment of 18F-NaF uptake in vulnerable plaques. However, the limited spatial resolution of clinical PET images (around 50–100 mm3) challenges the detection of small calcifications (100–200 mm3, (Joshi et al 2014)). In addition, the effect of respiratory and cardiac motion reduces significantly the contrast of PET images, thus, compromising further the ability to identify vulnerable plaques. Moreover, partial volume effects, which are significant for small lesions affected by motion (Chang et al 2010), compromise the quantitative accuracy of cardiac PET images. These effects must be corrected for in order to obtain reliable and quantitatively accurate images (Delso et al 2011, Rubeaux et al 2016, Robson et al 2017).
Respiratory and cardiac gating can be used to reduce motion-induced blurring of cardiac PET images. In gated PET studies, the PET raw data is divided into subsets (gates) corresponding to different phases of the heartbeat (cardiac gating) or the respiratory cycle (respiratory gating). Gating results in a set of images with significantly reduced motion (Kesner et al 2013) but at the expense of increased noise levels. In addition, motion-induced mismatch of the attenuation map with the emission data can create severe artefacts in the gated PET images (Ouyang et al 2013). In order to overcome these drawbacks, several approaches incorporate the motion information in the reconstruction algorithm (Nehmeh 2013, Kesner et al 2014, Manber et al 2015, Manescu et al 2015, Bousse et al 2016).
Among these approaches towards motion-compensation (MoCo) of PET data, the most common are: the reconstruct-transform-average (RTA) and motion-compensated image reconstruction (MCIR). In RTA, separate images are reconstructed for each frame and transformed to one reference frame (Picard and Thompson 1997). In MCIR projection data are reconstructed including respiratory-motion information into the system matrix (Jin et al 2012, Rahmim et al 2013). Several studies comparing the RTA and MCIR approaches have been performed (Guérin et al 2011, Chun et al 2012, Chun and Fessler 2012, Polycarpou et al 2012, Tsoumpas et al 2013), with MCIR showing in general better performance when imaging small lesions, as the case of coronary plaques. In both MoCo approaches the motion information is obtained typically from the PET raw data (Büther et al 2009, Fayad et al 2013) or from MR-derived motion fields in simultaneous PET/MR (Tsoumpas et al 2011b, Grimm et al 2014, Balfour et al 2015, Dutta et al 2015, Fürst et al 2015, Huang et al 2015, Fayad et al 2016).
Numerous approaches have been proposed to compensate for partial-volume and spillover effects in nuclear medicine (Soret et al 2007, Erlandsson et al 2012). These techniques can be divided into two categories: post-reconstruction and within-reconstruction methods. Post-reconstruction methods include the region-based methods, as for example the geometric transfer-matrix (GTM) method (Rousset et al 1998), which is preferred in conjunction with non-linear iterative reconstruction algorithms (Du et al 2005). Other post-reconstruction corrections consist of voxel-based methods, such as the extensively used MGM method (Müller-Gärtner et al 1992), image de-convolution (Teo et al 2007) and the 'region-based voxel-wise correction' (RBV) proposed by Thomas et al (2011). Other approaches for partial volume correction (PVC) include projection-based methods, such as the local projection (LP) method proposed for SPECT quantification by Moore et al (2012) and Southekal et al (2012) and for preclinical PET by Cal-Gonzalez et al (2015). Some examples of within-reconstruction methods are the region-based MLEM (Carson 1986) or Bayesian approaches, which incorporate region-dependent penalties (Baete et al 2004). In the case of imaging coronary plaques (Delso et al 2011, Petibon et al 2014), partial volume effects are influenced by respiratory and cardiac motion, therefore, PVC must be applied following motion compensation techniques.
In this work we implemented an image reconstruction framework, which incorporates MoCo and PVC for 18F-NaF PET imaging of vulnerable plaque in the coronary arteries. By using realistic analytical simulations we evaluated the impact of MoCo and PVC on the detectability and quantification of vulnerable plaques in coronary arteries. Further, we applied our MoCo and PVC methods to a phantom experiment with simulated plaque-type lesions and to four 18F-NaF PET/CT patient studies.
2. Materials and methods
We implemented our MoCo + PVC reconstruction framework for the Siemens Biograph true-point true view (TPTV) (Jakoby et al 2009) and for the Siemens Biograph mCT—4 rings (Jakoby et al 2011) PET/CT systems. The simulations used for the general validation of the MoCo + PVC methods are described in section 2.1. Furthermore, in section 2.2 we present the evaluations of respiratory and cardiac MoCo and PVC in phantom experiments (mCT system) and in four pilot patients (TPTV system). Section 2.3 describes the algorithm used for single respiratory or cardiac MoCo, while section 2.4 details the respiratory and cardiac motion modelling used in the experimental evaluations. Finally, in section 2.5 we describe the method used for the PVC.
2.1. Simulated datasets
To evaluate the performance of the MoCo and PVC methods in a scenario in which we have a full knowledge of the motion vector fields (MVFs) we used realistic simulations of PET obtained from segmentations of real MR images (Tsoumpas et al 2011a). First, an ultra-short time-echo (UTE) sequence was used in order to separate the anatomical structures of the patient and to create the attenuation maps. Second, a dynamic MR sequence (35 dynamic frames, 0.7 s duration each) acquired during normal breathing was used to estimate the simulated MVFs (Buerger et al 2012). The segmented regions of the MR images were assigned with NaF-PET standardized uptake values (SUV) as typically measured in a clinical PET/CT acquisition (Win and Aparici 2014, Oldan et al 2015), yielding a 3D emission map (table 1). Four MVFs, corresponding to different respiratory phases and obtained from the dynamic MR sequence previously mentioned, were then applied to the segmented PET image to generate a 4D segmented volume. This volume is later projected by using the STIR projector based on Siddon's ray tracing algorithm, with 20 rays per tube of response, in order to obtain the simulated gated sinograms. The number of rays per tube of response was selected to approximate resolution blurring effects. Attenuation coefficient projection data were estimated from the segmented attenuation images. The effect of scatter was simulated analytically using the single scatter simulation formula (Watson 2000) as implemented in STIR (Tsoumpas et al 2004). Random events were approximated as a uniform background, summing in total a 30% of the simulated counts. Poisson noise was included to simulate two different levels of acquired counts: 500 (high) million and 100 (low) million counts. With an injected dose of 400 MBq, 500 million counts would correspond to a 30 min scan, while 100 million counts would correspond to a 6 min scan. Further details of the process can be found in Tsoumpas et al (2011a).
Table 1. SUV values for the different segmented tissues in the simulated emission NaF-PET images.
| Tissue | Air | Lung | Soft tissue | Ribs | Spine |
|---|---|---|---|---|---|
| SUV | 0.0 | 0.4 | 0.8 | 10.0 | 12.0 |
For the evaluations of the two different PET systems simulated in this study, variable matrix and voxel sizes were used. Biograph TPTV PET/CT: matrix size 336 × 336 × 109, voxel size 2.005 × 2.005 × 2.031 mm3; Biograph mCT: matrix size 400 × 400 × 109, voxel size 2.0364 × 2.0364 × 2.027 mm3. STIR projector and back projector were adapted to the geometry model and 3D sinogram data storage corresponding to each system. No ToF information was used in the mCT reconstructions.
The OSEM and MoCo reconstructions were performed by using 5 iterations and 21 subsets, storing the reconstructed images after each iteration, to evaluate the convergence of the iterative algorithm with the simulated datasets. The relatively large number of iterations was chosen to increase the contrast of the small coronary plaques (Robson et al 2017). A 2 mm Full Width Half Maximum (FWHM) Gaussian filtering was applied after each iteration in all reconstructions, following as reference the settings used in other similar studies (Rubeaux et al 2016, Robson et al 2017). No regularization was included in any of the static or MoCo reconstructions.
A spherical shape of the plaque, with 2 mm radius (33.5 mm3 volume), was simulated in all cases. The assigned SUV values for the calcified plaque were set to obtain lesion-to-background ratios (LBR) of 10, 20, 50 and 70 (background SUV = 0.8), following the values suggested in Delso et al (2011). In order to evaluate the variability of the results, five simulations with different seed numbers were analyzed. The seed numbers were used to create different noise realisations when adding Poisson noise to the simulated gated-sinograms.
The figures of merit used for the evaluation of the simulated reconstructions were: LBR using the maximum value within the segmented lesion (LBRmax), LBR using the mean activity within the segmented lesion (LBRmean), activity bias (%) in each lesion and image noise (%), measured as the standard deviation in a uniform region. The activity bias within the lesions was computed as follows:

where measuredv is the activity measured in each voxel within the segmented lesion Li, refv is the activity in the reference image, down-sampled to the PET resolution, and NvoxelsLi is the total number of voxels within the segmented lesion.
The errors for LBRmax were calculated as the standard deviation of the LBRmax values obtained in five independent case-based simulations, weighted with the noise measured in the uniform region. The errors on the LBRmean, bias and noise values were computed as the standard deviation obtained from the five independent simulations.
To evaluate the effect of the MoCo + PVC methods on the quantification of the PET images, we calculated the relative changes in the LBRs (ΔLBR) after applying MoCo and MoCo + PVC. The ΔLBR was calculated as:

where LBRcorrected is the LBR after applying the MoCo or MoCo + PVC methods and LBRstatic is the LBR measured in the static image reconstructed without any corrections.
2.2. Experimental data
2.2.1. Phantom experiments
Acquisitions of a human thorax phantom (Fieseler et al 2013), capable of mimicking respiratory and cardiac motion, were also used for the evaluation of the MoCo + PVC approach. This thorax phantom contained three spherical plaque-type lesions of 36, 31 and 18 mm3 inserted (figure 1). The background activity was set to 4 kBq ml−1, while the plaque-type lesions were filled with a LBR of 70:1. No increased myocardial uptake was simulated in any of the experiments, in order to mimic the conditions of clinical imaging with the NaF radiotracer. The respiratory motion range was set to 2 cm, while the cardiac motion was set to a maximum change of 60 ml blood volume. The following acquisitions were performed:
- Exp1. Static acquisition with no motion, 10 min listmode. Systole and expiration. 112 million counts.
- Exp2. Only cardiac motion, 10 min listmode. Cardiac cycle 1.2 s (0.6 s systole, 0.6 s diastole). 124.1 million counts.
- Exp3. Respiratory and cardiac motion, 16 min listmode. Respiratory cycle 4.6 s (1.6 s inspiration, 3.0 s expiration). Cardiac cycle 1.2 s (0.6 s systole, 0.6 s diastole). 163.5 million counts.

Figure 1. Left: schematic design of the thorax phantom compartments. Right: positions of the three plaque-type lesions.
Download figure:
Standard image High-resolution imageAll experiments were conducted using a Biograph mCT PET/CT system, located at Münster University (Germany). Images were reconstructed following the same settings as in the simulated datasets. In Exp1, static OSEM and static OSEM + PVC reconstructions were performed. This experiment is used as reference standard for the accuracy measurement of the motion estimation and compensation techniques implemented in this work. Cardiac motion was modelled in Exp2, while both respiratory and cardiac motions were modelled in Exp3 (see section 2.4 for further details). LBRmax and LBRmean values were evaluated for all the lesions.
2.2.2. Patient studies
Four pilot patients were scanned using 18F-NaF PET after myocardial infarction. Low dose and Ca-score CT scans were acquired in addition to an ECG-gated PET acquisition, in the Biograph TPTV system. (374 ± 14) MBq NaF was injected and a 20 min listmode acquisition was performed (99 ± 17) min post-injection. The total number of acquired counts in the four patients was: 252 ± 39 million prompts. The size of the calcified plaque was measured from the Ca-Score image. Motion vectors were obtained from a non-rigid registration of previously reconstructed gated-PET images. All voxels corresponding to bone tissue, with high 18F-NaF uptake and no (or little) cardiac motion observed, where set to zero in order to obtain a better definition of the MVFs. We also performed a median filter (3 × 3 × 3 kernel size) in order to reduce the noise in the gated images. As in the simulated datasets for the TPTV system, 5 iterations and 21 subsets were used in the reconstructions. A Gaussian filtering (FWHM of 2.0 mm in both OSEM and MoCo reconstructions) was applied after each iteration. We evaluated the LBRmax and LBRmean values for all the calcified lesions with positive 18F-NaF PET uptake. The background region was defined as the blood pool in the middle of the left ventricle.
2.3. Single respiratory or cardiac MoCo
A single respiratory (R-MoCo) or cardiac (C-MoCo) was used in the simulations and in phantom experiment 'Exp2', respectively. We used the STIR C++ reconstruction software (Thielemans et al 2012). STIR is open source software for use in tomographic imaging, which is focused especially on iterative image reconstruction in PET and SPECT. STIR supports off-line image reconstruction by using several different algorithms and system geometries, it also incorporates most of the corrections traditionally performed in PET (attenuation, scatter, normalization, dead time, decay, etc), and for this reason has received widespread acceptance in the field of nuclear medicine.
Figure 2 shows a general scheme of the MoCo + PVC reconstruction framework implemented in this work. For the MoCo reconstruction, we use the emission and attenuation sinograms ( and Abg) and the MVFs (
 and
and  ) for each gate g. The MVFs are used to generate a series of gated attenuation images from the attenuation image that corresponds to the reference gate. These images are then projected into sinogram space, thus, obtaining the gated attenuation sinograms used in MCIR. Finally, the PVC is performed for the MoCo images, obtaining a MoCo + PVC image (see section 2.5).

Figure 2. General scheme of the MoCo + PVC reconstruction framework. For the MoCo reconstruction, we use the emission and attenuation sinograms ( and Abg) and the MVFs (
 and
and  ) for each gate g. The PVC is performed in the MoCo images, obtaining a MoCo + PVC image.
Download figure:
Standard image High-resolution imageFor the motion compensation we make use of an iterative algorithm with a common regularization approach (equation (1)): the ordered subsets maximum a posteriori one-step-late, i.e. OSMAPOSL (Green 1990a, 1990b), which is freely available within the STIR library (Thielemans et al 2012). This algorithm was extended (Tsoumpas et al 2013) to include motion information in order to reconstruct all respiratory or cardiac gates into one reference frame. The corresponding MoCo-IR equation for incorporating the motion compensation within the system matrix is (Tsoumpas et al 2013):
where  is the estimated radioactivity at voxel v and sub-iteration s.
  is the number of measured coincident photons of each detector pair b that belongs to the lth subset S and gate g. Sl is the lth subset of the projection space, which is divided into L total subsets. s is the sub-iteration number. Pbv is the system projection matrix.
  and
and  represent the forward and backward warping operations of the image that move the activity form one location to another. The operator
  acts to warp all respiratory or cardiac gates to the reference gate, while the operator
  'unwarps' the reference gate to each gate. Finally, Abg and Bbg are the attenuation coefficient and background terms for each bin and gate. No regularization was used in any of the reconstructions in order to compare images reconstructed using exactly the same settings. The above mentioned method for motion compensation is expected to work well, provided that accurate models for the respiratory and/or cardiac motion are available.
The MVFs used for the single respiratory (R-) or cardiac (C-) MoCo reconstruction were estimated from the co-registration of previously reconstructed gated PET images to a reference gate (end-expiration for respiratory gating and diastole for cardiac gating). The MIRT (Medical Image Registration Toolbox) software (Myronenko and Song 2010) was used in Matlab for the co-registration of the gated images.
In the simulated datasets (see section 2.1), the accuracy of the estimated MVFs at different levels of noise (MVF obtained from ideal gated images with no noise and gated images obtained from acquisitions with 500 M and 100 M counts) was evaluated by direct comparison, at different volumes of interest (VOIs), of these MVFs with the original MVFs used for creating the reference gated images. Six VOIs were used for the evaluations, as depicted in figure 3.

Figure 3. VOIs used for the evaluation of the accuracy of the estimated MVFs. These VOIs comprise the four simulated plaque lesions (numbers 1–4), one of the ribs (5) and one backbone (6).
Download figure:
Standard image High-resolution image2.4. Joint respiratory and cardiac motion compensation (RC-MoCo)
For the experimental data in which both respiratory and cardiac motions were present (phantom experiment 'Exp3' and all patient scans), respiratory and cardiac motion compensation (RC-MoCo) is required. In these cases we used a joint RC-MoCo, which first models the respiratory motion using markerless motion detection, and corrects for it in the projection space prior to image reconstruction, and then applies the cardiac MoCo during the reconstruction process. The proposed method is illustrated in figure 4. Given the main potential application of the method being cardiac PET, we assume that cardiac triggers are available from an electrocardiogram (ECG). In contrast, no respiratory triggers where acquired, which is in fact the case in all cardiac studies evaluated in this work. The procedure is described in the following:
- The respiratory signal is obtained by using a data-driven motion detection (Büther et al 2009), which measures the changes in count rates within a volume of interest (VOI) clearly affected by motion (the diaphragm was used in this work). We used a center-of-mass (CoM) analysis of the count-rate of the sinogram bins connected with the projection of the segmented diaphragm. The count-rate analysis is performed using a 100 ms time-division of the LM file (Lassen et al 2015).
- The respiratory signal is used for a subsequent amplitude-based (5-95-percentile of the respiratory range in the patient data, full respiratory range for the phantom studies) binning of the LM data. The respiratory gated sinograms (4 in this study) are reconstructed using the STIR software, without attenuation correction.
- The ideal projections (without noise) of the gated non-attenuation-corrected (NAC) PET images obtained in the previous step are used for the definition of motion vector fields (sMVFs) in the projection space for each gated sinogram. This co-registration was performed using the MIRT toolbox (Myronenko and Song 2010).
- These MVF are used for MoCo of each event in the listmode data. The transformed data is then stored in a new 'respiratory motion-free' listmode (LM) file. To ensure correct normalization of the new LM data, we applied a correction factor to each event in the LM file, computed as the ratio of the normalization factors of the original and the motion-compensated positions.
- The original cardiac triggers are also stored in the new LM-data and used to create cardiac-gated sinograms.
- These sinograms are then reconstructed using the MoCo method described in section 2.3. The cardiac iMVFs were obtained from a non-rigid co-registration of prior reconstructed cardiac-gated PET images, by using the MIRT software (Myronenko and Song 2010).

Figure 4. General scheme of the proposed respiratory and cardiac MoCo. First, the respiratory signals are extracted from the PET raw data and used to create respiratory sMVF. Each event in the LM is corrected for respiratory motion using the previous sMVF (MoCo-LM) and stored in a new LM file. This LM file is then binned in cardiac gates, by using the available ECG triggers or a data-drive cardiac gating approach. The cardiac-gated PET sinograms, together with the iMVF are then used for the MoCo-IR, resulting in a RC-MoCo image. The PVC is performed in the RC-MoCo image, obtaining a RC-MoCo + PVC image.
Download figure:
Standard image High-resolution imageFurther details about the markerless respiratory motion detection and compensation can be found in Lassen (2017).
2.5. Partial volume correction (PVC)
Here, we employ the LP method for PVC of the PET images (Moore et al 2012, Cal-González et al 2015). The LP method is used as a post-processing step after reconstruction. This method employs a segmentation of typically a few tissues within a small volume of interest centred on the lesion to be analyzed, as shown in figure 5 (for J = 2 tissues). The measured emission projection counts, λ, are modelled as the sum of the projection counts from each segmented tissue (with unit-activity concentration), scaled by their respective activity, plus the counts coming from the global background outside the VOI, as shown in equation (4):
where λi are the expected counts per sinogram bin, i, Aj the activity for each segmented tissue j within the VOI, Pij is the resolution-blurred tissue shape function for tissue j and sinogram bin i and  represents the background counts coming from the region outside the VOI.

Figure 5. Illustration of the procedure employed to improve the quantification of the reconstructed images within the VOI using the activities computed with the LP method, for a simple case of 2-segmented tissues. The VOI include the lesion-of-interest (in black) and a soft-tissue background (gray).
Download figure:
Standard image High-resolution imageThe joint likelihood of measuring a given projection data set, n, is given by the product of the Poisson probability density function for each measured projection ray, i, over all rays traversing the VOI:
Where  are the measured counts per LOR. Taking the logarithm of the likelihood, we obtain:

When substituting the λi values with equation (4):

The tissue-activities Aj are determined by maximizing the log likelihood (equation (4)) for the expected value λi. This can be done by taking derivatives of ln(L) with respect of each tissue-activity Aj and setting the results to zero:
Note that the equations in (8) cannot be solved analytically for the unknown Aj'. Instead, an iterative solution for these equations is sought, thus the values of  ,
,  and Aj are updated per iteration k.
The tissue-activities obtained by the LP method are being used as a prior in a new reconstruction procedure, performed with the STIR software (Thielemans et al 2012), in order to obtain a locally PVC-PET image (figure 5). First, the system matrix values (Pij) for each tissue and the global background gout,i that affects the VOI are computed. Later, the LP tissue-activities are obtained and the activity in each voxel within the VOI is substituted with the tissue-activities obtained with the LP method. The resulting image is forward projected using the STIR projector and the obtained sinogram is reconstructed using STIR resulting in a PVC image (see Cal-Gonzalez et al (2017) for details).
3. Results
3.1. Simulated datasets
Table 2 and figure 6 show the estimated mean MVFs values (in mm) from respiratory-gated PET images, reconstructed without noise and with the noise corresponding to a total of 500 M and 100 M counts. The reference MVFs, used for creating the simulated datasets, are also shown in the table and figure. The accuracy of the estimated MVFs, and therefore, of the R-MoCo approach, is directly related with the amount of noise in the gated PET images used for the estimation of the MVFs.
Table 2. Estimated mean MVF values (mm) within the VOIs depicted in figure 3.
| VOI | Original MVFs (mm) | Estimated MVFs no noise (mm) | Estimated MVFs 5 · 108 counts (mm) | Estimated MVFs 108 counts (mm) | ||||||||
|---|---|---|---|---|---|---|---|---|---|---|---|---|
| MVFx | MVFy | MVFz | MVFx | MVFy | MVFz | MVFx | MVFy | MVFz | MVFx | MVFy | MVFz | |
| 1 | −4.7 | 3.0 | 2.5 | −3.7 | 2.4 | 2.9 | −3.4 | 2.5 | 3.1 | −3.0 | 2.6 | 3.3 |
| 2 | −4.3 | 4.1 | 3.4 | −3.3 | 3.5 | 3.7 | −3.0 | 3.3 | 3.6 | −2.5 | 2.7 | 3.5 |
| 3 | −2.5 | 4.6 | 4.3 | −2.7 | 3.1 | 3.0 | −1.7 | 2.1 | 2.3 | −1.4 | 1.5 | 2.0 |
| 4 | −1.6 | 2.5 | 4.8 | −3.3 | 2.1 | 1.4 | −1.1 | 0.6 | 0.9 | −1.1 | 0.3 | 0.5 |
| 5 | −0.2 | −3.0 | 3.3 | −0.2 | −2.4 | 2.7 | 0.1 | −2.1 | 2.3 | 0.0 | −1.7 | 1.8 |
| 6 | 0.0 | −0.1 | 0.0 | 0.0 | 0.0 | 0.2 | −0.4 | 0.0 | 0.2 | −0.9 | 0.0 | 0.2 |
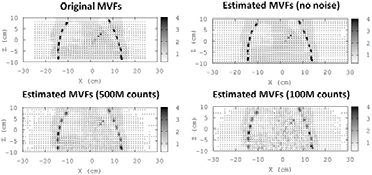
Figure 6. Top: left—original MVFs used for the generation of the gated sinograms. Right—estimated MVFs obtained from ideal gated reconstructions without any noise. Bottom: estimated MVFs obtained from gated reconstructions at 500 million (left) and 100 million total counts (right). Images and MVFs obtained for the Biograph TPTV system, gate 4 (reference: gate 2). Small MVF values were obtained in regions with uniform or low PET activity. This is because the gated PET images are not appropriate to estimate motion in these regions.
Download figure:
Standard image High-resolution imageFigure 7 shows the Static, R-MoCo and R-MoCo + PVC images in the Biograph mCT system. Similar images were obtained for the Biograph TPTV system. In general, we observe a significant improvement of the detectability and quantification of the small plaque lesions when the MoCo is applied. Further improvements are observed when R-MoCo + PVC are applied. This is demonstrated in figures 8 and 9, where we plot the LBRmax (figure 8) and bias values (figure 9) for all the plaque lesions. In addition, figure 10 shows the noise in the reconstructed images, measured from a VOI located in a region with uniform activity.

Figure 7. From top to bottom: reference image, down sampled to PET resolution. Of note, the reference image used in the simulations had a resolution of 1 × 1 × 1 mm3. Image reconstructed without motion, static reconstruction with simulated motion, single-gate image of a 4-gated reconstruction, MoCo and R-MoCo + PVC images. Left: images at high counts (500 million). Right: images at low counts (100 million). Images obtained for the Biograph mCT system.
Download figure:
Standard image High-resolution image
Figure 8. LBRmax for all the simulated plaques, at different number of iterations (each iteration comprises 21 image updates), for the Biograph TPTV (left) and the Biograph mCT (right). The LBRmax values for the static reconstructions are shown in red, for the single-gate images in green, R-MoCo in blue and R-MoCo + PVC in black. Reconstructions with 500 million counts are represented in solid curves, while 100 million counts are dashed curves.
Download figure:
Standard image High-resolution image
Figure 9. Bias (%) for all the simulated plaques, at different number of iterations (each iteration comprises 21 image updates), for the Biograph TPTV (left) and the Biograph mCT (right). The bias values for the static reconstructions are shown in red, for the single-gate images in green, R-MoCo in blue and R-MoCo + PVC in black. Reconstructions with 500 million counts are represented in solid curves, while 100 million counts are dashed curves.
Download figure:
Standard image High-resolution image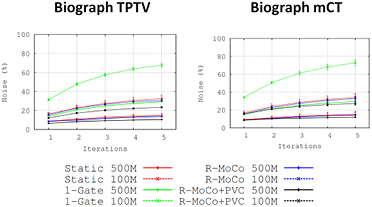
Figure 10. Noise measured in images reconstructed at different number of counts in the sinogram. Static OSEM reconstructions are shown in red, single-gate in green, R-MoCo in blue and R-MoCo + PVC in black. Reconstructions with 500 million counts are represented in solid curves, while 100 million counts are dashed curves.
Download figure:
Standard image High-resolution imageTable 3 presents the LBRmax and LBRmean values for the simulated plaque in each case, while their relative changes (ΔLBR) after applying the R-MoCo and PVC corrections are shown in table 4. The values in the figures and in the table demonstrate clearly the impact of motion compensation and PVC in the NaF uptake in coronary arteries, with ΔLBRmax values between 120 and 945% for the MoCo + PVC images and between 200 and 1119% for the tissue-activities obtained with the LP method.
Table 3. LBR values for the simulated vulnerable plaques in the Biograph TPTV and mCT systems, after a reconstruction with 5 iterations and 21 subsets and 500 million acquired counts. LBRmax (Image) correspond to the values obtained from the reconstructed images and LBR (LP method) correspond to the values obtained from the tissue-activities computed with the LP method. These values are calculated as the LP tissue-activity for the lesion divided by the measured activity in the background region. The table shows the mean values and their corresponding SD for the five reconstructions performed in this work.
| LBR (ref) | LBRmax (image) | LBRmean (image) | LBR (LP method) (R-MoCo image) | ||||
|---|---|---|---|---|---|---|---|
| Static | R-MoCo | R-MoCo + PVC | Static | R-MoCo | R-MoCo + PVC | ||
| Biograph TPTV | |||||||
| 70 | 4.0 ± 0.09 | 15.8 ± 0.3 | 41.9 ± 0.5 | 3.38 ± 0.07 | 10.86 ± 0.18 | 20.6 ± 0.3 | 48.9 ± 0.9 |
| 50 | 4.50 ± 0.10 | 9.82 ± 0.18 | 31.1 ± 0.3 | 3.49 ± 0.07 | 7.08 ± 0.11 | 15.6 ± 0.2 | 32.2 ± 0.6 |
| 20 | 2.03 ± 0.04 | 2.51 ± 0.05 | 15.6 ± 0.2 | 1.81 ± 0.03 | 2.15 ± 0.03 | 7.22 ± 0.08 | 15.9 ± 0.3 |
| 10 | 1.70 ± 0.04 | 1.52 ± 0.03 | 3.74 ± 0.04 | 1.41 ± 0.03 | 1.34 ± 0.02 | 2.36 ± 0.03 | 5.10 ± 0.10 |
| Biograph mCT | |||||||
| 70 | 4.39 ± 0.10 | 15.8 ± 0.3 | 40.8 ± 0.6 | 3.60 ± 0.08 | 10.9 ± 0.2 | 18.6 ± 0.3 | 51.6 ± 1.1 |
| 50 | 3.78 ± 0.09 | 11.0 ± 0.2 | 28.9 ± 0.4 | 3.06 ± 0.07 | 7.79 ± 0.16 | 15.4 ± 0.2 | 35.3 ± 0.7 |
| 20 | 2.00 ± 0.05 | 2.52 ± 0.05 | 16.2 ± 0.2 | 1.74 ± 0.04 | 2.10 ± 0.04 | 5.63 ± 0.08 | 16.4 ± 0.3 |
| 10 | 1.47 ± 0.03 | 1.74 ± 0.04 | 5.66 ± 0.08 | 1.17 ± 0.03 | 1.46 ± 0.03 | 3.38 ± 0.05 | 7.70 ± 0.16 |
Table 4. LBR values for the simulated vulnerable plaques in the Biograph TPTV and mCT systems, after a reconstruction with 5 iterations and 21 subsets and 500 million acquired counts. LBRmax (Image) correspond to the values obtained from the reconstructed images and LBR (LP method) correspond to the values obtained from the tissue-activities computed with the LP method. The table shows the mean values and their corresponding SD for the five reconstructions performed in this work.
| LBR (ref) | ΔLBRmax (%) | ΔLBRmean (%) | ΔLBR–LP method (%) (R-MoCo image) | ||
|---|---|---|---|---|---|
| R-MoCo | R-MoCo + PVC | R-MoCo | R-MoCo + PVC | ||
| Biograph TPTV | |||||
| 70 | 294 | 945 | 221 | 509 | 1119 |
| 50 | 118 | 591 | 103 | 347 | 616 |
| 20 | 24 | 668 | 19 | 299 | 683 |
| 10 | −11 | 120 | −5 | 67 | 200 |
| Biograph mCT | |||||
| 70 | 260 | 829 | 203 | 417 | 1075 |
| 50 | 191 | 665 | 155 | 403 | 834 |
| 20 | 26 | 710 | 21 | 224 | 720 |
| 10 | 18 | 285 | 25 | 189 | 424 |
3.2. Markerless detection of respiratory motion (phantom experiments and patient data)
The markerless detection of respiratory motion was evaluated on the moving phantom (Exp3), using the Anzai respiratory belt as reference (Anzai Medical, Japan). Figure 11(A) shows the frequency spectra obtained by means of a FFT analysis and the filtered respiratory signal, together with the signal obtained with the Anzai respiratory belt. In addition, figure 11(B) shows the frequency spectra and the filtered respiratory signal for one of the 18F-NaF scans (patient 1). As expected, we obtained a strong respiratory peak in the Fourier spectrum for the phantom experiment (regular periodic motion), while for the patient we obtained a broad peak between 0.1 and 0.4 Hz, due to the more irregular motion of the patients.
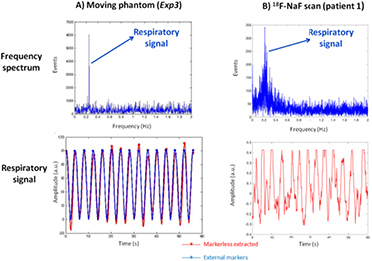
Figure 11. Frequency spectra (top) and filtered respiratory signals (bottom) obtained from the PET raw data in acquisitions of the moving phantom (Exp3, (A)) and an 18F-NaF scan of one of the pilot patients (patient 1, (B)). In the case of the moving phantom (A), the comparison with the respiratory signal obtained from the tracking system is included. The respiratory signals (red: markerless extracted, blue: external tracking system) are represented in arbitrary units (a.u.). A 5-95-percentile of the respiratory range was used in the patient data, while the full respiratory range was used for the phantom studies.
Download figure:
Standard image High-resolution imageThe measured respiratory translations of the diaphragm (axial direction only) from the respiratory-gated NAC-PET reconstructions are shown in table 5, for the phantom experiment (Exp3) and for all the patient scans.
Table 5. Respiratory translations of the diaphragm, measured from the respiratory NAC-gated images (axial direction only). These translations are measured from the gates corresponding to end-expiratory (reference) and inspiratory phases.
| Respiratory translation of the diaphragm (axial) | ||||
|---|---|---|---|---|
| Mean (mm) | Min (mm) | Max (mm) | Reference (mm) | |
| Phantom (Exp3) | 19.7 | 17.8 | 21.3 | 20.0 |
| 18F-NaF scan (patient 1) | 13.7 | 10.9 | 15.6 | - |
| 18F-NaF scan (patient 2) | 19.2 | 13.8 | 23.1 | - |
| 18F-NaF scan (patient 3) | 14.5 | 13.0 | 15.2 | - |
| 18F-NaF scan (patient 4) | 15.7 | 13.2 | 18.7 | - |
3.3. RC-MoCo and PVC in phantom experiments
Figure 12 shows the images of the phantom with not motion (Exp1), with and without PVC; together with the static, MoCo and MoCo + PVC images of the moving phantom, for the acquisitions Exp2 and Exp3. The LBRmax and LBRmean values for the three lesions are presented in table 6, while their relative changes (ΔLBR) after applying the MoCo and PVC corrections are shown in table 7.
Table 6. LBRmax and LBRmean values measured for each plaque-type lesion in the thorax phantom images with and without MoCo and PVC. LBR values obtained by using the tissue-activities computed by the local-projection approach (LP method) are also included. For the first acquisition (Exp1)—without motion—only the static and PVC values are presented. In Exp2 we present the results with cardiac MoCo (C-MoCo) and PVC (C-MoCo + PVC). Finally, in Exp3 we present the respiratory MoCo (R-MoCo), the joint respiratory and cardiac MoCo (RC-MoCo) and its combination with PVC (RC-MoCo + PVC). Experiments performed in the Biograph mCT PET/CT system.
| ACQ | Volume lesion (mm3) | LBRmax (image) | LBRmean (image) | LBR (LP method) | ||||
|---|---|---|---|---|---|---|---|---|
| Static | MoCo | Static + PVC | Static | MoCo | Static + PVC | Static | ||
| Exp1 (no motion) | 36 | 5.63 | — | 18.8 | 3.74 | — | 9.7 | 21.9 |
| 31 | 4.96 | — | 18.0 | 4.29 | — | 10.4 | 20.6 | |
| 18 | 3.02 | — | 5.82 | 2.90 | — | 4.35 | 12.6 | |
| Static | C-MoCo | C-MoCo + PVC | Static | C-MoCo | C-MoCo + PVC | C-MoCo | ||
| Exp2 (C motion C-MoCo) | 36 | 3.48 | 6.76 | 18.4 | 2.45 | 5.13 | 10.0 | 22.6 |
| 31 | 3.74 | 3.87 | 13.1 | 2.95 | 3.59 | 7.44 | 19.2 | |
| 18 | 2.94 | 2.64 | 6.2 | 1.84 | 2.39 | 4.02 | 9.18 | |
| Static | MoCo (R/RC) | RC-MoCo + PVC | Static | MoCo (R/RC) | RC-MoCo + PVC | RC-MoCo | ||
| Exp3 (RC motion RC-MoCo) | 36 | 2.73 | 3.47/5.27 | 14.8 | 2.45 | 3.19/4.43 | 8.63 | 18.9 |
| 31 | 2.73 | 3.13/4.00 | 14.6 | 2.27 | 2.45/3.70 | 8.36 | 19.5 | |
| 18 | 2.12 | 2.69/2.76 | 5.45 | 1.89 | 2.46/2.59 | 3.74 | 10.2 | |
Table 7. ΔLBRmax and ΔLBRmean values measured for each plaque-type lesion in the thorax phantom images after applying the MoCo and PVC. The ΔLBR values obtained by using the tissue-activities computed by the local-projection approach (LP method) are also included.
| ACQ | Volume lesion (mm3) | ΔLBRmax (%) | ΔLBRmean (%) | ΔLBR–LP method (%) | ||
|---|---|---|---|---|---|---|
| MoCo | Static + PVC | MoCo | Static + PVC | Static | ||
| Exp1 (no motion) | 36 | — | 234 | — | 159 | 289 |
| 31 | — | 263 | — | 142 | 315 | |
| 18 | — | 93 | — | 50 | 317 | |
| C-MoCo | C-MoCo + PVC | C-MoCo | C-MoCo + PVC | C-MoCo | ||
| Exp2 (C motion C-MoCo) | 36 | 94 | 429 | 109 | 308 | 549 |
| 31 | 3 | 250 | 22 | 152 | 413 | |
| 18 | −10 | 111 | 30 | 118 | 212 | |
| MoCo (R/RC) | RC-MoCo + PVC | MoCo (R/RC) | RC-MoCo + PVC | RC-MoCo | ||
| Exp3 (RC motion RC-MoCo) | 36 | 27/93 | 442 | 30/81 | 252 | 592 |
| 31 | 15/47 | 435 | 8/63 | 268 | 614 | |
| 18 | 27/30 | 157 | 30/37 | 98 | 381 | |
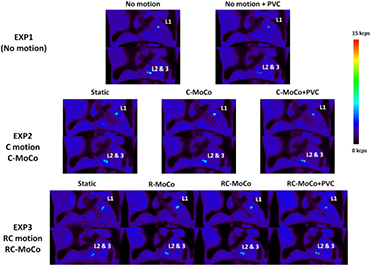
Figure 12. Coronal views, centered in plaque-type lesions L1 (top) and L2 and 3 (bottom), of the Static, MoCo and MoCo + PVC images. The figure shows the reconstructed images for Exp1 (no motion), Exp2 (cardiac motion (C motion) and cardiac MoCo (C-MoCo)) and for Exp3 (respiratory and cardiac motion (RC motion), respiratory MoCo (RC-MoCo)). Experiments performed in the Biograph mCT PET/CT system.
Download figure:
Standard image High-resolution imageAs expected, a significant improvement in the visual aspect of the plaques (figure 11) was achieved when MoCo + PVC were performed, giving images closer to the ones obtained in the static acquisition (Exp1). This assumption is reinforced with the increase observed in the LBRmax values of the plaques for the MoCo + PVC images. Further improvement of the LBR values can be observed when using the tissue-activities from the LP method, applied from the MoCo image (right column on table 6).
As shown in table 7, higher relative changes in the LBR values were observed when applying the RC-MoCo + PVC in the moving phantom with both respiratory and cardiac motions incorporated (ΔLBRmax values in Exp3 between 157 and 442% for the RC-MoCo + PVC images and between 381 and 614% for the LP method).
3.4. RC-MoCo and PVC in pilot patient data
In total, 6 plaque lesions with increased 18F-NaF uptake were observed. The static OSEM, R-MoCo, RC-MoCo and RC-MoCo + PVC images obtained with the STIR software are shown in figure 13, together with the AC-CT image. Notably, the calcified plaques are easier to see when MoCo and PVC are applied. The PVC further improves the delineation of the lesion on PET with the lesion detected in the Ca-score CT.

Figure 13. Fusion of AC-CT and static (left), R-MoCo (center, left), RC-MoCo(center, right) and RC-MoCo + PVC PET images of a patient with atherosclerotic plaque in the mitral valve. Center—same images for another patient with atherosclerotic plaque in the LCA. Bottom—images for patient 3, with increased 18F-NaF uptake in the RCA.
Download figure:
Standard image High-resolution image
The LBRmax and LBRmean values, obtained from the images (Static, R-MoCo, RC-MoCo and RC-MoCo + PVC) and from the LP method (for the RC-MoCo images) are shown in table 8. These values were computed by dividing the LP tissue-activity for the lesion and the mean activity of the background VOI. Table 9 shows the ΔLBR values when applying R-MoCo, RC-MoCo, RC-MoCo + PVC and the tissue-activities values directly obtained from the LP method. As expected, a significant increase in the LBR can be observed when RC-MoCo and PVC are incorporated into the reconstruction (ΔLBRmax values between 31 and 211% for the RC-MoCo + PVC images and between 46 and 373% for the LP method). Furthermore, we can observe a bigger effect of the PVC (higher ΔLBR values when the size of the segmented plaque is smaller).
Table 8. LBR for the vulnerable plaques identified in the analyzed patients. These values were obtained from the reconstructed images: static, respiratory MoCo (R-MoCo), joint respiratory and cardiac MoCo (RC-MoCo) and its combination with PVC (RC-MoCo + PVC). The tissue-activities computed by the local-projection approach (LP method) on the RC-MoCo images are also included. Patient data acquired in the Biograph TPTV PET/CT system.
| ACQ | Plaque ID | Size of segmented plaque (mm3) | LBRmax (image) | LBRmean (image) | LBR (LP method) | ||||
|---|---|---|---|---|---|---|---|---|---|
| Static | MoCo (R/RC) | RC-MoCo + PVC | Static | MoCo (R/RC) | RC-MoCo + PVC | RC-MoCo | |||
| Patient 1 | 1 | 121 | 1.70 | 1.84/2.23 | 5.09 | 1.33 | 1.42/1.64 | 2.13 | 4.90 |
| 2 | 71 | 1.36 | 1.49/1.77 | 4.23 | 1.21 | 1.22/1.35 | 2.06 | 6.43 | |
| Patient 2 | 1 | 597 | 2.51 | 2.70/3.26 | 4.88 | 1.74 | 2.09/2.44 | 3.66 | 4.93 |
| 2 | 927 | 2.37 | 2.17/2.31 | 3.10 | 1.61 | 1.76/1.95 | 2.40 | 3.46 | |
| Patient 3 | 1 | 286 | 1.67 | 1.69/2.08 | 4.67 | 1.49 | 1.50/1.73 | 2.25 | 5.23 |
| Patient 4 | 1 | 522 | 1.62 | 2.00/2.68 | 2.97 | 1.26 | 1.55/2.17 | 2.24 | 2.84 |
Table 9. ΔLBR values after applying the MoCo and PVC for the vulnerable plaques identified in the analyzed patients. The ΔLBR values obtained by using the tissue-activities computed by the local-projection approach (LP method) are also included.
| ACQ | Plaque ID | Size of segmented plaque (mm3) | ΔLBRmax (%) | ΔLBRmean (%) | ΔLBR–sLP method (%) | ||
|---|---|---|---|---|---|---|---|
| MoCo (R/RC) | RC-MoCo + PVC | MoCo (R/RC) | RC-MoCo + PVC | RC-MoCo | |||
| Patient 1 | 1 | 121 | 8/31 | 199 | 7/24 | 61 | 188 |
| 2 | 71 | 10/30 | 211 | 0/11 | 70 | 373 | |
| Patient 2 | 1 | 597 | 8/30 | 94 | 20/40 | 111 | 96 |
| 2 | 927 | −9/− 2 | 31 | 10/21 | 49 | 46 | |
| Patient 3 | 1 | 286 | 1/24 | 179 | 1/17 | 51 | 212 |
| Patient 4 | 1 | 522 | 23/66 | 84 | 23/73 | 78 | 76 |
4. Discussion
We implemented a combined MoCo and PVC approach for PET data in PET/CT imaging within the STIR reconstruction framework. For cases in which only respiratory or cardiac motion were modelled, we used the MoCo-IR-OSMAPOSL algorithm within the STIR library (Thielemans et al 2012) as developed by Tsoumpas et al (2013) to account for motion during the image reconstruction. For cases in which both respiratory and cardiac motion were present, we implemented a joint RC-MoCo, which makes use of a markerless respiratory motion detection and compensation in the LM data, in combination with a cardiac motion modelling and correction during the reconstruction. Further, we used the LP method, previously described for SPECT (Moore et al 2012) and for PET (Cal-Gonzalez et al 2017), for the PVC. The clinical implementation of the LP method was performed only as a post-processing step, which, together with the additional STIR reconstruction, results in a PVC image. The simulated datasets, which contained plaques with different uptakes, were designed in order to evaluate the correct performance of the implemented MoCo and PVC methods. In addition, three experimental phantom measurements, one static and two with respiratory and/or cardiac motion, were also performed and evaluated in this work. The MVFs in these simulations were estimated by using a co-registration of previously reconstructed respiratory- or cardiac-gated PET images. Finally, the MoCo + PVC approach was evaluated in a small cohort of four patients with atherosclerotic plaques. Table 10 summarizes all simulated and experimental data evaluated in this work, as well as the motion modelling and motion compensation approaches used in each case.
Table 10. Summary of the motion models and MoCo + PVC approaches implemented and evaluated in this work.
| Motion model (described in) | MoCo (described in) | PVC (described in) | |
|---|---|---|---|
| Simulated data | Only respiratory (section 2.1) | MoCo-IR-OSMAPOSL (section 2.3) | LP method (section 2.5) |
| Phantom Exp2 | Only cardiac (section 2.2) | MoCo-IR-OSMAPOSL (section 2.3) | LP method (section 2.5) |
| Phantom Exp3 | Respiratory + cardiac (section 2.2) | Joint RC-MoCo (section 2.4) | LP method (section 2.5) |
| Patient data | Respiratory + cardiac (section 2.2) | Joint RC-MoCo (section 2.4) | LP method (section 2.5) |
The performance of the MoCo and PVC approaches depends on several factors, such as: the accuracy in the estimation of the respiratory or cardiac MVFs, the performance of the MoCo approaches, the accuracy of the segmentation used for the PVC and the performance of the PVC itself.
The accuracy of the estimated MVFs was evaluated in the simulated data, as shown in table 2 and figure 5. In general, we obtained a good estimation of the MVFs in regions with significant motion-induced changes of the activity distribution due to motion (lesions 1 and 2, ribs, etc). As expected, in regions with uniform activity or plaques with relatively low uptake (lesions 3 and 4), the MVFs estimated from the gated PET images were less accurate. Furthermore, the accuracy of the MVFs was also reduced when increasing the noise in the images. We observed a noticeable reduction of the accuracy of the MVFs obtained from the simulated cases with 100 million counts (25 million per gate if using 4 gates). The dependency of the MVFs with the noise in the images might be reduced by using other registration algorithms less affected by noise. The comparison of the MVFs obtained with the MIRT software against other co-registration algorithms (Gigengack et al 2012a, 2012b) will be performed in future studies.
The performance of the MCIR-OSMAPOSL algorithm used to correct for motion during the reconstruction was already evaluated by Tsoumpas et al (2013), providing reliable results when using accurate motion models. The accuracy of the proposed LM-based MoCo for complex respiratory motion patterns is still under investigation, and will be evaluated in further studies.
The performance of the PVC method depends on the accuracy in the segmentation of the plaque and the co-registration with the anatomical reference image. In the simulations, as these requisites were met, we obtained good recoveries of the plaque activities, close to the reference values. However, in the phantom experiments, as we did not have a clear anatomical reference of the plaques (the plaques were segmented directly from the PET images of the static acquisitions without motion), the performance of the PVC was inferior to the simulated cases.
As shown in figure 7, MoCo + PVC images demonstrate a significant improvement of the visual assessment of the simulated lesions. Figures 8, 9 and tables 3, 4 show a significant improvement in the quantification of the lesions (LBRmax, LBRmean and bias values) when MoCo and PVC are used. The LBR values obtained with the LP method were more accurate than the values obtained from the images (table 3). This is due to the additional reconstruction process used to obtain de MoCo + PVC image, which may affect the quantitative accuracy of the performed measures.
The performance of the MoCo + PVC approach is clearly dependent on the number of acquired counts, as shown by figures 8 and 9. In general, we observed a reduction of the LBRmax and an increase of the bias values when reducing the number of reconstructed counts. This is due, as mentioned above, to the fact that the accuracy of the estimated MVFs is reduced with lower number of counts.
As pointed out by Delso et al (2011) and by Petibon et al (2014), not only cardiac motion may degrade the image quality of the cardiac images. In fact, the displacement of the lesion due to respiratory motion is typically larger than the displacement due to cardiac contraction (Delso et al 2011). Dual respiratory-cardiac gating approaches were proposed previously to model and to correct for both respiratory and cardiac motions (Gigengack et al 2012a, Lamare et al 2014, Petibon et al 2014, Slomka et al 2015, Kolbitsch et al 2017). However, in our case, dual-gated approaches are challenging since the amount of acquired data is not sufficient to obtain dual-gated images with good noise properties to estimate the MVFs. Instead, we decided to use a joint RC-MoCo (described in section 2.4) which first correct for respiratory motion in the projection space before reconstruction, and then apply the cardiac MoCo during the reconstruction.
In the phantom experiment, we obtained good agreement between our markerless respiratory signal and the one obtained by using the respiratory belt (table 5 and figure 11). In addition, the axial respiratory translations (diaphragm) measured from the NAC-gated images were also in agreement with the respiratory range of the phantom (20 mm). In the patient scans, we obtained respiratory translations of the diaphragm between 13 mm and 23 mm, which are in accordance with other values published in the literature (Schwarz and Leach 2000).
As shown in figure 12 and tables 6 and 7, a significant improvement of the LBR of the experimental plaque lesions was observed when C-MoCo + PVC (Exp2) or RC-MoCo + PVC (Exp3) were performed. In addition, further improvement of the LBR values can be observed when using the tissue-activities from the LP method (tables 6 and 7).
For the lesions evaluated in both simulated data and phantom experiments, total recovery of the PVE was not achieved, thus, yielding LBR values from the PVC images or from the LP tissue-activities well below the reference values. This is because for these lesions the Nyquist sampling condition (lesion sizes bigger than 2 voxels in each spatial direction, voxel size 2.03 mm) is not satisfied, and therefore a full recovery of the lesion activities using the LP method is not possible (Cal-González et al 2015). Nonetheless, large activity-recovery values were obtained when applying the PVC method.
We observed a significant improvement of the lesion detectability and quantification in the RC-MoCo + PVC reconstructions of the pilot patient studies. Higher LBR of the calcified plaque was observed when respiratory and cardiac motions were included into the reconstruction. As expected, the PVC also made a significant impact in the quantitative accuracy of the calcified lesions, further increasing the LBR, as shown in figure 13 and tables 8 and 9. Similarly to the results obtained in the simulated and experimental phantom data, we observed higher increases of the LBR in the plaques when using directly the tissue-activities obtained with the LP method, without performing the additional reconstruction step to obtain the RC-MoCo + PVC image.
4.1. Limitations of the study and future work
The main limitation of the study is the lack of a proper evaluation of the RC-MoCo + PVC approaches with simulated data, in order to fully explore the accuracy of the estimated respiratory and cardiac MVFs and the performance of the LM-based respiratory MoCo. Such evaluation is currently under investigation and will be presented in future work.
A potential limitation of the phantom and patient studies presented in this paper is the possible lack of accuracy of the derived motion fields, due to the noisy nature of the gated PET images and intra-gate motion not taken into account. As a consequence, the increase in the LBR of the calcified lesions in the images is not as high as expected from the simulations.
Another important consideration is the number of gates chosen for the estimation of the MVFs (4 gates for both respiratory and cardiac motion modelling), which is below the standard number of gates used in clinical routine (usually 8 gates) and might have a negative impact on the performance of the MoCo + PVC due to uncorrected intra-frame motion. However, due to the high level of noise in our gated images, and using the results obtained from the simulations as reference, we considered that 4 gates would be the best choice to achieve a good compromise between intra-frame motion and noise. The optimal number of gates is a topic of further investigation.
In addition, the lack of time of flight (ToF) modelling in our reconstructions can be also considered a limitation of the study. This is due to the fact that using the TOF information in the reconstruction will result in better image contrast and lower noise, which can help to obtain more accurate MVFs from the noisy, gated PET reconstructions. Furthermore, the ToF information can also be used to improve a joint motion estimation and image reconstruction of PET data, as recently discussed by Bousse and colleagues (Bousse et al 2016).
Finally, correction for non-periodic motion will most likely require the generation of adaptable respiratory and cardiac motion models that will be integrated with list-mode reconstruction (King et al 2011).
5. Conclusion
A combined MoCo and PVC approach for PET/CT imaging systems was implemented within the STIR reconstruction framework. The simulated datasets, experimental and patient data demonstrate significant improvements in the quantification of small coronary lesions when MoCo and PVC are taken into account. The MoCo + PVC images are more suitable for visual assessment of the coronary plaques, while the LP tissue-activities obtained from the MoCo images are more adequate to perform quantitative evaluations. Using this method, we observed increased LBR's in the simulated plaques of up to 1119% when applying MoCo and PVC. In addition, LBR increased by up to 614% in the phantom experiments and 373% in the analyzed patients.
Acknowledgments
This work was supported by the EU COST Action TD1007. We acknowledge the Austrian Science Fund (FWF): I 3451-N32, for providing Open Access to the article. We acknowledge Benedikt Schmiedinger and Barbara Straubinger, PET/CT technologists at the General Hospital of Vienna, for their support acquiring the pilot patient data.