

Abstract
To increase the specific capacitance of supercapacitors, polyaniline (PANI) has been chosen as additive electrode material for the pseudocapacitive performance. Here, we synthesize a molecular-level uniform reduced graphene oxide/PANI (rGO/PANI) composite film with high flexibility and conductivity via self-assembly and specific thermal reduction, which performs great potential in flexible supercapacitors with high areal capacitance. Particularly, the electrode of rGO/PANI-42.9% exhibits a high specific areal capacitance (1826 mF cm−2 at 0.2 mA cm−2), and it also presents a good cycling stability (it remains 76% of its initial capacitance after 10 500 cycles). Moreover, the specific gravimetric capacitance of rGO/PANI-33.3% reaches up to 256.4 F g−1 at 0.2 A g−1, showing greatly enhanced performance compared with the pure rGO electrode (183 F g−1). The results of various characteristic analysis demonstrate that electrochemical performance of the as-prepared rGO/PANI film is closely associated with the uniform distribution of PANI in rGO/PANI composite. Overall, our reported method is convenient and environmental-friendly, and could be beneficial for the development of high-performance capacitive energy storage materials.
Export citation and abstract BibTeX RIS
1. Introduction
With the rapid development of energy storage technology, the sustainable, flexible and high-power density electrochemical supercapacitors meet an explosion in demand. There is a wide range application of the multifunction supercapacitors [1, 2], such as hybrid vehicles, mobile electronics, and flexible medical electronics [3], thus more and more researchers focus on the improvement of the supercapacitors' performance. The electric double layer capacitance (EDLC) and pseudocapacitance are two energy storage mechanisms of supercapacitors [4]. The EDLC widely exists in carbon-based electrodes with fast adsorption and desorption of ions at the interface of electrode and electrolyte. Carbon-based electrode material includes active carbon, carbon nanotubes, graphite, mesoporous carbon and so on. In 1997, Niu et al [5]. reported using CNTs as the electrode material in supercapacitors for the first time. In 2005, Barbieri et al [6]. investigated the appropriate surface area of ACs which can optimize the electrochemical performances of material. And various investigations were published then to improve the performance of this electrode material [7–9] since the structure, functional groups and specific surface area of carbon-based material play an important role in its electrochemical performances [10, 11]. Pseudocapacitance using Faraday reaction to store charge shows higher capacitance potential. It originated from the work of David C Grahame in 1941 and was further investigated by Conway and Gileadi [12]. RuO2 was first carried out as the pseudocapacitance electrode material in 1971 [13] and the conducting polymers materials were studied since the late of 1980s [14]. Recently, flexible supercapacitors were studied actively for a potential that to be used in wearable energy storage. Simotwo et al produced PANI/CNT/PEO nanofiber electrode for supercapacitors [15]. Han et al designed high-performance flexible asymmetric supercapacitors using carbon fiber textile [16]. Among various redox-active materials [17–20], PANI-based material aroused great interest for its low cost, stability, and rapid reversible redox reactions [21]. And, carbon-based materials, for example, carbon nanotubes [22], active carbon [23] and graphene [24, 25] have stable chemical features and large specific surface area, so that they are widely used as electrode active materials of supercapacitors [26, 27]. Moreover, in terms of suitable flexible electrodes, graphene and PANI composite films have been wildly reported as flexible electrodes of supercapacitors [28]. Wu et al designed and fabricated flexible Gr/PANI electrode with capacitance of 210 F g−1 at 0.3 A g−1 [29] and Meng et al reported porous 3D-rGO/PANI film as the electrode of flexible supercapacitors with superior rate performance [30] as well. The synergistic effect between Gr and PANI has also been another reason for the widely study of graphene/PANI composite material. So far, diverse methods have been proposed to introduce PANI into the graphene-based electrode in order to achieve high specific capacitances [4, 26, 31–33]. Polymerizing aniline in situ on graphene is the most conventional method to obtain high-performance graphene/PANI composite [15]. However, the nonuniform distribution of the PANI in composite still constrains its performance advantages, because it blocks the porous structure between graphene nanosheets, which contributes to good electrochemical performance [34]. Fabricating PANI/graphene-based electrode with molecular-level uniformity plays a crucial role in its performance enhancement. Through noncovalent interactions, for instance, hydrophobic interaction, hydrogen bonding, electrostatic and π–π stacking interactions, self-assembly method was proved that it can efficiently and precisely construct uniform composites using organized building units [35]. Various composites of graphene and polymers have been produced by self-assmebly [34, 36] However, the values of the capacitance obtained are still restricted by the nonuniformity of PANI on graphene. The amount of PANI that favors the uniformity of the composites is a crucial factor to further improvement of supercapacitors' performance.
In addition, the reduction of graphene oxide (GO) contributes to the performance of the PANI and reduced graphene oxide (rGO) composite. Numerous methods are available for reduction of GO, such as chemical reduction, microwave reduction, and thermal annealing [37, 38] Removing oxygen functional groups of GO can effectively improve the conductivity, yet rGO with residual oxygen functional groups can provide not only EDLC but also pseudocapacitance for supercapacitors. Thus, the balance between the oxygen content and the conductivity of rGO is an essential element when GO is reduced. Thermal annealing has been widely used as an eco-friendly reduction method, and a mild annealing condition at temperatures below 200 °C is reported to compromise between the conductivity and the oxygen content [39]. Compared to chemical reduction, thermal reduction introduces less function groups. However, thermal reduction usually causes curl, roughness and crack of rGO film because gases are released when GO is reduced, which will decrease the rGO film's flexibility. Therefore, further work should be down to increase the electrochemical and mechanical properties of PANI and rGO composites after thermal reduction.
In this report, we fabricate molecular-level uniform PANI and rGO composite film (rGO/PANI) and it performs great potential in flexible supercapacitors with high specific areal capacitance (Ca ). PANI and GO blend displaying molecular-level uniformity is associated with PANI's excellent solubleness in N-methyl-2-pyrrolidinone (NMP) solvent. After filtering the blend and specific mild thermal reduction at 160 °C, which is a temperature reported to be a mild thermal reduction condition benefiting the electrochemical performance of the rGO [39], the rGO/PANI electrode show good flexibility and high Ca of 1826 mF cm−2 at a current of 0.2 mA cm−2 in 1 M H2SO4 electrolyte through modifying the appropriate content of PANI. The performance of rGO/PANI interrelates with the uniformity of the composite which determined by the amount of PANI particles on rGO nanosheets as well as the excess of PANI that exist independently. Due to flexibility, stability, and electrochemical activity, our rGO/PANI composite film is expected as an important type of graphene/PANI-based electrodes in supercapacitors.
2. Experimental section
2.1. Materials
Ammonium persulfate, NMP, hydrogen peroxide, hydrochloric acid and sulfuric acid were purchased from Sinopharm Chemical Reagents Co., Ltd. Aniline was purchased from Shanghai Chemical Reagents Co., Ltd. All the reagents were analytically pure without any further purification,
2.2. Preparation of PANI
PANI was prepared by a method of chemical oxidation polymerization, which has been mentioned in previous report [24]. Typically, aniline (9.313 g, 0.10 mol) was added into hydrochloric acid solution (10 mol l−1) and named solution A. The solution obtained by dissolving ammonium persulfate (28.52 g, 0.125 mol) in deionized water (DIW, 51.5 ml) was added dropwise into solution A in an ice bath. After being stirred for 1 h at 0 °C, the dark block reaction product was collected by filtration, followed by washing repeatedly with deionized water. Then, the product was added to ammonia solution (100 ml, 30 wt%) so that it can be deprotonated. After stirring for 24 h, deionized water and alcohol were used continuously to wash the product in sequence. The dark blue PANI powder was ultimately yielded by drying at 50 °C for 24 h under vacuum.
2.3. Preparation of rGO/PANI based electrode
Firstly, put the uniform PANI powder (200 mg) obtained by grinding the PANI block inside the NMP solvent (100 ml) and then stirred for 12 h at room temperature so that homogeneous PANI solution in NMP (2 mg ml−1) was obtained. Then, took specific volume of PANI solution and dropped it into the prepared GO aqueous dispersion (10 ml, 2 mg ml−1), which was synthesized by a modified Hummers' method. As dropping the PANI solution, dark floccule of GO and PANI composite (GO/PANI) precipitated from the mixed solvent gradually. To get uniform product, the mentioned solution was treated with 0.5 h ultrasonication and then stirred for 2.5 h. The vacuum-assisted filtration was used to prepare GO/PANI film. After filtering for 50 min, a uniform and smooth film was produced. Subsequently, the as-made rGO/PANI film was transferred into beforehand vacuum oven settled at 160 °C for 24 h, and meanwhile, a stable force was exerted on the GO/PANI film using a flat ceramic plate. Finally, by controlling of the mass ratio of PANI with GO, flexible rGO/PANI films with different mass ratios of PANI: 9.1%, 20.0%, 33.3%, 42.9%, 50% and 60% were fabricated and name rGO/PANI-9.1%, rGO/PANI-20.0%, rGO/PANI-33.3%, rGO/PANI-42.9%, rGO/PANI-50% and rGO/PANI-60%, respectively. For the controlled experiment, PANI powder was directly added into GO dispersion and then the mixture was treated with 0.5 h ultrasonication and stirred for 2.5 h as well. After filtering for 50 min using the vacuum assisted filtration, GO/PANI-33.3% with nonuniform distribution of PANI particle was produced. Then the film was reduced to rGO/PANI-33.3% in the same way mentioned above.
2.4. Fabrication of all-solid-state supercapacitor
The fabricated rGO/PANI-33.3% film was placed on a piece of carbon paper which was used as current collector. The H2SO4/PVA gel electrolyte (4 g of PVA was added into 40 ml 1 M H2SO4 and then stirred at 95 °C) was carefully dropped on the electrode. The two as-prepared electrodes were stacked face to face with a filter paper inside as separator.
2.5. Material characterization
The morphology of the samples was characterized by field-emission scanning electron microscope (FE-SEM, Carl Zeiss Ultra 55) and transmission electronic microscope (FEI Talos F200X). FT-IR spectra were obtained with KBr pellets. The x-ray diffraction (XRD) was tested on Bruker D8 Advance using Cu Kα radiation. The laser wavelength for Raman test was 532 nm. The model of the x-ray photoelectron spectrometer (XPS) test equipment is Nexsa produced by Thermo Fisher Scientific. The thermogravimetric analysis (TGA) was applied under N2 flow at a heating rate of 5 °C min−1 from 50 °C to 800 °C. The tensile test of rGO/PANI film was performed by dynamic thermo-mechanical analyzer (DMA) TA Q800 under the tensile rate of 0.5 mm min−1 at room temperature.
2.6. Electrochemical measurements
For the electrochemical performances of the material prepared in this work, the measurement was carried out by CHI 760 electrochemical workstation from Shanghai CH Instrument Company. All the electronical performances here were measured at room temperature. The electrochemical experiments investigated here included cyclic voltammetry (CV), galvanostatic charge/discharge measurements (GCD), as well as electrochemical impedance spectroscopy (EIS), and all these tests applied with three-electrode system using 1 M H2SO4 solution as electrolyte. The potential window of these electrochemical tests was set up from −0.2 to 0.8 V, and the scan rates varied from 5 to 200 mV s−1. For EIS, the frequency measured here ranged from 105 to 10−2 Hz. The specific gravimetric capacitance (Cm , F g−1) was calculated from GCD curves by equation below:

And the specifical areal capacitance (Ca , mF cm−2) was calculated using the following equation:

The gravimetric energy density (Em , Wh kg−1) and power density (Pm, W kg−1) of the assembled rGO/PANI supercapacitors devices can be calculated by the equation below:


Whereas I (A) is the charge/discharge current, Δt (s) is the time of discharging, m (g) is the mass of active materials, S (cm2) is the area of electrode, ΔV (V) is the potential window (1 V in this work).
3. Results and discussion
In figure S1, the lateral dimension of GO nanosheets is about 1 to 5 μm. Figure 1 illustrates the fabrication procedure of rGO/PANI based electrodes. Dropped the PANI solution in NMP into a GO aqueous dispersion cautiously under stirring, allowing the self-assembly proceed entirely, plenty of flocculent GO/PANI is then yielded. Due to PANI's good solubility in NMP and its insoluble property in water, the mechanism that causes self-assembly between PANI and GO can be explained as PANI tend to absorb on GO nanosheets which is highly dispersed both in water and NMP.
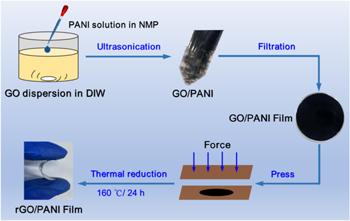
Figure 1. Schematic illustrations of the fabrication procedure of rGO/PANI based electrode.
Download figure:
Standard image High-resolution imageConfirmed by TEM image (figure 2(b)), the PANI particles with diameter of about 20 nm are loaded on GO nanosheets homogeneously. Given that the diameter of a single PANI molecule is calculated to be 12–55 nm [40], which is consistent with the size of PANI particles on GO nanosheets. Thus, it can be deduced that the majority of PANI particles here comprise one PANI chain and the distribution of these chains show a molecular-level uniformity. After employing ultrasonic dispersion and vacuum-assisted filtrating, a smooth and uniform GO/PANI film is easily fabricated.
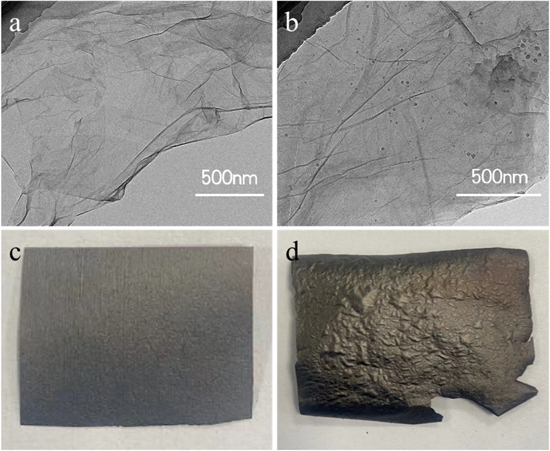
Figure 2. TEM images of (a) GO nanosheet and (b) GO/PANI. Digital photos of rGO/PANI reduced at 160 °C for 24 h with (c) or without (d) external force.
Download figure:
Standard image High-resolution imageThe PANI particles intercalating between the GO nanosheets can benefit bonding between these nanosheets and thereby enhance the strength of GO/PANI film through π–π stacking interaction. The film pressed by two flat ceramic plates is firstly dried at 60 °C and then treated with thermal reduction at 160 °C for 24 h to achieve the free-standing, flexible rGO/PANI film. Shown in figures 2(c) and (d), the external force exerted to the GO/PANI film during the thermal reduction decreased the roughness of the rGO/PANI film, leading to a uniformity stress distribution inside, which contributes to the flexibility, the similar result has been previously reported in the literature [25]. During the reduction process, anchored PANI particles suppress the dense packing between rGO sheets and contribute to the formation of a three-dimensional porous structure which facilitates electrolyte ion penetration for charge transfer. The as-prepared rGO/PANI film shows excellent flexibility and can bend at different angles. The content of PANI in rGO/PANI film is well-controlled by controlling the volume of PANI solution added to GO dispersion. When the volume of PANI solution added is 1 ml, 2.5 ml, 5 ml and 7.5 ml, the PANI content is 9.1%, 20%, 33.3% and 42.9%, respectively. As indicated by the cross-section SEM images (figure 3), all rGO/PANI films present uniform layered structure and seem denser with the increase of PANI content due to the increasing amount of PANI particles between rGO layers. So the film thickness increases from 4.08 to 74.07 μm when PANI content is increased. To get the balance between conductivity and pseudocapacitance of rGO based electrode material, an appropriate reduction of GO played a crucial role, since it determined the oxygen content. Thermal annealing treatment, which can yield large amounts of residual oxygen functional group without much environmental hazards, has been widely used [41]. Thus, a mild thermal reduction at 160 °C, which has reached a compromise between the conductivity and pseudocapacitance, is investigated in this report.

Figure 3. (a), (b) Cross-section SEM images of rGO. Cross-section SEM images of rGO/PANI with different PANI contents: (c), (d) 9.1%; (e), (f) 20%; (g), (h) 33.3%; (i), (j) 42.9%.
Download figure:
Standard image High-resolution imageThe percentage of O elemental composition in GO saw a decline compared with that in rGO determined by XPS in figure 4(a), indicating that a portion of oxygen-containing groups have been removed. Figure 4(c) and figure 4(d). show the C 1s XPS spectra of GO and rGO reduced at 160 °C for 24 h. From the spectrum, C 1s is deconvolved into three peaks at 284.8, 286.8, and 288.1 eV, which correspond to C=C, C–O–C and O=C–OH, respectively. After reduction, the intensity of peak C–O–C shows slightly weakened, indicating the incomplete removal of oxygen functional groups. The significantly increased intensity of C=C suggests that there's sp2 carbon transmitted from sp3 carbon. The sp2 and sp3 carbon sublattices in graphene form the honeycomb lattice, and the conjugated conductive network of graphene provided by sp2 carbon can be rebuild through the ring opening reaction of epoxides at a mild annealing temperature, leading to improved conductivity of rGO. Besides, the peak of O=C–OH still construct an important peak of C 1s of rGO, and the existence of O=C–OH located at defects' edge contribute to the pseudocapacitance in basic electrolytes [39]. From the XPS results of O 1s spectra for rGO in figure 4(e), the existence of quinone group and carbonyl group, which result in the pseudocapacitive Faradic redox reaction with acidic electrolytes, can be observed [42]. Figure 4(b) shows the XPS spectra of PANI and rGO/PANI-33.3%. It can be observed that both of PANI and rGO/PANI have an obvious peak of N, demonstrating the existent of PANI which contributes to the pseudocapacitance of the electrode material. As shown in figure 4(f), the spectrum of C 1s can be decomposed into peaks of 284.9, 286.0 and 286.9 eV, corresponding to C–C, C–N, and C–O [43]. N 1s spectrum of rGO/PANI in figure S3 can be deconvoluted into 3 peaks at 399.7 eV, 398.7 eV and 400.8 eV, corresponding to benzenoid amine, the quinoid amine, and nitrogen cationic radical (N+) [4, 43].
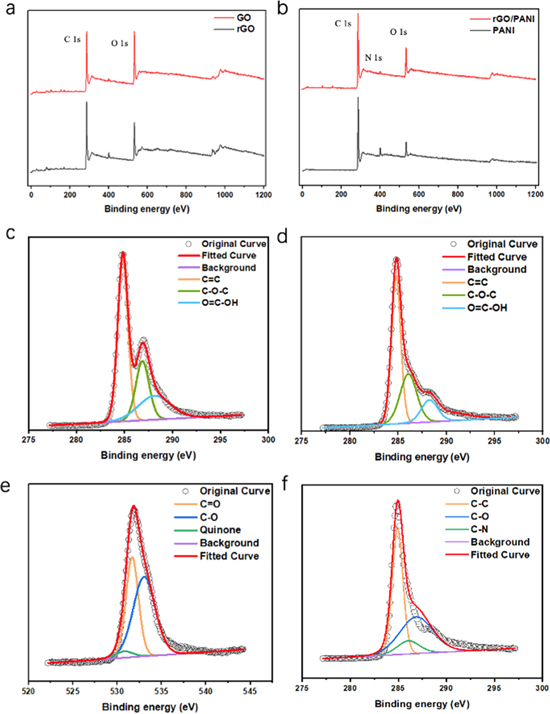
Figure 4. (a) XPS full spectra of GO and rGO. (b) XPS full spectra of PANI and rGO/PANI-33.3%. (c), (d) XPS C 1s peak of GO and rGO respectively. (e) XPS O 1s peak of rGO. (f) XPS C1s peak of rGO/PANI-33.3%.
Download figure:
Standard image High-resolution imageThe microstructure of carbon material can be shown by Raman measurement. Generally, there are two peaks in graphene Raman spectrum, D peak around 1340 cm−1 and G peak around 1575 cm−1, respectively. The theoretical Raman spectrum of a graphene single crystal shows no D peaks since there's no defect, impurity, or any disorder structure inside, thus the ratio of the intensity of D peak and G peak reflects the degree of disorder in graphene [44]. Since Raman is a powerful tool to determine the microstructure of graphene-based material, here PANI, GO, GO/PANI, as well as rGO/PANI are analysed with Raman spectrum. As shown in figure 5(a), the intensified ratio of D peak and G peak indicates that more defects have been introduced into the structure of rGO compared with GO. Additionally, the Raman characteristic peaks of PANI are also detected in GO/PANI and rGO/PANI.
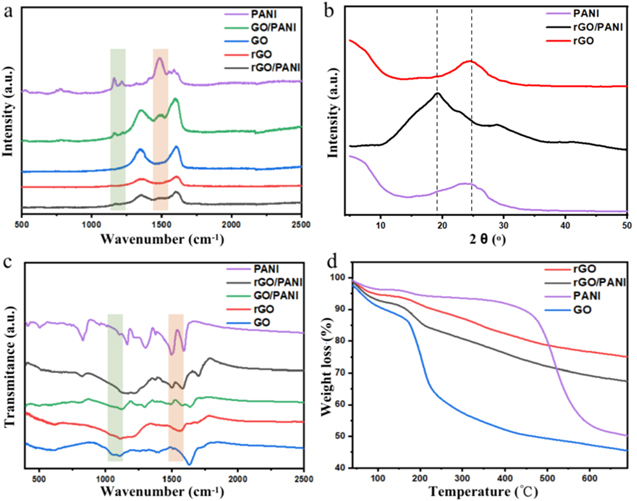
Figure 5. Structure characterization for PANI, GO, rGO, rGO/PANI and GO/PANI-33.3%: (a) Raman spectra; (b) XRD patterns; (c) FT-IR spectra; (d) TGA curves.
Download figure:
Standard image High-resolution imageXRD shows the crystal structure of PANI, as well as the composite of GO and PANI before and after reduction, as plotted in figure 5(b). It is clear that the XRD pattern of rGO/PANI compared with pure rGO, exhibits a slight shifting, and there's a bulge between 20° and 25° showing both characteristic peak of rGO and PANI, which suggests that the PANI particles exist on rGO sheets have the similar crystal structure as pure PANI. The XRD pattern of rGO/PANI indicates that GO has been already reduced successfully. According to Bragg's relation n λ = 2dsinθ, the d-spacing of the substance can be calculated. After reduction, the decreased d-spacing is related to the removal of oxygen-containing function groups, such as, hydroxyl, epoxy, as well as carbonyl groups. Meanwhile, sp2 network is reestablished during the reduction process due to the ring-opening reaction of the epoxides. The same information can also be concluded by FT-IR and TGA of GO and rGO. Figure 5(c) shows the FT-IR spectra of GO and rGO. Generally, the peaks at around 1620 cm−1, 1716 cm−1 and 1211 cm−1/1046 cm−1 are ascribed to the characteristic stretching vibration peak of C=C, O=C–OH, and C–O in C–O–C/C–O–H [45]. After reduction, these peaks of oxygen-containing function groups show noticeably weaker, again demonstrating that these functional groups are removed after thermal reduction. In figure 5(c) the FT-IR spectra of GO/PANI and rGO/PANI obviously exhibit the characteristic peaks of PANI at 1565 cm−1, 1486 cm−1, 1301 cm−1, 1243 cm−1, 1128 cm−1 and 802 cm−1, corresponding to the aromatic C=C stretching of the quinonoid ring, the aromatic C=C stretching of the benzenoid ring, the C–N stretching of the secondary aromatic amine, the C–N+ stretching, the =N+–H stretching, as well as the aromatic C–H out of plane deformation vibration, respectively [46, 47]. TGA curves show in figure 5(d) display the thermal stability of GO, rGO, PANI and rGO/PANI. The weight loss below 100 °C is caused by water deintercalation, and the major mass loss occurs at around 200 °C presumably due to the decomposition of labile oxygen-containing functional groups, including carboxylic group and ketone group [48], releasing CO, CO2 and H2O [49]. For GO, the significant weight loss around 100 °C indicates that GO absorbs more water than rGO. And from 100 °C to 300 °C, the dramatic loss weight of GO can be attributed to the abundant oxygen-containing function groups. While the weight loss of rGO distributed nearly evenly over the range of temperature is just 25%, indicating most of oxygen-containing groups have been successfully removed during the reduction process. Compared the TGA curve to that of the previous data [34], where the GO is reduced by hydrazine hydrate, the rGO in our work obtained in mild thermal condition has a larger weight loss. The weight loss contributes to the combination of the evaporation of water and removal of oxygen functional groups [50]. The larger weight loss of the rGO we produced suggests that the degree of reduction of the rGO treated by mild thermal method is lower than rGO reported previously [38], indicating an incomplete reduction of mild thermal condition. The existence of these oxygen functional groups has also been evidenced by other characterization methods as well. The TGA curve of PANI is composed of 3 steps, and each step correspond to the loss of specific substance [51]. The first period of weight loss occurs at around 50 °C to 130 °C due to the evaporation of the absorbed water molecules. For the second loss period from 130 °C to 220 °C, the weight loss of PANI here is no more than 3%. It may be attributed to the dopant molecules from the polymer structure, such as the release of HCl gas and some lower molecular weight oligomers [52]. The last mass loss step over 450 °C can be ascribed to the degradation of PANI [53].
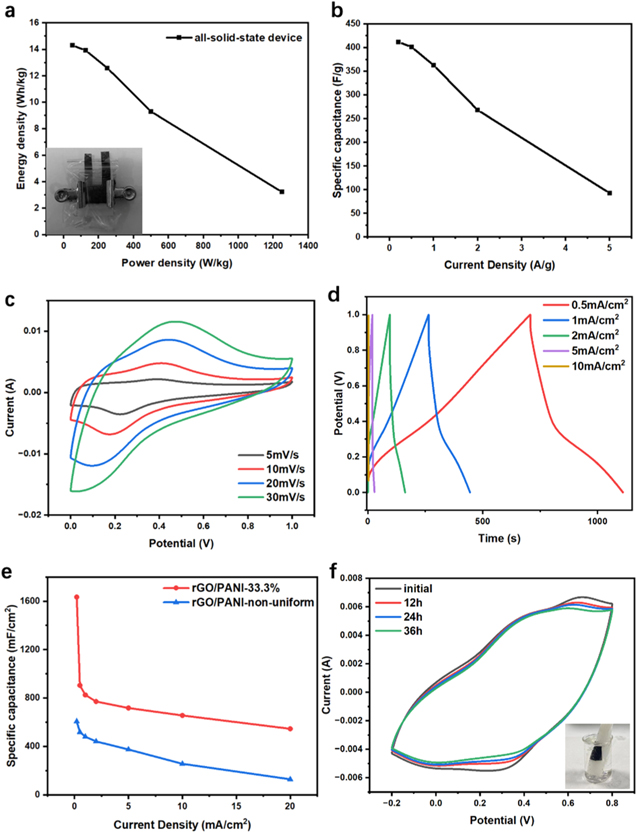
The electrochemical performance of the prepared electrode is test in a three-electrode system with 1 M H2SO4 as the electrolyte and the specific capacitance of the electrode is measured by GCD at different current densities. The rGO/PANI-33.3% based electrode exhibits an intensive improvement of the electrochemical performance from 183.8 F g−1 to 265.4 F g−1 in comparison with rGO electrode and the Ca increases from 729.4 mF cm−2 to 1634 mF cm−2, as shown in figures 6(a) and (b). Besides, the cyclic voltammogram (CV) results of rGO/PANI-33.3% electrode in figure 6(c) present two pairs of redox peaks, which means there is pseudocapacitance contributed in a great deal to the improved performance of electrode. In fact, the redox peaks of rGO/PANI here look broad because of the overlap of redox peaks from PANI as well as the rGO, which is incompletely reduced by a mild thermal treatment. From the CV curve of rGO in figure S4(a), a pair of small bumps can be observed, which may be attributed to the pseudocapacitance of oxygen functional groups remaining on rGO. For the oxygen function group of rGO, the acidic functional groups including carboxy and phenol, while the basic functional groups including quinone and carbonyl [54, 55]. In the acidic aqueous, there is a large amount of protons (H+) which react with the basic functional group of rGO and then lead to a pseudocapacitance. The CV curves of rGO/PANI not only show the redox peaks of rGO, but also the redox peaks of PANI. The redox peaks of PANI are caused by the redox of PANI molecules, which transformed from semiconducting state (leucoemeraldine) to conductive state (emeraldine) and then to its full oxidation state (pernigraniline) [56]. From the CV curves measured at increasing scan rate in figure S4, we can observe that, the scan rate is too high to proceed the Faradic reaction, so the redox peaks become non-obvious. With GCD curves, the specific capacitance of electrode at different current densities can be calculated according to the equation (1) mentioned above. Figure 6(e) displays the GCD curves of rGO/PANI-33.3%, there are two voltage stages in the ranges of 0.80 ∼ 0.50 V and 0.50 ∼ −0.20 V, respectively. The first stage of discharge is attributed to pure EDLC with a short discharge duration. While the second stage of discharge is ascribed to the combination of EDLC and faradic capacitance [57]. The cycling stability performance of rGO/PANI electrode presented in figure 6(g) is also measured by GCD technique under specific current density. The capacitance retention of rGO/PANI-33.3% tested under 5 mA cm−2 is about 76% after 10 500 GCD testing cycles, showing an excellent cycling stability. Over the ∼100th cycles, the specific capacitance of rGO/PANI electrode is being stabilized. On one hand, the enhanced capacitance can be attributed to the initial electrochemical process, where electrode is immersed in H2SO4 electrolyte facilitating the electrolyte ions enter into the electrode material. On the other, there's an obvious plateau appearing in the GCD curve inset between 0.4–0.6 V, which improves the specific capacitance of the rGO/PANI electrode. The plateau formed because of the degradation products of PANI, which shows a higher capacitance than pure PANI [58]. However after the following cycles, the decrease of specific capacitance of the rGO/PANI electrode due to the low conductivity of the degradation products [58]. This dropped conductivity of electrode material after cycling can also be detected by EIS measurement in figure 6(h). In figure 6(h), both Nyquist plots of the electrode presents a straight line in low frequency region, and in the high frequency region, both plots show the arc shape. According to the x-intercept of the Nyquist plots, the equivalent series resistance of rGO/PANI electrode increase obviously after cycling. Meanwhile, it can be indicated, from the smaller diameter of the arc and the shorter length of the 45° part of the plots shown, that the rGO/PANI before cycling has a smaller electronic resistance and shorter ion diffusion path [59]. What the EIS measurement demonstrated is consistent with the impact of degradation product of PANI. More GCD curves of rGO/PANI with different PANI contents at various current density measured here, can be seen in figure S5. The degradation product of PANI has higher capacitance but lower conductivity [58], the matrix of rGO offers its degradation products an effective conduction path, which makes the improvement of the performance of rGO/PANI possible. Besides, there's an apparent regularity between the Ca and the PANI content attached on GO nanosheet or beyond GO sheet. With the increase of PANI content, the Ca of rGO/PANI electrode at a current density of 0.2 mA cm−2 increase first and then decreased. The Ca first increase rapidly from 729.4 to 1634 mF cm−2 and then slowly increase from 1634 to 1826 mF cm−2. When the content of PANI reaches 50%, the Ca drops to 1600 mF cm−2 , and the Ca of rGO/PANI-60% reaches just 1694 mF cm−2, showing an unobvious increase as more PANI is added, and it decreases more significantly than the other composite after the current density exceeding 0.2 mA cm−2, as displayed in figure 6(d). Figure 6(f) shows the Nyquist plots for rGO/PANI derived by the experimental data from EIS, and the inset shows the equivalent circuit model. Figure S6 verifies the effective fitting of impedance by the equivalent circuit, although approximately. The EIS data are fitted by equivalent series resistance (Rs), charge transfer resistance (Rct), Warburg impendence (W1), as well as constant phase element (CPE1). The axis intercept in Nyquist plot reflects the Rs of the electrode, which is the resistance of ionic from the electrolyte, the substrate's intrinsic resistance, as well as the contact resistance existing between the interface of active material and current collector. According to the Nyquist plot, the Rs of rGO electrode is around 2.40 Ω and the values arrive at around 3 Ω for rGO/PANI-9.1%. The Rs value of rGO/PANI-50% sees an apparently increase which up to 5.12 Ω, indicating the bigger intrinsic resistance and contact resistance. The diameter of the semicircle in Nyquist plots related to the Rct. The Rct values of rGO, rGO/PANI-9.1%, rGO/PANI-20%, rGO/PANI-33.3%, rGO/PANI-42.9%, rGO/PANI-50% and rGO/PANI-60% are 9.45, 8.03, 1.85, 1.12, 4.57, 3.85 and 9.12 Ω, respectively, demonstrating that a small quantity of PANI can benefit the charge transfer performance in electrode. The right amount of PANI did play an important role in optimizing the charge transfer performance of the rGO/PANI based electrode. Generally, the graphene sheets tend to get aggregated, which hinders the ion penetration. While the anchored PANI nanoparticles inhibit aggregation of graphene sheets and help form a 3D open structure which facilitates electrolyte ion penetration for fast electron transfer. While as the data shown above, the excessive PANI hinders the charge transfer to some extent. The data above proves that the conductivity of rGO/PANI electrode can be improved by regulating the amount of PANI.

Figure 6. The electrochemical performances of rGO/PANI and rGO under three-electrode system with aqueous electrolyte: (a) Calculated Cm of rGO and rGO/PANI-33.3%; (b) Calculated Ca of rGO and rGO/PANI-33.3%; (c) CV curves of rGO/PANI-33.3% at scan rates ranging from 5 to 50 mV s−1; (d) Calculated Ca of rGO/PANI with different PANI contents; (e) GCD curves of rGO/PANI-33.3% at various current densities; (f) Comparison of the Nyquist plots of rGO/PANI with different PANI contents, the inset displays equivalent circuit model; (g) cycling stability of rGO/PANI-33.3% (inset shows the GCD curve of initial cycles and GCD curve after 10 500 cycles); (h) Comparison of the Nyquist plots of rGO/PANI-33.3% before and after cycling.
Download figure:
Standard image High-resolution imageFirstly, most PANI particles attached on rGO sheet, and few existed beyond the rGO sheet independently, which offers sufficient unblocked channel for electrolyte. The ion diffused rapidly into the active material and the pseudocapacitance provided by PANI contribute to the rise of capacitance, thus the more PANI particles there are, the higher capacitance the composite has. But there is a limitation of the amount of PANI particle due to the excessive PANI incapacitate the rGO network as an efficient conductor and the massive PANI which existed beyond GO is also an obstacle to the diffusion channels. The distribution of different amounts of PANI can be observed obviously by SEM in figure S2. When the content of PANI is far below the limitation, the majority of PANI particles attach on rGO sheets uniformly, as shown in figures S2(a) and S2(b). When PANI is excessive, the PANI particles locate on the rGO sheets as well as beyond the rGO sheets independently. To supply the important of the distribution of PANI particles on rGO sheets, we perform a controlled experiment using the rGO/PANI-33.3% without the self-assembly method. The nonuniform distribution of PANI particles on GO sheet can be observed in SEM image in figure S8(a). PANI particles stack on the GO sheet and some even agglomeration together. The electrochemistry performance of that film shown in figure 7(e) is not as good as the uniform rGO/PANI we tested. The Ca of the nonuniform rGO/PANI-33.3% at 0.2 mA cm−2 is just 607.6 mF cm−2, which is less than the Ca of uniform rGO/PANI-33.3% electrode, and the Ca calculated at other current densities all show obvious disadvantage. The CV curves and GCD curves of that nonuniform film are shown in figures S8(d) and S8(c). Besides, the fitted Nyquist plot of that nonuniform rGO/PANI-33.3% is displayed in figure S8(b). The Rs value of uniform one is 3.21 Ω while the nonuniform one is 4.97 Ω, indicating the bigger intrinsic resistance and contact resistance. And the Rct values of the uniform rGO/PANI-33.3% is 1.12 Ω, and for the nonuniform one, Rct reaches 4.53 Ω, demonstrating that the uniform distribution of PANI can benefit the charge transfer performance in electrode. Overall, a uniform distribution of PANI particles attributed to an appropriate amount of PANI and appropriate preparation play a crucial role in its high areal capacitance.
Figure 7. (a) Ragone plot of the as-prepared all-solid-state device, the inset is the digital image of the device; (b) Calculated Cm of the device; (c) CV curves of the device; (d) GCD curves of the device; (e) Comparison of specific capacitance of the rGO/PANI-33.3% prepared via self-assembly and not; (f) CV curves of the electrode at 20 mV s−1 after bending for 12 h, 24 h and 36 h, the inset is the way the electrode is bended and sinks in H2SO4 electrolyte.
Download figure:
Standard image High-resolution image
Finally, the feasibility of rGO/PANI-33.3% for all-solid-state device and long-term flexibility of the electrode are investigated. The symmetric supercapacitor is assembled using 2 pieces of rGO/PANI-33.3% electrodes and carbon paper is used as current collector which provided negligible capacitance [60]. The Cm of the devices is plotted in figure 7(b), which can be calculated from GCD curves in figure 7(d). The device shows a high Cm with 412 F g−1 at 0.2 A g−1. The CV curves of the as-prepared devices are displayed in figure 7(c). Moreover, figure 7(a) presents the Ragone plot of the device's energy and power densities. The device possesses an energy density of 14.3 Wh kg−1 at a power density of 50 W kg−1, and still remains 9.3 Wh kg−1 at a power density of 500 W kg−1. For the flexibility of the electrodes, the stress-strain curve of rGO/PANI-33.3% film is provided in figure S9. The tensile strength of the composite film is 27.2 MPa, with elongation at break of 2.67%, which means the length of that film at the time of break increases by 2.67% compared with the initial sample. The mechanical flexibility of the film can be attribute to the proprieties of rGO,and PANI do not show obvious negative influence for the mechanical flexibility of the film, according to the reported stress-strain curve of GO and rGO material [61, 62]. Besides, the CV curves of rGO/PANI electrode after bending for 12 h, 24 h and 36 h are plotted in figure 7(f). The area of CV curves at 20 mV s−1 show slightly decrease after long-term bending and the CV retains its rectangular shape, indicating the potential of rGO/PANI electrode used in flexible supercapacitors and wearable electronics.
4. Conclusion
We have reported the impact of the uniformity distribution of PANI in rGO/PANI composite on its electrochemical performance. The molecular-level uniform rGO/PANI composite film displays great potential as the electrode for supercapacitors. Mild thermal reduction method has been carefully studied to balance the conductivity and pseudocapacitance of the rGO/PANI composite. The electrode of rGO/PANI-42.9% exhibited a high specific areal capacitance (1826 mF cm−2 at 0.2 mA cm−2). Besides, the specific gravimetric capacitance of rGO/PANI-33.3% reaches up to 256.4 F g−1 at 0.2 A g−1, showing greatly enhanced performance compared with the pure rGO electrode which delivers a specific capacitance of 183 F g−1. The fabrication method and the thermal reduction in this paper are also convenient and environmentally friendly. This work elucidates the significance of the uniform distribution of PANI in boosting the capacitive performance of rGO/PANI based electrode, and paves the way to design high-performance capacitive energy storage materials.
Acknowledgments
The financial supports from the National Natural Science Foundation of China (No. 62171275 and 61974089). We also acknowledge analysis supports from the Instrumental Analysis Center of Shanghai Jiao Tong University and the Center for Advanced Electronic Materials and Devices of Shanghai Jiao Tong University.
Data availability statement
All data that support the findings of this study are included within the article (and any supplementary files).
Supplementary data (3.2 MB DOCX)