

Abstract
The surface-supported silver nanoparticles have been studied and applied in various applications. Many unique nanostructures have been introduced into this field to improve the functionalities of the surfaces depending on application purposes. We created featured silver nano-array surfaces by utilizing the solvent-mediated phase transition on the surface grafted with poly (acrylic) acids polymer chains and taking advantage of the low temperature of argon gas discharged plasma as a reducing agent. The applied solvents and grafted polymer chain densities affected the phase transition and thus determined the outcome of surface nano-array patterns. However, the total loaded silver ions on the surface affected silver nano-array structures at the sub-micron levels. The featured silver patterned surfaces made in the optimal conditions present a favorable surface-enhanced Raman spectroscopy enhancement as well as recyclability for detection re-usage. This novel method prepares tunable silver nanopatterned surfaces and provides a new approach to various potential applications.
Export citation and abstract BibTeX RIS
1. Introduction
The surface-supported silver element is known as a great candidate for various applications due to its properties such as antimicrobial functions and sensing [1–3]. With nanotechnology thriving, the silver element brings more novel applications due to its unique properties when the size decreases to the nanoscale. At the nanoscale, a higher fraction of nanosized metal atoms is exposed at the surface, where they are accessible to reactant molecules and available for reactions [4]. Surface-supported silver is conventionally prepared by impregnating either a porous or nonporous supporting material with a solution of silver salts, followed by hydrogen reduction at elevated temperatures. The resulting silver particles are usually distributed heterogeneously with a broad size range due to the particle aggregation at elevated temperatures [5]. Many approaches have been developed to control the size distribution of silver particles, for example, chemical reduction at ambient temperatures; silver nanoparticles premade through the colloidal solution, then being immobilized on pretreated surfaces; or even methods such as ion exchange and photodeposition [6–10].
All the above methods are designed to synthesize silver nanoparticles, nanotubes, or nanowires and then immobilize the nano-silver on surfaces due to their relatively easy control of the uniformity and distribution of the particle coating pattern. Researchers are also exploring new silver surface patterns, such as flower shapes [11], urchin-like nanowires [12], and more unique patterns [13], to increase the sensitivity of the surface response for sensing applications. Most of the techniques require several steps of complex treatment or involve other metal components to tune the surface patterns. In the meantime, among all the effective silver patterns, only a few research groups mention the recyclability for substrate reuse [14, 15].
This study reported a method to construct a silver nano-array structure on a silicon wafer surface enabled by phase separation and hydrogen species-free in situ reduction with argon gas plasma. The resulting surfaces with the featured pattern presented good surface-enhanced Raman spectroscopy (SERS) enhancement and recyclability for detection reuses. We followed the strategy of surface patterning on polymer grafted surfaces in the previous study [16]. Inspired by the metal-organic framework concept [17], we built a novel method to construct a silver nano-array on the silicon surface based on the organic framework. Such a goal requires polyacrylic acid (PAA) polymer chains grafting to load and control silver ion distribution on surfaces, phase separation to control the surface pre-patterning, and in situ reduction of Ag+ to Ag through argon gas discharged plasma (GDP) [18, 19] (figure 1).
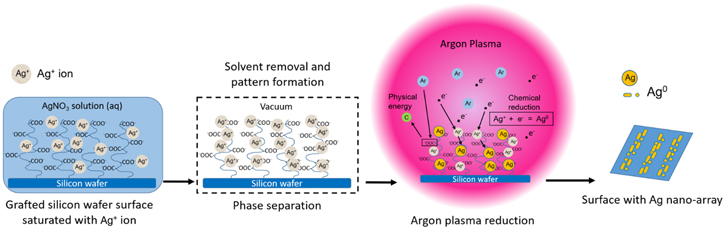
Figure 1. Schematic illustration of silver nano-array method. Briefly, the silver ion saturated poly (acrylic acid) (PAA) grafted silicon wafer surface undergoes the phase separation step, followed by the in situ reduction with argon gas plasma, then formed the nano-array patterned surface.
Download figure:
Standard image High-resolution image2. Experimental details
2.1. Chemicals and materials
All chemicals, such as acrylic acid (anhydrous, contains 200 ppm MEHQ as an inhibitor, 99%), rhodamine 6G (R6G), and silver nitrate are all purchased from Sigma Aldrich. All solvents, such as ethanol and deionized water (DI water); and supply gas are supplied by Stevens Institute of Technology.
2.2. PAA grafting sample preparation
PAA grafted silicon wafers (1 × 1 cm2) were prepared based on the plasma-initiated surface polymerization method established in our previous studies [20]. Briefly, clean silicon wafers were treated with discharged argon plasma for three minutes at the power of 80 watts in the pressure of 28–31 pascal (210–230 mTorr). After exposure to air for 75 min, the graft polymerization was carried out in a 30% (v/v) acrylic acid aqueous solution at 70 °C under a vacuum atmosphere of −88 kPa (−26 inHg) for 18 h. Grafted samples were washed thoroughly with DI water. The grafted PAA polymer chains were examined by attenuated total reflection-Fourier-transform infrared spectroscopy (ATR-FTIR) with a quartz tungsten halogen lamp light source. PAA grafting quantity and homogeneity were tested using toluidine blue O dye and surface water contact angle. For the toluidine blue O dyeing process, grafted PAA on silicon wafers bound with the dye molecule for 6 h staining at 60 °C. The dyed surfaces were gently rinsed with DI water to remove the free dye molecule. The dye molecule was then dissolved in 1 ml 35% of acetic acid solution. The optical density of dye dissolved solution was measured at the wavelength of 633 nm.
2.3. Phase separation and in situ plasma reduction of silver ion
After the grafting process, the grafted surfaces were submerged in silver nitrate aqueous solution (pH = 3.4) for 2 h with a 5 mg ml−1 concentration. When the ion exchange equilibrium was established, the surfaces were carefully taken out and placed in the Pyrex inner chamber (5 cm away from the gas outlet) of the Plasma Prep III device while the samples were still wet. Within 10–15 min, the system pressure was vacuumed from 760 Torr to 210–230 Torr, with the pressure being dropped 1–2 Torr per minute gradually and steadily. The phase separation occurred during the vacuum procedure, and the solvent was retracted from the surface, which is a dewetting phenomenon. The in situ reduction was then conducted with the argon plasma at 80 watts for 5 min. The obtained samples were characterized through scanning electron microscopy (SEM) and energy-dispersive x-ray spectroscopy (EDX) with a Zeiss brand Auriga Small Dual-Beam FIB-SEM. The water contact angle was also measured. Each condition of silver nanoarray formation was repeated at least three times, and the samples were examined with SEM.
2.4. Surfaces selection for SERS acquisition
In order to find a perfect surface for SERS applications, the surface was prepared under different experimental conditions with three variables: different applied solvent (ethanol, ethanol and water 1:1, and water); grafting density (10%–30% (v/v)); and silver nitrate concentrations (0.5 mg ml−1, 2 mg ml−1, 5 mg ml−1 and 10 mg ml−1). All samples were tested with the SERS effect on testing the R6G compound in an aqueous solution. After each acquisition, the sample surface was gently rinsed with deionized water and soaked in 2 M NaCl solution for two minutes. Then, the surface was rinsed with DI water again and dried with nitrogen gas. Before the next acquisition, at least three random points were tested to confirm that the background was clear. The Raman spectra were measured with a custom-built setup. A 632.8 nm laser beam was used as excitation wavelength with 8 mW laser intensity. The testing samples were placed on a stage. Spectrum acquisition was captured by a fiber-coupled spectrometer with a CCD detector cooled with liquid nitrogen. All Raman measurements were performed using ten integral exposures × exposure time of 2 s (total acquisition time 20 s).
3. Results and discussion
3.1. PAA grafting on silicon wafer surface
Successful polymer grafting was quantified through the toluidine blue O dyeing method due to the specific binding of the carboxylate group with toluidine blue O dye molecules and characterized with water contact angle and attenuated total reflectance-Fourier-transform infrared spectroscopy (ATR-FTIR) analysis. In figure 2(a), UV–vis absorption measurements of the dye dissolved solution at the wavelength of 633 nm confirmed the grafted PAA polymer chains present and the estimation of grafting density. The grafting density was determined mainly by the monomer concentration. Also, the water contact angle comparison (figure 2(b)) proved the surface property changed from hydrophobic to hydrophilic after the addition of -COOH groups and presented a good grafting distribution due to the symmetry of water droplet spreading. Compared to the grafting density on the polyethylene terephthalate (PET) surfaces [16], the silicon wafer resulted in a relatively lower grafting density because the silicon wafer surface provides less oxygen cites that can be activated to graft the PAA polymers than the PET surface [20]. However, the grafting density still guaranteed the availability of receptors of silver ion for future silver nanostructures construction.

Figure 2. (a) Estimation of surface grafted poly (acrylic acid) (PAA) density using dye toluidine blue O. Optical density (OD) measurement of dye dissolved solution at the wavelength of 633 nm. (b) Water contact angle test of surfaces at different steps, plain silicon wafer as control (mean = 58.65°), PAA grafted silicon wafer surface (mean = 19.67°), and silver nano-array surface (mean = 32.54°). (c) ATR-FTIR spectrum of the plain silicon wafer and PAA grafted silicon wafer confirm a successful PAA grafting on the silicon surfaces. Before the ATR-FTIR measurement, free PAA was removed by rinsing the grafted surface with DI water.
Download figure:
Standard image High-resolution imageIn addition, the PAA grafted surface was also confirmed by ATR-FTIR analysis (figure 2(c)). Compared the feature peaks with the plain silicon wafer, we confirmed the presence of PAA brushes on the surface. The strong peak at 1704 cm−1 was assigned to the C=O stretch of dimer in the solid state; peaks at 1447 and 1409 cm−1 were due to C–H bending in the methylene group; and the peak at 1164 cm−1 was from C–O stretches.
3.2. Phase separation enabled morphology formation
After the grafting surface was made, the next step was to create the nano surface morphology. In our study, phase separation and argon plasma reduction happened in one step. However, we should discuss the process separately because phase separation plays a significant role in surface morphology formation. The phase separation happened in a sealed quartz chamber in the plasma machine, with a robust continuous decompression by an oil pump. The pressure dropped very fast in the sealed system. During the process, the solvent quickly boiled due to the boiling point decrease, then the fast-boiling process drew a significant amount of energy from the solvent itself. Based on the solvent property, water, for example (diagram 1), the remaining water will freeze to a solid state with a continuous pumping of the vapor out. The process happened very quickly in the first 5–7 s after the pumping started. We could hardly monitor the boiling process; the water on the surface froze to solid, then the solvent was extracted through sublimation, thus fixing the grafted polymer chains and settling the morphology for the later nano silver reduction. Due to the different physical properties of the different solvents, we observed different phase separation behavior other than freezing, thus resulting in various surface morphologies for the silver nanostructures.
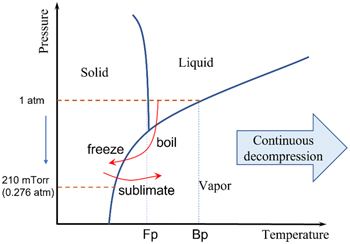
Diagram 1. Demonstration of phase changes during the phase separation process.
Download figure:
Standard image High-resolution image3.3. Low temperature argon plasma reduced silver nanostructured surfaces
It was proved that argon GDP could reduce positive charged metal ion into its base state [21]. In our study, after the phase separation process, the plasma machine was ready for the ion reduction when the proper system pressure was achieved at 210–230 Torr. The PAA polymer brushes were arranged into a specific pattern during the de-wetting process along with the silver ions. Once the silver ions arrangements were fixed, the in situ reduction was completed through the argon plasma. The silver nanostructure pattern was revealed following the structural patterns created by the PAA polymer brushes arrangement in the phase separation process. The water contact angle data indicated the surface property changed from hydrophilic to hydrophobic again depending on how dense the silver coating was on the surface (figure 2(b)). In the SEM images of figure 3(a), a unique silver nano-array pattern was created on the silicon wafer surface using our method. In this morphology, silver presented a combination of nanoparticles or merged oriented silver lines due to the PAA polymer pattern arranged and fixed during the phase separation step. The silver element was confirmed in the EDX spectrum.
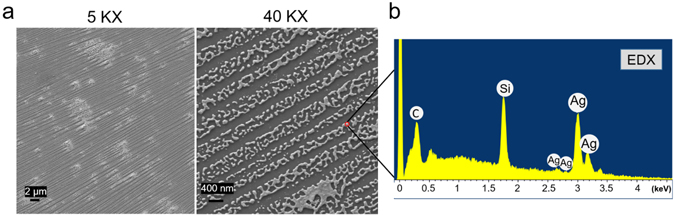
Figure 3. (a) SEM images of in situ silver nano-array surface with a zoomed out 5 KX (scale bar = 2 um) of magnification and a zoomed-in 40 KX (scale bar = 400 nm) of magnification. (b) EDX spectrum of silver nano-arrays was included (conducted in 5 kV).
Download figure:
Standard image High-resolution imageIn the in situ reduction process, the reduction did not depend on the highly reactive hydrogen species, which might damage the surface morphology; instead, the inert gas argon worked as well as hydrogen but was associated with minimal impact on the material surface [22–24]. Thus, the plasma-mediated reducing process was set to a 5 min plasma treatment to guarantee the reduction of Ag+ to Ag° and to preserve the surface nanostructures. The polymer chains that hold the silver ion were interfused into the nano-silver during the plasma reduction process; other polymer chains were removed by the power of discharged argon plasma. The plasma's low temperature hardly impacted the reduced metal structures but decomposed the 'weaker' polymer chains. As a result, a clean silver nanostructured surface was created under the reported condition. The carbon peak in the EDX spectrum and Raman spectrum control (in the following section) proved this hypothesis. We validated our method through the above experiments. Moreover, further studies were conducted on surface patterns by modifying three crucial experimental conditions: applied solvent in phase separation state, grafted polymer density, and the silver ion concentration.
3.4. Thermal dynamic between the solvent, polymer under vacuum
We use ethanol and water as the polymer-solvent in our experiment system. Due to the polarity, the PAA polymer chains can form a uniform and equilibrium state with the solvent. Although the physical properties between ethanol and water have a big difference, they are miscible in any ratio. Based on the Flory–Huggins thermodynamics [25], the liquid–liquid demixing process can form complex polymer crosslinking that incorporate both enthalpy and entropy contribution. The phase separation step accelerates this process with the faster removal of the solvent molecules, and the polymer chains were rapidly crosslinked by nucleation and the increase of the polymer concentration [26]. Thus, we assumed that the higher grafted polymer concentration, the more complex polymer crosslinking was expected. The result in this paper also proved this hypothesis. The increasing polymer grafting density homogenizes the nano-silver and generates more complex surface morphologies. Moreover, we also observed that the ethanol-water system created uncontrollable complexity, which resulted in a more diverse surface pattern outcome. We decided to use the more controllable condition for silver nanoarray fabrication at the current stage.
3.5. Solvent factor
We chose the 30% grafting density due to the better chances of PAA polymer brushes interaction that contributed to the feature pattern-based our previous study [16]. The factor we investigated was the applied phase separation solvent. In our previous study, solvent played a critical part in pattern formations through phase separation on grafted surfaces. PAA polymer brushes' interaction behaviors differed in solvents with different polarities [16], which inspired us to hypothesize that the surface pattern formation might be affected even with the capture of silver ions on the polymer brushes. Therefore, based on the silver nitrate solubility in the different solvents, experiments were conducted with selected phase separation solvents of ethanol, water, and a mixed solvent system of ethanol to water in a 1:1 ratio. The resulting surface morphologies are shown in the SEM images in figure 4.

Figure 4. Demonstration and the SEM images of surfaces prepared with different solvents, ethanol, ethanol mixed with water (1:1), and water. All other conditions remained the same, with the 30% PAA grafted silicon wafer surfaces and with 5 mg ml−1 silver nitrate concentration, please refer to figure 4 for zoomed in images.
Download figure:
Standard image High-resolution imageWe observed uneven silver coating and heavy aggregation on the surfaces of the samples prepared with just ethanol. We believe that the result was the combined effect of solvent freezing point, wettability, and solute solubility. Due to the low freezing point of the ethanol, in the phase separation process, ethanol tended to vaporize with decreasing pressure instead of being frozen. Also, ethanol is an excellent wetting solvent; it tends to spread to cover the sample surface with maximum area. As a result, in the pure ethanol sample, the loaded polymer brushes tended to smear and be fixed on the surface along with the ethanol extraction. While in the case of coexistence with water, ethanol was extracted faster than water. The polymer brushes were driven into the remaining water component that condensed the silver ions and formed the uneven and aggregated surface silver coating. In the meantime, the silver nitrate has different solubilities between water (2560 mg ml−1 at 25 °C) and ethanol (39.50 mg ml−1 at 25 °C). With the mixed solvent system, the considerable solubility difference might also cause undistributed silver ion deposits, which resulted in uncontrollable silver morphology. However, the simple solvent underwent the freezing process under high vacuum conditions when only water was applied. The polymer brushes improved the water's wetting property on the PAA grafted silicon wafers, thus helping form a manipulated polymer pattern in the phase separation. The surface presented the silver nano-array pattern after the in situ reduction by argon plasma. These results proved that applying a solvent affected the forming pattern and suggested that water was a better phase separation solvent for achieving regular and repeatable patterns.
3.6. Grafting density factor
Among the three conditions, grafted polymer density was also an essential factor to be discussed. This factor determined the total silver cation quantity loaded on the surface and the polymer brush length, which in turn affected the interactions between polymer chains in the phase separation process. Both parameters directly determine the formation of surface patterns. Therefore, the experiment was conducted with different PAA grafted densities, 10%, 20%, and 30%. Other variables were fixed: a. the silver ion concentration was set at 5 mg ml−1 (0.03 M) on the surfaces; b. water was used as phase separation solvent; c. plasma treatment time was fixed at 5 min. Results are shown in figure 5.

Figure 5. Demonstration and SEM images of surfaces prepared with different PAA grafting densities from 10% to 30%. All other conditions remained the same, with 5 mg ml−1 silver nitrate concentration and water as the solvent.
Download figure:
Standard image High-resolution imageAs shown in the SEM images in figure 5, we observed three different typical patterns by changing grafting density conditions. The difference of silver ions captured on the surface resulted in the different nano-silver pattern formation during the phase separation enabled reductions. The higher concentration of monomers contributed to higher grafting density and longer polymer chains, giving the individual polymer brush better chances to interact with each other, along with the silver ions that were captured. As a result, the metal-organic interaction led to the novel surface pattern through in situ reduction. However, the low grafted density reduced the silver ion capture and limited the interaction access, which generated the individual or aggregated nanoparticles formation instead of new patterns.
3.7. Silver ion concentration factor
Another important factor in the surface pattern formation was the silver ion concentrations. Silver ion is the brick to the complex structure construction. We varied the silver concentration from 0.5 mg ml−1 (0.003 M) to 10 mg ml−1 (0.06 M). Other variables were fixed with 30% grafting density and water as the phase separation solvent for the regularity of the surface patterns. The featured results are shown in figure 6.
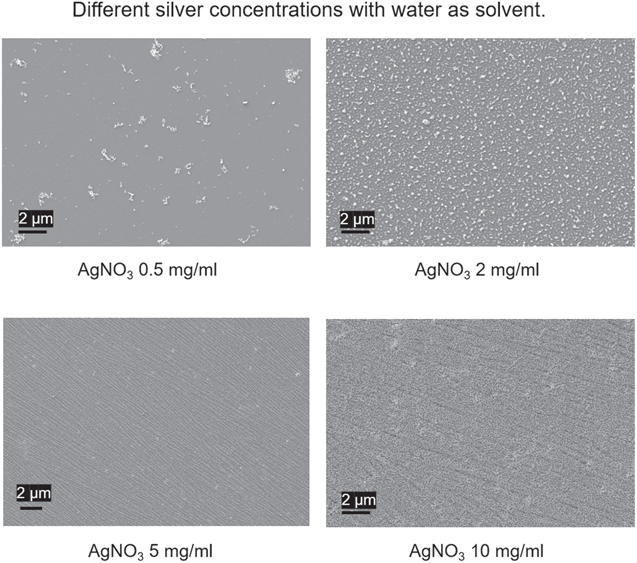
Figure 6. SEM images of surfaces prepared with different silver concentrations, 0.5 mg ml−1, 2 mg ml−1, 5 mg ml−1, and 10 mg ml−1. All other conditions remained the same: 30% PAA grafting density, water as the phase separation solvent, and a plasma treatment time of 5 min at 80 watts power.
Download figure:
Standard image High-resolution imageAs predicted, different patterns were revealed in the SEM images with the increasing concentration of the silver ions. After the phase separation and in situ reduction, low concentration (0.5 mg ml−1) silver ions could not form complex patterns until enough silver could be used to construct the featured patterns. At 2 mg ml−1, silver nanoparticles with a certain degree of aggregation appeared on the surfaces. However, the silver captured on the surface could not construct a more complex pattern due to the lack of building components. When the concentration was increased to 5 mg ml−1, the silver nano-array was constructed due to the enrichment of silver metal components, which revealed the polymer brushes' pattern on the surfaces. In the case of even higher silver concentration, the previous clear pattern (table 1) was buried under the excess silver component, which started to disorderly distribute with even more complicated structures built up on top of the silicon wafer surfaces.
Table 1. Summary of current patterns created.
| 5 mg ml−1 Ag+ | Ethanol | Ethanol: H2O (1:1) | H2O |
|---|---|---|---|
| 10% PAA grafting | Uneven and Heavily aggregation | Uneven Silver Cluster | Uneven Silver Cluster |
| 20% PAA grafting | Uneven and Heavily aggregation | Uneven Silver Cluster | Silver NPs with mild aggregation |
| 30% PAA grafting | Uneven and Heavily aggregation | Uneven Silver Cluster | Silver Nano Array |
3.8. SERS application on the reusable surfaces
SERS [27] has been used in the analysis of trace chemicals or the identification of biological samples [28, 29]. In this project, silicon wafer was selected due to its stability and a featured peak at 520 cm−1 under the Raman spectrum. It provided a clean background for compound peaks detection in sensing applications. Silver nanoparticles are beneficial for organic molecules to interact with the localized metal surface plasmons. Thus, we conducted the SERS application on our silver nano-array coated surfaces to find a good detection candidate. Since SERS enhancement depends heavily on the 'hot spots' [30], we selected surfaces with relatively dense silver coating samples, which provided necessary hot spots. The Raman spectra acquisition was performed with an analyte concentration, R6G, at 1 × 10⁻⁶ M.
The SERS enhancement results shown in figure 7 provided us with guidance in building surfaces with good SERS responses. Based on the electron energy loss spectroscopy studies [31–34], the silver nano-array surfaces morphology revealed that the space between the silver nanostructures absorbed more analytes to show the most enhanced SERS signals. The resulting surfaces present a different signal enhancement level with the different preparation conditions applied. Thus, our best candidate was selected to be the 5 mg ml−1 silver nitrate with 30% grafting density and water as phase separation solvent due to its featured silver nano-array pattern. The higher concentration (10 mg ml)−1 of silver nitrate formed more complex structural patterns that were supposed to provide more hot spots. However, the lower SERS enhancement indicated that the excess silver fused in the array structure filled in gaps between the 'hot spots' during the reduction process, causing the loss of SERS response [30]. Thus, our further SERS application mainly focused on the sample prepared through the most optimized conditions, 30% grafting density, 5 mg ml−1 silver concentration, and water as the phase separation solvent.
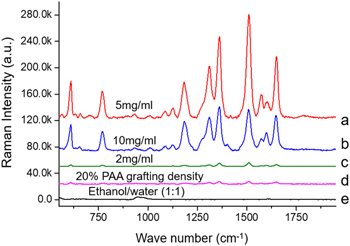
Figure 7. Raman spectra of SERS enhancement effect of sample surfaces with R6G as analyte at a concentration of 1 × 10⁻⁶ M. (a), (b), (c) were all surfaces with 30% grafting density, with water as phase separation solvent, and silver nitrate concentration of 5 mg ml−1 (a), 10 mg ml−1 (b), and 2 mg ml−1 (c). (d) was a surface with 20% PAA grafting density, water as phase separation solvent, and a 5 mg ml−1 silver nitrate concentration. (e) was a surface with 30% PAA grafting density, water: ethanol (1:1) as phase separation solvent, and a silver nitrate concentration of 5 mg ml−1.
Download figure:
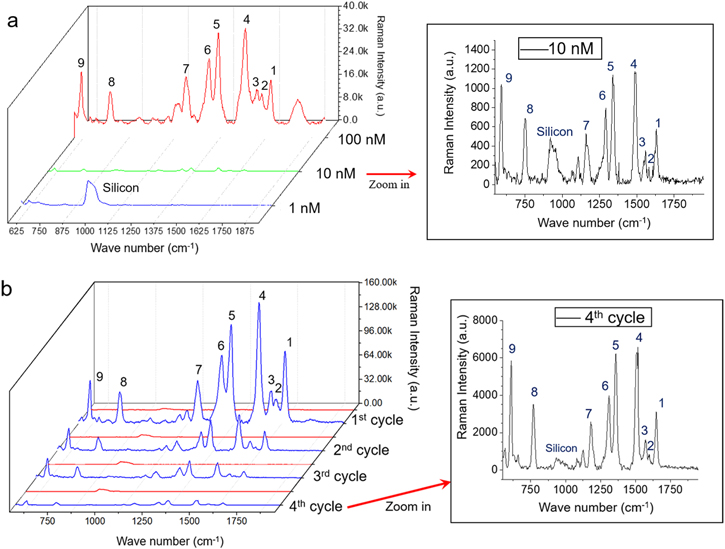
Standard image High-resolution imageFurther experiments were conducted to find the limit of detection on the silver nano-array surface with lower concentrations of R6G analyte. In figure 8(a), we were able to observe almost all characteristic peaks [35, 36] of R6G at 1651(peak 1), 1603(peak 2), 1572(peak 3), 1510(peak 4), 1363(peak 5), 1312(peak 6), 1184(peak 7), 771(peak 8), and 611(peak 9) cm−1 even at very low (10 nM) concentration. The signal at 1572 cm−1 (twisting vibration mode of phenyl group) was more intensified than that of 1603 cm−1 (the vibration mode vertical to the xanthene ring) at all tested R6G concentrations, indicating that R6G molecules adsorbed on the surface were rather flatly oriented toward the metal surfaces [37].
Figure 8. (a) SERS spectrum of in situ argon plasma reduced silver nano-array structured surface with different concentrations of R6G from 100 to 1 nM. Zoomed in spectrum presents the feature peaks of R6G at the 10 nM concentration. (b) SERS spectra of R6G (1uM) on the silver nano-array embedded surface after multiple detection cycles.
Download figure:
Standard image High-resolution image
Moreover, SERS substrates are usually for one-time use since the loosely immobilized metal nanoparticles can be easily washed off in the cleaning process. However, in our study, surfaces with silver nano-arrays were more stable because the metal was in situ reduced on the PAA polymer chains, which were covalently grafted on the silicon wafer surface. Such a method gave the silver element advantage of a much stronger interaction with the surface than the simple attachment. Experiments were conducted on the silver nano-array surfaces with an analyte R6G concentration of 1 × 10⁻⁶ M. 2 M NaCl solution, and DI water was used to clean the surface after each detection. The substrate background was examined before each detection. As shown in figure 8(b), the silver nano-array structures survived the cleaning process and retained the ability for SERS detection for as many as four cycles (figure 8(b)). We have successfully decreased the detection limit ten times lower to 1 × 10⁻⁶ M in the recycle tests compared with other reusable substrates [38]. Although our substrates present a respectfully favorable and neat SERS signal enhancement with a decent resolution at a lower concentration, the usability challenge still exists. We did observe the sensitivity decrease during research, indicating there was hot spot loss during the process. It might be associated with different reasons: silver leaching during each measurement cycle, silver loss during the washing process, surface-nanostructure interaction intensity, or other reasons. Further research will look into these aspects to improve and maintain good SERS detection capability for the reusable purpose.
4. Conclusion
In this study, a unique featured silver nano-array surface was presented that was made from a PAA polymer grafted silicon wafer through controlled phase separation and in situ argon plasma reduction. Such Ag nano-array surfaces can be tuned by controlling PAA grafting densities, solvent-mediated phase separation, and Ag + concentration factors on surfaces. Also, the featured surfaces present favorable SERS enhancement and recyclability for multiple detections. This method represented a new technology for surface silver manipulation and patterning in the nanoscale and has broad application potential. Besides the current sensing application on our surfaces, our subsequent research direction is how to tune the metal array with more accuracy and patterns more delicately. Based on the three factors that we described in this paper, promising research directions can be proposed: grafted polymer backbone can provide different interactions patterns for the morphology's foundation; solvent behavior can also control the construction of the three-dimensional structures; also, different metals with different charges can be another derivative that can expand the structure surface to different application based on the desired purposes. Based on the results of the current paper, we could do more research on surface science with various functions and modifications.
Acknowledgments
We thank Dr Fan Yang for the help of SERS data acquisition.
Data availability statement
The data generated and/or analyzed during the current study are not publicly available for legal/ethical reasons but are available from the corresponding author on reasonable request.
Funding sources
This work was supported by the National Institute of Health grant AI110924.