

Abstract
Magnetism induced by defects in nominally non-magnetic solids has attracted intense scientific interest in recent years. The local magnetism in highly disordered undoped and Co-doped topological insulator (TI) Bi2Se3 nanoplates has been investigated by muon spin relaxation (μSR). Using μSR spectroscopy, together with other macroscopic characterizations, we find that these nanoplates are composed of a core with both static fields and dynamically fluctuating moments, and a shell with purely dynamically fluctuating moments. The fluctuations in the core die out at low temperatures, while those in the shell continue till 2 K. When Bi2Se3 is doped with Co, the static magnetic component increases, whilst keeping the dual (static-plus-dynamic) nature intact. The findings indicate that highly disordered TI's could constitute a new class of promising magnetic materials that can be engineered by magnetic impurity doping.
Export citation and abstract BibTeX RIS
1. Introduction
The prejudice against magnetism in materials with filled d- or f-bands or those with only s or p electrons has been shattered in the last two decades with various observations of defect-induced magnetism in systems without magnetic ions [1–4] and the emergence of related theoretical and computational studies [5–7]. Topological insulators (TI's), that represent quantum materials with insulating bulk and Dirac-like gapless surface states, constitute one probable class of such materials [8, 9]. The surface states in TI's are topologically protected by time-reversal symmetry (TRS) [9], which is known to be immune to any external perturbations like defects and non-magnetic impurities [10]. The appearance of spontaneous magnetization on doping TI's with magnetic ions has been shown to break TRS [11], open a small gap in the surface states [11], and lead to interesting phenomena such as quantum anomalous Hall effect (QAHE) [12] and topological magnetoelectric effect [13]. Ferromagnetism and the resultant surface state gap have been reported in Mn and Fe-doped Bi2Te3 single crystals [14, 15], Cr-doped Bi2Se3 thin films [16], and Co-doped Bi2Se3 single crystals [17, 18]. In Cr [19] and V [20] doped (Bi, Sb)2Te3 thin films, QAHE has been observed only at millikelvin temperatures, despite the magnetic ordering temperatures (Tc ) being 15 K for Cr doping [19] and twice the value for V doping [20]. The main problem in realizing QAHE at higher Curie temperatures (in order of hundreds of K) is the presence of defects and unwanted impurities that create impurity bands near the Fermi level and make the bulk conducting. There is another perceived disadvantage of defects in TI's, especially in Bi2Te3 and Bi2Se3. The commonly occurring Te(Se)Bi antisites and Te(Se) vacancies in these TI's provide additional carriers and make them n-type semiconductors [21, 22]. These additional carriers are also expected to influence the magnetic properties, and hence a number of studies on transition metal (Mn, Cr, Fe, Co) doped Bi2Te3 and Bi2Se3 have reported various forms of magnetism: ferromagnetism, paramagnetism, and spin-glass behavior [14, 17, 18, 23–26]. Another problem in studying TIs is the dominance of signals from the conduction of bulk, facilitated by the defect-induced carriers and thermal excitations, over surface [27, 28]. In this scenario, nanostructures of TIs may provide an advantage, because of the high surface-to-volume ratio that reduces the bulk contribution considerably. However, there is also a darker side to it: certain chemically synthesized TI nanostructures do not show metallic surface states because of the extreme disorder that occurs due to the intrinsic defects and short-range atomic order at the vast surface [29]. All of this leads to a perception that defects are undesirable in TI's.
Defects in TI's have also been found promising. For example, unexpectedly room temperature ferromagnetism has been reported in caterpillar-like Bi2Te3 nanostructures without the introduction of any magnetic dopant [30]. According to this report, first-principles calculations indicated that the magnetic moments that were responsible for the ferromagnetism were carried by the BiTe anti-sites. The observed room temperature ferromagnetism is beneficial in that it should promote the development of low-power-consumption electronics and topological quantum computing [30]. In another recent report, surface BiSe anti-site defects have been theoretically shown to possess magnetic moments and should lead to spontaneous ferromagnetism in Bi2Se3 [31]. Furthermore, it has been proposed theoretically that a strong structural disorder beyond a critical level could break TRS and induce a weak localization of charge carriers in TI's [29]. This proposition, in combination with the advantages of nanostructures, has led to a recent report on the observation of paramagnetism, hopping conduction and weak localization of charge carriers in highly disordered (∼1019 defects/cm3) Bi2Se3 nanoplates [32]. These nanoplates were prepared chemically, and were not further processed to intentionally retain the defects that could have occurred during sample preparation. The magnetic moments responsible for the paramagnetism were once again found to be possessed partially by the anti-site defects of the kind BiSe; the other defects which carried the moments were the Bi vacancies. The nanoplates showed very systematic magnetic and transport properties, suggesting that even disordered, as-prepared TI nanostructures could be used in applications without the need of any post-processing. These properties were found to be tuneable with magnetic doping (Dy) [32].
The existing experimental reports on defect-induced magnetism in TI's rely on bulk magnetic measurements [30, 32]. It is, thus, intriguing and imperative to investigate the nature of such kind of magnetism microscopically. To the best of the authors' knowledge, there exists one electron spin resonance based report on local magnetic moments in Bi2Te3, that includes the magnetism due to structural defects of anti-site kind [33]. It is inferred in this report that the moments on the anti-site defects lead to a spin-glass state with zero average magnetization. As far as paramagnetism or ferromagnetism induced by defects in TI's is concerned, this report is inconclusive, and leaves the challenge of understanding the defect-induced magnetism in TI's at local scale open.
Based on the above, the present work aims primarily at studying defect-induced magnetism in highly disordered Bi2Se3 nanoplates using a local probe, namely muon spin relaxation (μSR) spectroscopy. X-ray diffraction (XRD), x-ray photoelectron spectroscopy (XPS), transmission electron microscopy (TEM), DC magnetization, and density functional theory (DFT) computations have also been performed to either supplement or complement the μSR results. In addition, the influence of further magnetic doping of the disordered TI's themselves is also investigated. Co has been taken as the magnetic dopant because of its considerable use as a dopant in TI single crystals, nanoplates, and thin films, and the display of a wide variety of magnetic ordering [17, 18, 26, 34, 35].
2. Experimental details
Cox
Bi2−x
Se3 (where x = 0 and 0.1) nanoplates were synthesized by a solvothermal method, in which BiCl3, Se, CoCl2.6H2O, NaOH, polyvinylpyrrolidone (PVP) powders, and ethylene glycol solution were used as precursors. The composition x = 0.1 has been taken to maximise the effects of the impurity on the observed properties. For the synthesis, relevant amounts of BiCl3, Se, and CoCl2.6H2O powders were first dissolved in an already prepared solution of PVP and ethylene glycol. To this solution, another solution made by dissolving NaOH in distilled water was added. The resultant solution was stirred for 30 min and eventually sealed in a 50 ml autoclave. The autoclave was then heated to 200 ◦C in a muffle furnace, maintained at this temperature for 24 h, and then cooled naturally to the room temperature. The obtained black-colored product was then washed several times in de-ionized water and absolute ethanol and finally dried in vacuum. The XRD measurements were performed using a Bruker D2 Phaser 2nd Generation x-ray diffractometer. The morphologies were explored using a JEOL JEM-2100F microscope. The photoelectron spectra were taken using a PHI5000 Versaprobe XPS system equipped with an Al Kα (h
ν = 1486.6 eV) source. The binding energies were charge referenced to C 1s at 284.5 eV. DC magnetization measurements were performed using a quantum design MPMS SQUID VSM EverCool system. The μSR measurements were performed at the ISIS Pulsed Neutron and Muon Source, UK, in zero field (ZF) and weak (20 G) longitudinal field (LF) and in 2–300 K temperature range using the EMU spectrometer. The μSR data were analyzed using the Mantid data analysis and visualization package [36]. The electronic structure and magnetic properties of vacancies and anti-site defects were calculated using the full-potential linearized augmented plane wave (FLAPW) method of DFT [37], as implemented in the Wien2K code [38]. In the FLAPW method, the crystal lattice is divided into two different regions (i) a spherical volume of the so-called muffin-tin radius RMT around each atom, wherein the potential is considered as atom-like and atomic wavefunctions are used as basis functions, and (ii) the rest, or the interstitial, region in which the potential is considered to be smooth and plane waves are taken as basis functions. The Purdue−Burke−Ernzerhof scheme of the generalized gradient approximation was used for the exchange-correlation potential [39]. The experimentally reported lattice constants a = b = 4.138 Å and c = 28.64 Å were used to create the basic rhombohedral bulk Bi2Se3 crystal structure (space group  m) [40]. For the Bi-vacancy and BiSe anti-site computations in Bi2Se3, the scheme reported in our recent paper [32] has been adopted. In order to represent the experimental composition x = 0.1, a value 0.083 for which the theoretical crystal structure can be generated without having the supercell too big to handle computationally, has been used for the computations. For this (x = 0.083 composition), a 2 × 2 × 1 supercell containing 24 Bi and 36 Se atoms was used, in which 2 Bi atoms were replaced by Co atoms. The maximum multipolarity of the spherical wavefunctions was taken as lmax = 10. The values of RMT around Bi, Se and Co atoms were taken as 2.5 a.u., 2.35 a.u. and 2.47 a.u., respectively. The length Kmax of the maximum wavevector for the plane-wave basis set has been limited by Kmax
R
m) [40]. For the Bi-vacancy and BiSe anti-site computations in Bi2Se3, the scheme reported in our recent paper [32] has been adopted. In order to represent the experimental composition x = 0.1, a value 0.083 for which the theoretical crystal structure can be generated without having the supercell too big to handle computationally, has been used for the computations. For this (x = 0.083 composition), a 2 × 2 × 1 supercell containing 24 Bi and 36 Se atoms was used, in which 2 Bi atoms were replaced by Co atoms. The maximum multipolarity of the spherical wavefunctions was taken as lmax = 10. The values of RMT around Bi, Se and Co atoms were taken as 2.5 a.u., 2.35 a.u. and 2.47 a.u., respectively. The length Kmax of the maximum wavevector for the plane-wave basis set has been limited by Kmax
R
 = 7.0, where
  = 2.35 a.u. is the minimum of the RMT values taken. Fourier expansion of the charge density was limited to Gmax = 12. The gamma-centered 10 × 10 × 10 and 7 × 7 × 1 k mesh were adopted to sample the Brillouin zone for the pure Bi2Se3 and x = 0.083, respectively. All the atoms were relaxed until the Hellmann–Feynmann forces reached upto 1 mRy/a.u. Spin–orbit coupling (SOC) was included in all the calculations, except for the spin-polarized ones.
3. Results and discussion
3.1. Structure, chemical composition and imaging
Figure 1(a) shows the XRD patterns of the Cox Bi2−x Se3 (where x = 0 and 0.1) samples, and the peak identifications on comparison with joint committee on powder diffraction standards data. Most of the peaks can be matched with the rhombohedral structure of Bi2Se3. The additional XRD peaks in Bi2Se3 sample correspond to insignificant Se and Bi2O3 impurities. For x = 0.1 sample, the XRD peaks are shifted to slightly higher 2θ values, indicating the substitutional doping of Co at Bi sites. Figure 1(b) shows an enlarged view of the (1010) peaks with their Gaussian fits to highlight the shift. The lattice constant c is calculated and plotted in figure 1(c). The lattice constant c of x = 0.1 is decreased to about ∼0.4% as compared to pure Bi2Se3 (x = 0) which further confirms the substitutional doping. As atomic radius of Co (0.125 nm) is smaller than atomic radius of Bi (0.163 nm), a decrease in c value is expected for substitutional doping. An impurity peak at 45.9°, corresponding to the (102) reflection of CoSe, emerges on doping, but it is also insignificant to affect the studied results to any considerable extent. Thus, almost phase-pure Bi2Se3 and Co0.1Bi1.9Se3 samples are prepared. The segregation of CoSe phase already at x = 0.1 suggests that for any other x > 0.1 more of the Co atoms would be left undissolved (i.e. would not occupy the substitutional sites). Hence, taking x > 0.1 is undesirable. Figures 2(a)–(c) show the high-resolution XPS spectra and their deconvolutions in Bi 4f, Se 3d, and Co 2p regions. The Bi 4f spectra of both the samples have a major contribution from Bi2Se3 represented by the peaks at ∼157.4 eV for Bi 4f7/2 [41], and a minor contribution from Bi2O3 represented by the peaks at ∼158.3 eV for Bi 4f7/2 [42]. The Bi 4f7/2 peaks are accompanied by the corresponding Bi 4f5/2 peaks with a spin–orbit splitting of 5.3 eV. The Se XPS spectra of both the samples can be deconvoluted into a major Bi2Se3 component, 3d5/2 and 3d3/2 peaks appearing respectively at ∼52.9 and 53.7 eV [41], and a minor Se metal component with the 3d5/2 and 3d3/2 peaks at ∼54.9 and 55.7 eV [43]. The broad peak at ∼58 eV is attributable to loss features [43]. There are slight lower binding energy shifts in the Bi and Se peaks on Co doping, confirming the substitutional incorporation of Co at Bi sites [44], as also revealed by XRD. Figure 2(d) shows the variation of Bi and Se peak positions with x. The Bi 4f7/2 and Se 3d5/2 peaks in doped sample (x = 0.1) are shifted to lower binding energies with a shift of ∼0.04% compared to pure Bi2Se3 (x = 0). The shift further confirms substitutional incorporation of Co in Bi sites. The Co 2p spectrum of the Co-doped sample is deconvolutable into two spin–orbit doublets characteristic of Co2+ and Co3+, and two shake-up satellites [45].

Figure 1. (a) XRD patterns of Cox Bi2−x Se3 samples. (b) An enlarged view of the XRD patterns (circles) around (1010) peak and their Gaussian fits (lines). (c) Variation of lattice constant c with x.
Download figure:
Standard image High-resolution image
Figure 2. High-resolution XPS spectra (circles) and their fits (lines) in (a) the Bi 4f, (b) the Se 3d, and (c) the Co 2p regions. (d) Variation of Bi and Se peak positions with x.
Download figure:
Standard image High-resolution imageFigures 3(a) and (c) show respectively the TEM images of the undoped and Co-doped samples, while the corresponding high-resolution images and selected area electron diffraction (SAED) patterns are shown in figures 3(b) and (d), respectively. From the images, the hexagonal morphology (∼200 nm lateral sizes) of the nanoplates, and their agglomeration on Co doping, can be seen. The lattice planes are clearly observable with lattice spacings of 0.20 nm corresponding to the (110) plane of Bi2Se3 for the undoped sample, and 0.22 nm corresponding to the (1010) plane of Bi2Se3 for the Co-doped sample. The SAED patterns of both the samples show weak and bright diffraction spots. The weak spots may have originated from either (i) the projections of diffractions from higher Lane zone(s) due to the large lattice parameter along the c axis and the low thickness of Bi2Se3 nanoplates (∼20 nm) along the c axis [46], or (ii) the presence of antisite defects or incomplete layers [47]. The clear lattice fringes in the high resolution TEM patterns, along with the spotty SAED patterns, confirm a good crystallinity of the samples.

Figure 3. (a) TEM image of x = 0 sample. (b) The corresponding high resolution TEM image showing the lattice fringes with SAED pattern as shown in inset. (c) TEM image of x = 0.1 sample. (d) The corresponding high resolution TEM image showing the lattice fringes with SAED pattern as shown in inset.
Download figure:
Standard image High-resolution image3.2. Macroscopic magnetism and DFT
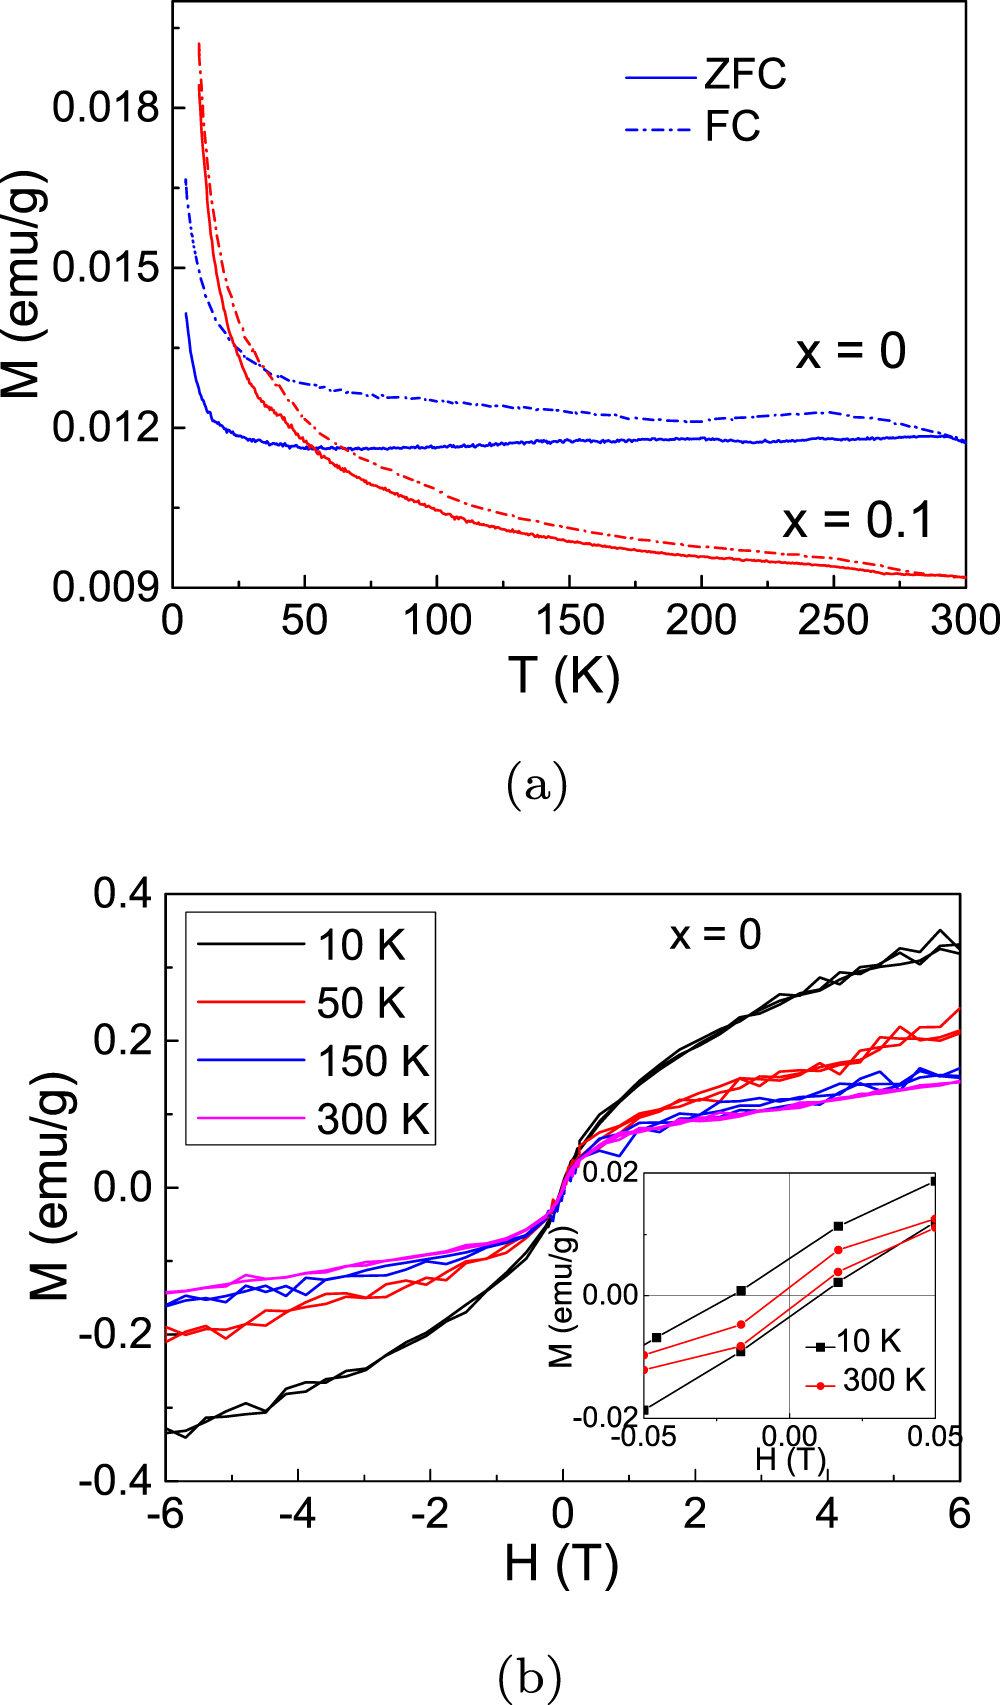
The temperature-dependent magnetizations measured in an applied field (H) of 500 Oe under zero-field-cooled (ZFC) and field-cooled (FC) conditions are shown in figure 4(a). For both the samples, the ZFC and FC curves start splitting from room temperature itself, which is an indication of the presence of a major magnetic component [44, 48]. Apart from the splitting, there is a broad shoulder near 250 K in the FC curves of both the samples, which is suggestive of the samples being superparamagnetic with a large nanoplate size distribution [44]. The upturns in both the ZFC and FC curves in both the cases suggest an additional paramagnetic (PM) phase that could be due to relatively disordered surface spins [44]. In line with our earlier report [44], each nanoparticle can be crudely modelled as having a relatively ordered core, and a relatively disordered shell with the exchange interaction Js between the surface moments being less than the exchange interaction J in the core. The M–H curves recorded at various temperatures for the Bi2Se3 nanoplates are shown in figure 4(b). The occurrence of hysteresis loops and the non-saturation of the M–H curves indicate the presence of both ferromagnetic (FM) and PM phases in the sample, and thus corroborate the above picture.

Figure 4. (a) ZFC and FC magnetization versus temperature at 500 Oe applied field for Cox Bi2−x Se3. (b) M–H curves for x = 0. The inset is an enlarged version of the plot around the zero magnetic field.
Download figure:
Standard image High-resolution imageFor the origin of magnetic moments responsible for the observed magnetism in pure Bi2Se3, which otherwise must be diamagnetic [18, 49], our recent paper [32] can be referred to. According to this, each of the Bi vacancies and BiSe anti-site defects carries a magnetic moment of 1.0 μ B . After subtracting the linear (PM) component from the 10 K M–H curve of the Bi2Se3 sample, ∼0.16 emu g−1 saturation magnetization can be obtained, which is equivalent to a magnetic moment of 0.018 μ B /f.u. This is equivalent to a defect density of ∼1020 defects/cm3, i.e. ∼1.8 atomic%. This is an order of magnitude higher than the defect density reported in the referred paper [32], which itself was considered to make the Bi2Se3 nanoplates highly disordered.
Figure 5(a) shows the M–H curves of the Co-doped sample, wherein the hysteresis (inset) and the non-saturation upto the maximum applied field suggest that both the FM and PM phases are retained on doping. The saturation magnetization obtained by subtracting the linear PM component at 10 K is ∼0.5 emu g−1, which is more than three times the undoped value, and thus indicates an enhancement in magnetism on doping. This is equivalent to a magnetic moment of ∼0.06 μ B /f.u. According to the DFT computations as represented by the Co 3d partial DOS in figure 5(b), each Co atom attains a moment of 2.28 μ B , while there are no induced moments on Bi and Se atoms. This converts to 0.046 μ B /f.u. contribution from Co. Adding the 0.018 μ B /f.u. defect contribution because the defects are anyway also present, this leads to a total of 0.064 μ B /f.u., which justifies the experimentally observed value ∼0.06 μ B /f.u. Further, the 10 K hysteresis loop of the Co-doped sample is wider than the corresponding loop of the pure Bi2Se3 sample. This means, there is an overall enhancement in the magnetic order on Co doping. In terms of the magnetic core–shell picture presented above, the moments in both the core and the shell appear to get more ordered on Co doping.

Figure 5. (a) M–H curves for x = 0.1. The inset is an enlarged version of the plot around the zero magnetic field. (b) Total and partial (Co-d) densities of states for x = 0.083.
Download figure:
Standard image High-resolution image3.3. Local magnetism
Figures 6(a) and (b) show the ZF μSR asymmetry A(t) spectra of pure and Co-doped Bi2Se3 samples at various temperatures; the insets show a comparison between the corresponding zero-field (ZF) and longitudinal field (LF) spectra at 2 K. For both the samples, there are following three common qualitative observations from the ZF spectra: (i) there is a successive loss in the initial asymmetry with decreasing temperature, (ii) there are no oscillations, and (iii) the asymmetry shows a qualitatively exponential decay with time. For long-range magnetic ordering when electronic static fields are present, an oscillatory signal with a frequency proportional to the local field at the muon site is, in general, expected. However, such oscillations, if present, might depolarize rapidly [50], and die before the occurrence of the first data point (0.22 μs) obtainable with the ISIS spectrometer. In this situation, the magnetic order will reflect as a loss in the initial asymmetry [51]. Therefore, the first two observations together signify the presence of a long-range magnetic order, although the corresponding electronic static field is not derivable from the present data. The full asymmetry achievable with the ISIS instrument is 0.22 for purely fluctuating moments, and the initial room temperature ZF asymmetry of the undoped sample is ∼0.23. So, at room temperature, the undoped sample has little static component. However, the corresponding value for the Co-doped sample is ∼0.20. This qualitative comparison is valid at all the temperatures. So, the Co-doped sample is magnetically more ordered and thus has more electronic static component. In the absence of electronic static moments, i.e. when only the nuclear static fields are present, a longitudinally applied 20 G field is typically sufficient to decouple the ZF and LF spectra [52]. So, a slightly incomplete decoupling of the 2 K ZF and LF spectra of the undoped sample (the inset of figure 6(a)) is an additional signature of the presence of static electronic moments in this sample at this temperature. The perception that the doped sample is more ordered is further strengthened by the even less incomplete decoupling of the 2 K ZF and LF spectra of this sample, as shown in the inset of figure 6(b).

Figure 6. (a) Asymmetry spectra in ZF mode of x = 0 sample and fitting using equation (1). The inset shows the asymmetry of x = 0 at 2 K in ZF and LF measurements. (b) Asymmetry spectra of x = 0.1 sample in ZF mode and fitting using equation (1). The inset shows the asymmetry of x = 0.1 at 2 K in ZF and LF measurements. (c) Variation of effective initial asymmetry with temperature of Cox Bi2−x Se3 samples under zero-field. The dotted lines are a guide to the eyes. (d) Variation of relaxation rate with temperature of Cox Bi2−x Se3 samples under zero-field.
Download figure:
Standard image High-resolution image
If there are also dynamic moment fluctuations, they result in an exponential decay of asymmetry at longer times [50]. The third observation, i.e. the qualitative exponential decay of all the asymmetry spectra, thus, suggests that there are also dynamic moment fluctuations in both the samples, apart from the (unquantifiable) static fields. This conjecture is further assisted by the fact that ZF μSR spectra of both the samples can be best fitted using an exponential function plus a constant background of the form:

where A0 is the effective initial asymmetry, λ is the electronic relaxation rate, and AB
is the temperature independent background that would appear when a fraction of muons cross the sample and stop in the Ag sample holder. The relaxation rate is given by λ =  , where Δdyn
/γμ
(γμ
= 2 π × 135.5 MHz T−1 is the muon gyromagnetic ratio) is the dynamic field distribution width and ν is the frequency of fluctuation of the electronic moments [53].
, where Δdyn
/γμ
(γμ
= 2 π × 135.5 MHz T−1 is the muon gyromagnetic ratio) is the dynamic field distribution width and ν is the frequency of fluctuation of the electronic moments [53].
The temperature dependence of A0, as obtained from the fittings, is shown in figure 6(c) for both the samples. We analyze the two curves one by one. In the case of undoped Bi2Se3, starting from 300 K, the curve appears to have a constant (saturation) value of ∼0.180 till ∼265 K, then decreases monotonically to ∼0.124 at ∼65 K, and then remains roughly constant down to 2 K. The maximum (saturation) in A0 occurring near 300 K is indicative of the presence of purely dynamic moments at these temperatures. In the ideal situation of a PM (completely disordered) to FM (completely ordered) phase transition, A0 is expected to drop to A0/3 sharply at the transition temperature [53]. A reduction in A0 is a qualitative measure of the spin fluctuation frequency ν that is supposed to have a high value in the disordered state and become zero in the ordered state. There are two deviations in the present data from the ideal: (i) A0 does not drop to A0/3 = 0.06 at low temperatures; it is 0.124–0.06 = 0.064 higher than for a single-component magnetically ordered (like FM) material. This indicates that there is another more disordered component, the spin fluctuations of which do not get arrested at the lowest measured temperatures [53]. This substantiates the conjecture that the sample is composed of a relatively ordered core (with a relatively large exchange interaction J) and a relatively disordered shell (with a relatively small exchange interaction Js
). (ii) The transition is very broad (65–265 K). This is a signature of the high structural disorder [53], as has been inferred earlier. In the case of Co-doped sample, however, the following three observations can be noted: (i) the room temperature initial asymmetry has not reached the corresponding value obtained for the undoped sample. This means, the sample has a larger ordered (static) component than possessed by the undoped sample even at 300 K. This additional order is brought in by the larger Co moments over and above the smaller defect moments. This appears to have strengthened both the exchange interactions J and Js
to some J+ > J and  , respectively. This is the reason for the A0 value of the doped sample to be systematically smaller than the corresponding undoped value at all the temperatures. (ii) The 2 K initial asymmetry is still way above the ideal 0.062 value. This means, the dynamically fluctuating spins corresponding to the shell have not been arrested even at this temperature, although they are now slower than those in the undoped sample because of the enhanced exchange interaction. (iii) A0 decreases essentially monotonically from 300 to 2 K without any saturation. This is likely due to the additional structural disorder that has been generated on Co doping.
The λ versus T curves for the two samples are shown in figure 6(d). If we ignore the kinks occurring at ∼135 K to avoid any over-interpretation of the results obtainable with the present limited data, both the curves appear to increase monotonically on temperature reduction. If we further assume that Δdyn has a rather weak temperature dependence, this monotonic rise in λ signifies decreasing moment fluctuation (rate) on decreasing the temperature. This is in line with the inference made from the A0 versus T curves. Further, the systematically higher λ for the doped sample than for the undoped sample at all the temperatures gives an additional support to the earlier conjecture that the doped sample has more order (less moment fluctuations) than the undoped one.
To summarize the μSR results, both the pure and Co doped Bi2Se3 nanoplates comprise of two magnetically separate regions: (i) a core with both static fields and dynamically fluctuating moments, typical of an FM materials, and (ii) a shell with purely dynamically fluctuating moments, akin to a PM material. This is in agreement with the macroscopic observations of both FM and PM states in the samples. The fluctuations slow down with temperature reduction. In the core, this results in a gradual enhancement of the static component. In this volume, the fluctuations are apparently arrested fully at the lowest temperatures, giving way to a fully static field (ordered state) at these temperatures. The transition between the fully static and (nearly) fully dynamic states is broad due to the high structural disorder arising from the defects. The moment fluctuations of the shell also slow down with decreasing temperature, but are still present at the lowest temperatures as in a PM material. The Co doped sample has slower fluctuations (more magnetic order) than the undoped sample at all temperatures, and the transition between the fully static to fully dynamic states could not take complete in the measured temperature range. It can be conjectured that the high concentration of magnetic moments associated with the defects in highly disordered Bi2Se3 nanoplates act as normal magnetic dopants; magnetic (Co) doping enhances the magnetism further. So, it would perhaps not be wrong to say that highly disordered TI's could act as magnetic materials even without any magnetic ions, and their magnetic properties can be engineered by magnetic impurity doping.
4. Conclusion
Cox Bi2−x Se3 (x = 0 and 0.1) nanoplates have been synthesized using a chemical solvothermal method. X-ray diffraction patterns and x-ray photoelectron spectra confirm the presence of the Bi2Se3 phase and Co doping in the samples appropriately, while the electron images and diffraction find the right shape and crystallinity of the nanoplates. Macroscopic magnetizations reveal the simultaneous presence of ferromagnetic and paramagnetic regions in both the samples, with the Co-doped sample having an enhanced magnetic order. DFT computations place the moments on Bi vacancies, BiSe anti-site defects and Co atoms, and assure the highly disordered nature of the two samples. The measured magnetic moments per formula unit are justifiable with the computed moments. μSR results find that the undoped and Co-doped highly disordered topological insulator Bi2Se3 nanoplates consist of two regions—a core with both static fields and dynamic moment fluctuations, and a shell with exclusively dynamic moment fluctuations. The μSR observations are in agreement with the bulk magnetism. With temperature reduction, the fluctuations slow down: these are arrested fully at the lowest temperatures in the core region, while are still present in the shell. The results indicate that even highly disordered TI nanostructures without magnetic ions could be used as magnetic materials, that can be engineered with magnetic doping.
Acknowledgments
We acknowledge the help provided by S K Ray and his laboratory members at IIT Kharagpur during the sample preparation. Anu Gupta thanks IIT Kharagpur for providing the financial assistance to carry out this research work, and ISIS, STFC, UK [54] for the Newton funding and the beamtime to conduct the μSR experiments.
Data availability statement
The muon data can be accessed from DOI: 10.5286/ISIS.E.RB1768023.