

Abstract
In this work, graphene quantum dots (GQDs) were synthesized by femtosecond laser ablation in liquid using laser induced graphene as the carbon source. Nitrogen-doped graphene quantum dots (N-GQDs) were successfully synthesized by adding ammonia water to the graphene suspension. The GQDs/N-GQDs structure consist of a graphitic core with oxygen and nitrogen functionalities with particle size less than 10 nm, as demonstrated by x-ray photoelectron spectroscopy, Fourier infrared spectrometer spectroscopy, and transmission electron microscopy. The absorption peak, PL spectrum, and quantum yield of the N-GQDs were significantly enhanced compared with the undoped GQDs. Further, the possible mechanism of synthesis GQDs was discussed. Furthermore, the N-GQDs were used as a fluorescent probe for detection of Fe3+ ions. The N-GQDs may extend the application of graphene-based materials to bioimaging, sensor, and photoelectronic.
Export citation and abstract BibTeX RIS
1. Introduction
GQDs are zero-dimensional graphite nanomaterials, which are small fragments with a graphene structure with a diameter of less than 10 nm. This resulted in quantum confinement and edge effects, in which the crystal boundary significantly modifies electron distribution for the reduced dimension of the crystal to nanometer scale. GQDs have obvious advantages in various fields, such as solar cells [1–5], sensors [6–9], photodetectors [10–14], light-emitting diodes [15–17], bioimagings [18–20], drug carriers [21, 22], and biomedical applications [23], due to their low toxicity, low cost, strong luminescence, and easy synthesis. Generally, GQDs are manufactured by wet chemical routes using expensive carbon precursors, for instance, graphene [24], graphene oxide [25, 26], carbon nanotubes [27], and carbon nanofibers [28]. Moreover, the wet chemical route is usually carried out under strong acid conditions, which requires complicated and time-consuming washing steps. Therefore, it is necessary to choose a more cost-effective carbon source and a greener preparation method for preparing GQDs. Synthesizing GQDs by pulsed laser ablation in liquid (PLAL) is simple, environmentally friendly, and convenient, because it does not require the addition of toxic compounds and post-purification treatment. In addition, the choice of precursor in the PLAL method is very important. Santiago et al reported a one-step route of GQDs using pulsed laser ablation with carboxyl-functionalized multiwalled carbon nanotubes (MWCNTs) [29]. Russo et al reported that single-step synthesis of GQDs by femtosecond laser ablation of graphene oxide dispersions [30]. Due to the lower optical properties of GQDs fabricated by the PLAL, doping heteroatom into GQDs is one good method to enhance optical properties [31]. From the perspective of the structure and function, nitrogen-doped carbon structures were proposed to improve the electronic characteristics due to the presence of strong electronic affinity of the nitrogen atom [32, 33]. Calabro et al reported using laser ablation to produce N-GQDs from carbon nano-onions in aqueous solutions of ammonia, ethylenediamine, and pyridine [31]. In these studies, most of the precursors are relatively expensive and not easily available, which is not conducive to the large-scale synthesis of GQDs.
In this work, a potentially cost-effective and easy method to synthesize N-doped GQDs via the PLAL process using laser induced-graphene (LIG) as the carbon precursor was demonstrated. Compared with solid targets, LIG dispersed in a solution has the three-dimensional processing feature, which can produce nanoparticles with better dispersion, smaller particle size, and more uniformity [34]. Besides, femtosecond laser is easier to break chemical bonds than other lasers due to its extremely high peak power. Due to its limited fluorescence properties of GQDs, ammonia was selected as doping precursors to fabricated N-GQDs to improve their electronic and optical properties. Based on our measurement, the N atoms can be effectively incorporated into the GQDs via the PLAL process. Also, the chemical composition of the N-GQDs was investigated by x-ray photoelectron spectroscopy (XPS) and the enhanced PL mechanism of the N-GQDs was discussed. The facile fabrication and superior performance evidenced that N-GQDs fabricated by PLAL are promising for applications of optoelectronics or biomedical industry.
2. Experimental
2.1. Materials
Polyimide (PI) film with 125 μm thickness was used for preparing laser induced graphene. Ammonia and ferric nitrate purchased from Aladdin (China), and quinine sulfate was purchased from Adamas-beta (China).
2.2. Synthesis of GQDs and N-GQDs
The schematic for the synthesis of GQDs/N-GQDs dispersion is shown in figure 1. LIG was prepared by irradiating a PI film with a 10.6 μm CO2 laser. The 3.5 W of laser power and the 20 mm s−1 of scanning speed were selected to irradiate the PI film to prepare LIG. Then the LIG produced on the surface of the PI film was scraped to obtain LIG powder. A certain amount of LIG powder was mixed with deionized water and ammonia water to prepare LIG suspension with the concentration of 1 mg ml−1, and kept the ammonia water as 0%, 6%, and 12%, respectively. Then ultrasonic treatment was performed for 30 min to make these suspension liquids fully dispersed. Next step, a focused fiber femtosecond laser (FemtoYL, 1030 nm, 365 fs) was used to perform laser ablation on the suspension liquid at a repetition frequency of 100 kHz with 8 W laser power. The LIG suspension continuously was irradiated and the GQDs were formed by the laser ablation. Light brown colloidal dispersion was obtained after laser ablated the LIG in deionized water and ammonia.
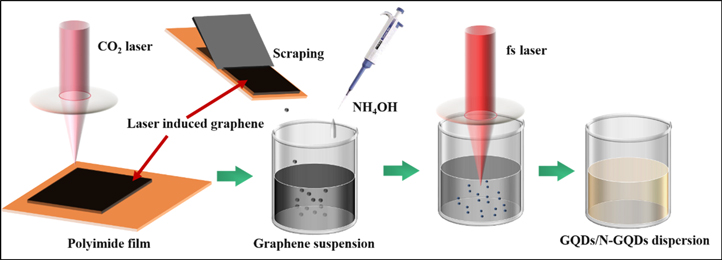
Figure 1. Schematic for the synthesis of GQDs/N-GQDs dispersion.
Download figure:
Standard image High-resolution image2.3. Characterization and measurement
The prepared LIG was characterized by Raman spectroscopy (λ = 532 nm, HORIBA, France) and scanning electronics microscope (SEM, SU8220, Hitachi). The obtained graphene suspension was placed on a silicon wafer and dried, and then the Raman spectrum and the SEM were characterized. The size and morphology of the GQDs and N-GQDs were analyzed by a transmission electron microscope (TEM, LEM-2100F, JEOL). An UV–vis spectrophotometer (Evolution 300, Thermo Scientific™) and a FTIR (Tensor 27, BRUKER) were used to acquire the absorption spectra of GQDs and N-GQDs. The fluorescence spectrums were measured by a spectrometer (Acton SP2750i, Princeton Instruments) under 300, 360, and 390 nm excitation wavelengths, respectively. X-ray photoelectron spectroscopy (XPS, 250i, Thermo Fisher Scientific) was used to confirm the element content and proportions of chemical bonds of the GQDs and N-GQDs. Quinine sulfate in water (QY = 0.58) was chosen as the standard for measuring the QY of excited pristine GQDs and N-doped GQDs. The quantum yields of GQDs and N-GQDs were calculated according to the following equation:

where Φ is the quantum yield, I is the measured integrated emission intensity, η is the refractive index of the solvent, and A is the optical density. The subscript 'st' refers to the standard of known quantum yield and 'x' refers to the sample.
2.4. Fluorescent display and quenching
A fluorescent gel was prepared by mixing N-GQDs and polyvinyl alcohol (PVA) powder in a ratio of 1:10, and stirring with a magnetic stirrer at 80 °C for 6 h. The obtained gel was coated on a glass slide and dried in an oven at 80 °C for 3 h, then a 'SCU' logo was engraved using a laser cutting system. To explore the fluorescence quenching application of N-GQDs, PL measurements were performed in the presence of Fe3+ with the concentration from 1 to 200 μM.
3. Results and discussion
In figure 2(a), Raman spectra generally exhibited the typical graphene signals, showing a 2D peak at ∼2667 cm−1 (originating from the second-order zone-boundary phonons), a D peak at ∼1350 cm−1 (induced by the defects or bent sp2 carbon bond), and a G peak at ∼1572 cm−1 (in-plane phonon vibration of sp2 carbon). Meanwhile, the higher D peak indicated the LIG has more disorder due to defects and amorphous carbon content. From the morphology of LIG (figures 2(b)–(c)), it can be seen that most of the graphene particles are flake graphene structure with sizes ranging from nanometers to micrometers after ultrasonic treatment.
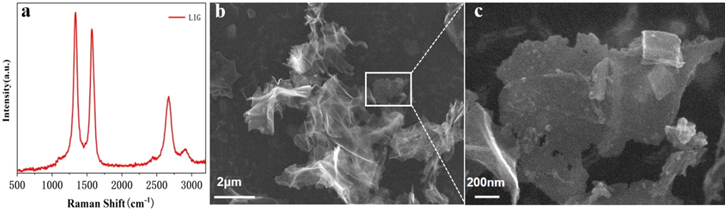
Figure 2. (a) Raman spectrum of LIG. (b) SEM picture of LIG. The graphene suspension is dried on the silicon wafer. (c) High-magnification SEM image of LIG.
Download figure:
Standard image High-resolution imageFigure 3(a) demonstrates the TEM image of undoped GQDs with a 20 nm scale, and the size of the GQDs is mostly below 10 nm with a 3.5 ± 2.02 nm average particle size (figure 3(c)). The HRTEM images of different GQDs in figure 3(b) exhibit the well-resolved lattice fringes. The fast Fourier transform (FFT) pattern of the GQDs (in the right inset of figure 3(b)) reveals a standard six-fold symmetry of GQDs. The inverse fast Fourier transform (IFFT) pattern (in the left inset of figure 3(b)) reveals the clear lattice fringes and the lattice spacing of 0.24 nm. Compared with GQDs, N-GQDs particles demonstrated in figures 3(d)–(f) are more uniform and have a smaller particle size of about 3.1 ± 0.79 nm. It illustrates the gradual destruction of hexagonal structure with an approach towards amorphous nature, consistent with the previous report [35]. The lattice spacing is 0.22 nm, which is slightly lower than that of GQDs. The reason may be related to the compressive strain of N-GQDs [36]. The AFM images shown in figures 3(g)–(i) reveal the thickness of LIG, GQDs, and N-GQDs. The AFM image of LIG shows it has a large thickness range from 5 nm to tens of nanometers, indicating a multilayer structure. While, the GQDS and N-GQDs with small number of thicker particles size are larger than 2 nm, but most of the particles are about 1–2 nm, demonstrating the synthesized QDs are 1–3 layers.

Figure 3. (a) TEM image of GQDs. (b) A HR-TEM image of GQDs. The inset is the GQDs lattice spacing and FFT image. (c) Particle size distribution of GQDs. (d) TEM image of N-GQDs. (e) The HR-TEM image of N-GQDs. The inset is the N-GQDs lattice spacing and FFT image. (f) Particle size distribution of N-GQDs. (g)–(i) AFM images of LIG, GQDs, and N-GQDs. The insets are the height profile along the red and blue lines.
Download figure:
Standard image High-resolution imageThen the absorption spectrum of the GQDs and N-GQDs were acquired with an UV–vis spectrophotometer and shown in figure 4(a). The inset shows the peak fitting of the absorption spectrum of 6% N-GQDs. In the absorption spectrum, GQDs and N-GQDs have a main absorption peak at 201 nm and weak shoulder peak at 255 nm, as shown in figure 3(a). The absorption band is mainly related to the transitions of π–π* such as C=C, C=N, C=O [36–38]. The intensity of the two peaks of N-GQDs are significantly higher than that of the undoped GQDs, which indicated that N doping leads to the enhancement of the π–π* transition. According to reports, a pair of electrons contributed by pyridinic-N in N-GQDs to sp2 of C may lead to enhanced absorption [39]. Furthermore, the N-GQDs have a weak shoulder around 340 nm, which involves the electronic transition of n–π* with C=O and C–O at the edge of the N-GQDs. It's also related to the transition of C–N or C=N [31, 36–38]. In addition, all the samples exhibit high PL emission with 300, 360, and 390 nm light excitations. The normalized PL excitation spectra of all samples are presented in figures 4(b)–(d), which shows the excitation wavelength dependence of different types of GQDs. Under 300 nm excitation, the peak of PL spectra at ∼425 nm, while that of 360 nm and 390 nm excitation are at ∼450 nm and 497 nm, respectively, which show excitation-dependent emission. The reason for the excitation wavelength dependence of GQDs is probably that the size and surface state distribution of GQDs are not uniform prepared by PLAL. Besides, it's worth noting that the PL intensity of N-GQDs is much higher than that of undoped GQDs, which is owing to the presence of electrondonating N atoms and radiative surface functional groups [36]. Dilute GQDs and N-GQDs to keep their absorption coefficient consistent with the prepared quinine sulfate solution for measuring quantum yield. Calculated by the formula (1), the quantum yields of 6% N-GQDs and 12% N-GQDs are 4.3% and 6%, respectively, which are improved compared to the 1% quantum yield of undoped GQDs. As demonstrated in figure 4(e), it can be seen that the 'SCU' has a transparent color under white light, but exhibits obvious blue fluorescence under the irradiation of a 360 nm ultraviolet lamp.
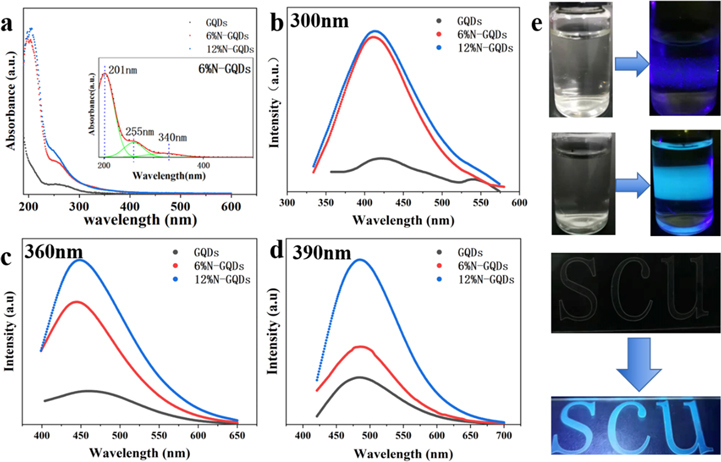
Figure 4. (a) Absorption spectra of GQDs and N-GQDs. (b)–(d) The fluorescence spectra at excitation wavelengths of 300 nm, 360 nm, and 390 nm respectively. (e) The Photographs above are GQDs and N-GQDs under white light and 390 nm laser irradiation. The 'SCU' logo made with N-GQDs and PVA under white light and 360 nm ultraviolet light irradiation.
Download figure:
Standard image High-resolution imageFrom the XPS shown in figure 5(a), the prepared LIG has C1s peak and O1s peak, but no obvious N1s peak. Although there is a weak N1s peak in the prepared LIG, an obvious N1s peak accounting for 6.06% appears in the prepared undoped GQDs, which are presumably introduced from the air [31]. Compared with LIG, the O content of graphene quantum dots is increased. The ratio of the N1s peak of the N-GQDs grows greatly, respectively 16.17% and 13.99%, indicating that N is effectively doped into the GQDs. From the FTIR spectroscopy of those GQDs revealed in figure 5(d), the LIG exhibits the C=C stretching band at 1637 cm−1, the C–O stretching band at 1103 cm−1, and two vibration bands at 1400 and 1271 cm−1 due to the stretching of the C–N bond. While, the N-GQDs spectra exhibit an augment of C–N stretching band intensity associated with the incorporation of nitrogen into the structure. These results agree with those obtained by XPS, this further illustrates that the laser ablation process in ammonia enhances nitrogen atom doping. Compared with GQDs, the proportion of O1s peak in N-GQDs respectively decreased from 29.26% to 28.52% and 23.61%, as shown in figure 5(b). Analyzing the N1s peak of the GQDs in figure 5(c), with the increase of ammonia concentration, the peak of pyridinic-N rises while the peak of pyrrolic-N reduces and thus leading to an increase in fluorescence.
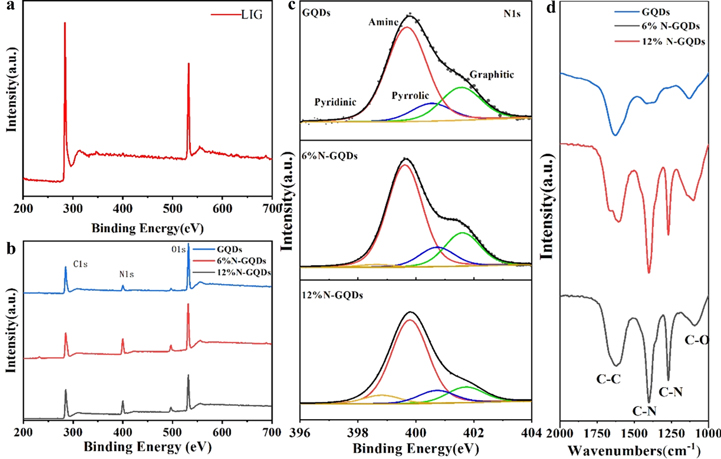
Figure 5. (a) XPS of prepared LIG. (b) XPS of the synthesized GQDs and N-GQDs with 6% ammonia and N-GQDs with 12% ammonia. (c) High resolution N1s x-ray energy spectrum. (d) FTIR spectra of GQDs, N-GQDs with 6% ammonia, and N-GQDs with 12% ammonia.
Download figure:
Standard image High-resolution imageFigure 6 presents the chemical structure of graphene and after it becomes GQDs in water and ammonia solution. Due to laser irradiation, large particles became small particles in the aqueous solution. The C–C, C=C chemical bonds break and combine with O and H, then translate to C–OH and O=C–OH functional groups, so the oxygen content increases. Besides, the small amount of N atoms entered the GQDs probably from the N2 in the air [31]. Most of the N atoms combine with the outer C atoms to form the amine structure, and a small amount of N atoms replace the C atoms in the graphene to form the Graphic-N structure. Another small amount of N atoms replace the peripheral C atoms to form pyrrolic-N structure. In the aqueous ammonia solution, a large number of N atoms are incorporated into GQDs. In addition, there is also a structure pyridinic N in which the peripheral C atoms are replaced by N and do not carry H atoms. And as the concentration of ammonia increases, the proportion of pyridinic-N rises, which is also the main reason for the enhancement in fluorescence [40]. The possible mechanism for the transformation of LIG to GQDs via the PLAL method is proposed. The femtosecond laser pulsed (∼365 fs) phenomenon is typically associated with the generation of a plasma plume and thermal decomposition near the laser focus region. These phenomena are correlated to the thermal heating, melting, and evaporation by laser ablation [41–43]. The energy of the laser is absorbed by electrons and then transferred to the lattice. The time scale for the energy transfer from electrons to atoms is around one order of magnitude larger than the duration of the femtosecond laser pulse [44, 45]. The temperature of the electrons will rise sharply until the surface melts. This highly ionized liquid will explode and split to produce ionized nanoparticles and ions. Subsequently, as the plasma cools by the surrounding liquid [41], the ions and nanoparticles will recombine with various functional groups such as pyrrolic-N, pyridinic-N, graphitic-N and, amine groups.
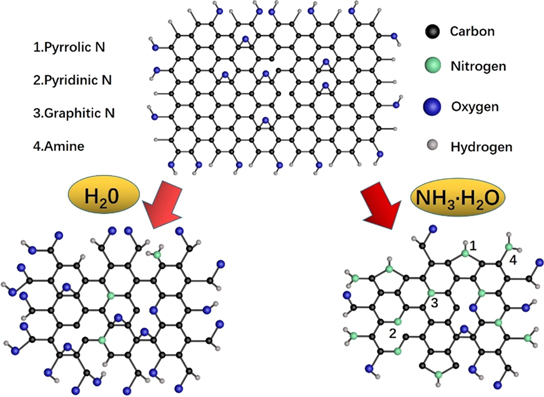
Figure 6. The reaction diagram of the synthesis of GQDs and N-GQDs.
Download figure:
Standard image High-resolution imageTo explore the application of N-GQDs, we performed N-GQDs as a fluorescence probe for the detection of Fe3+ ions. As well known, Fe3+ ion is an essential trace element that plays a significant role in chemical and biological processes, and Fe3+ ion fluctuations are the hallmarks of diseases such as anemia, intelligence decline, arthritis, heart failure, diabetes, and cancer [46, 47]. As shown in figure 7(a), a decrease in fluorescence intensity of N-GQDs was observed as the concentration of Fe3+ ions increased from 0 to 200 μM. As the concentration of Fe3+ ion increasing, the fluorescence intensity gradually weakens. When the Fe3+ ion concentration is 100 μM, its fluorescence intensity has dropped by 82% of the original. While, the Fe3+ ion concentration reaches to 200 μM, the fluorescence intensity drops to 3.7% of the original. Figure 7(b) shows a correlation between the fluorescence enhancement factors ((F0 − F)/F0), defined as the fluorescence change by the Fe3+ ions. This exhibits the linear relation in the low concentration and the saturated curve in the high concentration of Fe3+ ions. The fluorescence quenching induced by Fe3+ can be ascribed to the coordination or chelation between Fe3+ and the hydroxyl groups on the edge and surface of N-GQDs [48].

Figure 7. (a) The fluorescence spectra of N-GQDs with 0–200 μM Fe3+, (b) calibration curve for Fe3+ detection.
Download figure:
Standard image High-resolution image
4. Conclusions
In summary, the GQDs and N-QGDs have been successfully synthesized from LIG by laser ablation in liquid. It proved that LIG is a cost-effective carbon source and LAL is a green preparation method for preparing GQDs. The PL spectra reveal that these GQDs show excitation-dependent emission, which is related to the size and surface state distribution of GQDs. Besides, the higher PL intensity of N-GQDs is owing to the presence of a high concentration of pyridinic nitrogen. Also, the possible mechanism of synthesis N-GQDs is correlated to femtosecond laser induced plasma and quick cooling by the surrounding liquid. Meanwhile, the N-GQDs used as fluorescence probes for the detection of Fe3+ ions were demonstrated. The facile and low cost way to synthesize GQDs through PLAL will expand the applications in optoelectronics and biology.
Acknowledgments
We appreciated a grant from the National Natural Science Foundation of China (No. 61905168, No. 61905169, No.61705148).
Data availability statement
All data that support the findings of this study are included within the article (and any supplementary files).