

Abstract
The present work reports nanocomposite of CdSe/V2O5 core–shell quantum dots with reduced graphene oxide (rGO-V-CdSe), as an efficient lightweight electromagnetic wave shielding material, synthesized by a simplistic solvothermal approach. The as-synthesized nanocomposite was analyzed for its structural, compositional and morphological features by x-ray diffraction (XRD), transmission electron microscopy (TEM), Raman spectroscopy and x-ray photoelectron spectroscopy (XPS). The measurement of complex permittivity/permeability and total shielding efficiency of the as-synthesized samples has been done in a wide frequency range of 8–12 GHz (X-band). Compared to rGO and rGO-CdSe, rGO-V-CdSe nanocomposite exhibits significantly enhanced EMI shielding properties in terms of both dielectric loss and total shielding SET. The high value of real permittivity (average ε'∼70) and the overall shielding effectiveness up to ∼38 dB have been recorded for rGO-V-CdSe nanocomposite. The studies also infer that the absorption contributes more in total shielding than reflection. The high value of dielectric loss and shielding effectiveness could also be attributed to the presence of various defects leading to dipolar and interfacial polarizations. The excellent EMI shielding properties of the nanocomposite in GHz frequency range (X-band) pave an intuitive way for fabricating a versatile EMI shielding nanocomposite material for applications.
Export citation and abstract BibTeX RIS
Introduction
In recent years, rapid and unprecedented advancement in electronic devices for applications in diversified areas, have proliferated the inevitable generation of electromagnetic radiations leading to serious concerns ranging from temporary disturbances and data losses to critical system failures [1–4]. The undesirable interference of radiation emanating from these pervasive equipment has become a growing concern as it not only adversely affects the equipment operation but also the human living space [5, 6]. To mitigate these issues, the search for high-performance electromagnetic interference (EMI) shielding material has gained extensive attention in recent years. In this aspect, metal and magnetic materials have been potential candidates as they possess high electrical conductivity which limits the intervention of electromagnetic radiation either through reflection, absorption or both, but their use for shielding operation has constraint due to their cost, density and being vulnerable to corrosion [7–10]. The demand for innovative EMI protection by highly efficient absorbers with lightweight, less thickness, wide absorption bandwidth and strong absorption characteristics, has met with different forms of carbonaceous materials such as expanded graphite, carbon black, graphene, carbon fibers, single or multiwalled carbon nanotubes (MWCNTs) and conducting polymers [11–14]. But various issues such as poor dispersion, presence of impurities, lack of interfacial adhesion with other materials and high production costs, have hampered their comprehensive acceptability as EMI screening materials [15, 16]. One more serious issue is associated with these carbon-based materials, as they lack magnetic properties and their EM absorption properties owe to dielectric loss. To overcome these issues, composites have been proposed to be fabricated to tune the relative complex permittivity [17, 18]. The composite structures affect EM waves propagations into the absorbers, but its thickness has to be increased accordingly. Furthermore, the dielectric properties of composites immensely turn on the interface interaction between the absorbing phases. Since the interface effect plays an important role in EM wave absorbing mechanism, the core–shell composites with several outstanding properties such as low density, large specific surface area, less thickness, functional nanostructure and synergistic effects of both the cores and shells, have shown the ability to deliver better shielding values [19–22].
Many core–shell structured nanocomposites comprising Fe3O4 cores viz Fe3O4/C, Fe3O4/ZnO, Fe3O4/TiO2 etc, have been studied recently and the findings have shown significant microwave absorption performance [23–25]. Shui and Chung have suggested that nickel coated carbon filaments with core–shell structure onto a polymer sulfone matrix contain higher EMI SE than those of composites using fillers without coating [26]. De Rosa et al has reported that nickel coated carbon fibers/polyester composites have better electromagnetic absorption properties on account of their special core–shell structure [27]. Zhu et al have outlined that the absorption properties of one-dimensional core–shell barium titanate (BaTiO3) with MWCNT composites exhibits substantially improved value as compared to those of the pristine MWCNTs and BaTiO3, individually [28]. The studies of Han et al have established the excellent absorption with core–shell structured C/ZnO nanoparticles composite [29]. It is observed that most of the studies have been carried out on core–shell structured hybrids using magnetic or ferroelectric nanoparticles. However magnetic materials usually confront the same concern of its known high density. It is, therefore, needed that the studies be extended to non-magnetic core–shell structure with reduced thickness.
Based on the above motivation, we, herein, report a facile approach to synthesize a core–shell rGO-V-CdSe nanocomposite, for EMI shielding application in the frequency range of 8.4–12 GHz. The findings have been analyzed and discussed for structural, morphological, chemical composition and shielding properties of the as-synthesized nanocomposite. These core–shell based nanocomposite structures offer the synergistic properties of individual constituents. To the utmost of our cognizance, this study carries the first report on EMI performance of the rGO-V-CdSe nanocomposite.
Experimental section
Materials and methods
Pure graphite (99.99%), sodium acetate (Fisher Scientific), vanadium (III) chloride (99%, Alfa Aesar), toluene (C6H5. CH3, Thomas Baker), ethylene glycol, ethylene diamine (Merck), HNO3, H2SO4, KClO3, and dodecylamine (DDA) (98%, Alfa Aesar), were purchased from the commercial market. Li4[Cd10Se4(SPh)16] clusters were prepared following a method reported somewhere earlier [30].
All reactants and solvents were of analytical grade and used as such without further purification. The aqueous solutions were prepared through ultrapure double distilled water as a medium.
Synthesis procedure
The synthesis process of the incumbent products, involved following steps;
Synthesis of CdSe and CdSe/V2O5 core/shell QDs (denoted as V-CdSe)
CdSe QDs were synthesized by a method reported earlier with slight modifications [31]. In a typical synthesis, 120 mg of Li4[Cd10Se4(SPH)16] cluster was added to 10 ml of DDA at 100 °C and then allowed to be kept at 120 °C for about 30 min. Next, the temperature was raised to 220 °C and maintained for nearly 3 h. Further, the as obtained reaction mixture was cooled to the room temperature. For the synthesis of CdSe/V2O5 core/shell QDs, VCl3 (10 mg) were added at 120 °C and further, the temperature was raised to 220 °C. The mixture was finally allowed to cool to the room temperature in the nitrogen gas atmosphere.
Synthesis of rGO-CdSe and rGO-V-CdSe nanocomposites
A slightly modified Solvothermal method was used to carry out the preparation of rGO-CdSe and rGO-V-CdSe nanocomposites. Briefly, 10 ml of freshly prepared CdSe QDs (or CdSe/V2O5 core/shell QDs), 90 ml ethylene glycol, 200 mg graphite oxide, 6 g sodium acetate, and 15 ml ethylene diamine, were all put together in a beaker followed by ultrasonication to make the first solution. Next, the as-received homogeneous suspension was transferred into a 150 ml Teflon coated stainless steel autoclave and maintained at a constant reaction temperature 200 °C for 12 h, followed by natural cooling. The resultant solution was washed several times by centrifugation for 15 min each at 5000 rpm. Further, it was washed with double distilled water and dried in vacuum for overnight and stored in glass vials for further characterization and applications. A representative pathway for the synthesis of the same has been shown in figure 1.
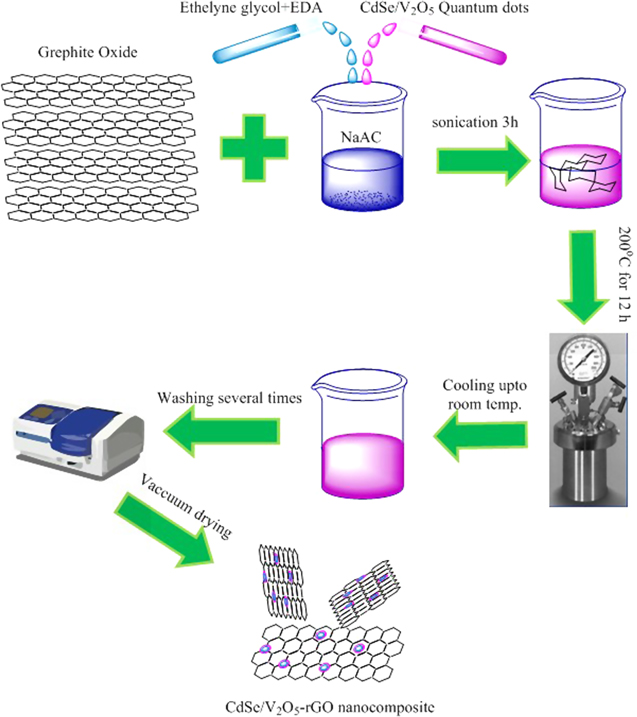
Figure 1. Representative illustration of the synthesis of rGO-V-CdSe nanocomposite.
Download figure:
Standard image High-resolution imageCharacterizations
Crystalline properties of the as-synthesized powder samples were examined on PANalytical x-ray diffractometer using Cu-Kα radiation (λ = 1.5406 Å with tube voltage and current 40 kV and 30 mA, respectively), by scanning through a range 2θ of 15° to 80°. The microstructures of the materials were studied by transmission electron microscope (JEOL 2100 F) with an accelerating voltage of 200 kV. Samples for TEM measurements were prepared by ultrasonically suspending the powder in double distilled water and placing a drop of the suspension on a bare copper grid. Raman spectra were obtained using a micro- Raman spectrometer (Wi-Tec alpha 300 R.A. Raman system) equipped with an argon ion laser (λ = 536 nm) in a wave number range of 500–3000 cm−1 The data were recorded for 10 s for each sample. The surface composition and chemical environment of the as-synthesized samples were studied by x-ray photospectroscopy (XPS). XPS spectra acquisition and imaging were performed on a SPECS system XR 50 (x-ray source Al Kα, 1486.6 eV) equipped Phoibos 150 hemispherical energy analyzer with MCD 9 detector.
Agilent E8362B Vector Network Analyzer was used to study the electromagnetic wave shielding in the frequency range of 8.4–12.0 GHz (X-Band), by the waveguide method. For EMI shielding measurements, powder samples were pelletized in the rectangular form with a dimension of 15 × 8 × 1 mm3 through a hydraulic press at 10 Tons pressure. These pellets were inserted in the internal cavity of a copper sample holder and sandwiched between a two coupling waveguide flanges of the network analyzer. The relative complex permittivities (ε' and ε'') and permeabilities (μ' and μ'') of the as-synthesized samples were estimated from the experimentally obtained scattering parameters S11, S12, etc using the Reflection/Transmission Mu and Epsilon Nicolson–Ross model. All the measurements were carried out at room temperature.
Results and discussions
The structural features of rGO, rGO-CdSe and rGO-V-CdSe nanocomposites were characterized using x-ray diffraction pattern as shown in figure 2. It represents the XRD profile of rGO, exhibiting two diffraction peaks at 24.40° and 42.86° and ascribed to the atomic reflection planes correspond to (002) and (100), respectively. In addition, the peak centered at 24.40°, suggests the presence of disordered stacking of graphene sheets, which owes to the destruction of regular stacking of graphite, during the synthesis. Further, from the XRD profile of rGO-CdSe nanocomposite, we can see the appearance of the peaks approximately at 25.59°, 42.64° and 50.46° ascribed to (111), (220), and (311) atomic reflection planes, respectively. These peaks are indexed well with known Zinc-blende (cubic) structure of the CdSe crystal structure [31]. Moreover, the rGO-V-CdSe nanocomposite spectrum consists of diffraction peaks at 25.55°, 34.52°, 42.98°, 45.30° and 50.24° owing to (101), (102), (110), (200), and (203) planes, respectively and matches well with wurtzite (hexagonal) crystal structure (31). The presence of some additional peaks reveals the phase transformation from Zinc blende to wurtzite with slight surface modification of the surface of CdSe due to the growth of V2O5. Additionally, there is no peak due to V2O5 which rules out the formation of V2O5 individually during the shell formation. It can also be seen that there is an overlap of the prominent peak (002) with (111) peak of rGO-CdSe and with (101) of rGO-V-CdSe and the resultant intensity get enhanced which explicitly confirms the phase formation of rGO-CdSe and rGO-V-CdSe nanocomposites.

Figure 2. XRD patterns of rGO, rGO-CdSe, and rGO-V-CdSe nanocomposite (bottom to top).
Download figure:
Standard image High-resolution imageIn order to get an insight into the morphological aspects and dispersion of QDs over the surface of rGO nanosheets, the transmission electron microscopic studies have been carried out. Figure 3(A) shows the TEM observations of rGO sheets which depict the crumble and rippled structure due to the deformation upon exfoliation and restacking process.
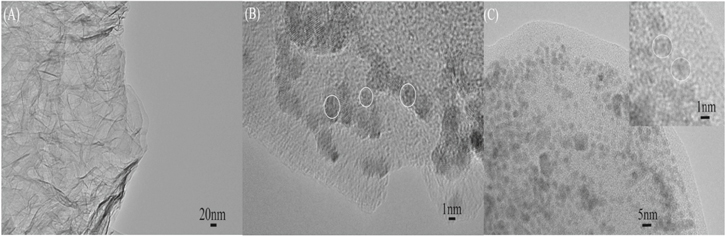
Figure 3. TEM micrographs of (A) rGO, (B) rGO-CdSe and (C) rGO-V-CdSe nanocomposite.
Download figure:
Standard image High-resolution imageFigures 3(B) and (C) represents the typical transmission electron microscopy images narrating the dispersion of CdSe and V-CdSe core/shell QDs, respectively over the surface of rGO sheets. It elaborates CdSe and V-CdSe core/shell QDs to have a spherical shape and almost of uniform sizes having average diameter 3 and 5.5 nm, respectively. It infers that QDs have a very narrow shape/size distribution and get well adhered over the top surface of the rGO sheets.
Figure 4(A) reflects the Raman spectra of the as-synthesized samples, which provide information about the structural features and related changes. As can clearly be seen, there are two significant peaks centered at 1352 cm−1 and 1579 cm−1, corresponding to the D-band and G-band, respectively. The D-band originates from the defect/disorder of the lattice represented by the breathing mode of K-point phonon with A1g symmetry between carbon atoms and the G-band is mainly assigned to in-plane displacement leading to the stretching vibrations of E2g phonon of carbon atoms with sp2 bonding [32, 33]. In addition, it exhibits two more bands at higher wave number, which can be assigned as 2D and D + G bands, revealing the formation of graphene. Henceforth, rGO-CdSe and rGO-V-CdSe nanocomposites exhibit almost all the bands which appeared in the spectra of rGO, as expected. Notably, some additional bands at lower wave numbers of spectra have also been appeared, due to CdSe, in figure 4. The peaks for CdSe have been assigned to 1LO, SM, and 2LO mode of vibrations in accordance to the order of successive increasing wave numbers at 205.68, 279.32 and 408.51 cm−1 in figure 4(B). The peak centered at 205.68 cm−1, assigned as 1LO owes to the vibration of first-order longitudinal optical phonon, whereas the two other peaks at 279.32 cm−1 and 408.51 cm−1 originate due to the contribution from surface phonons and second order longitudinal optical phonon (first overtone LO), respectively [34–36]. The intensity of these peaks has found to be reduced substantially with rGO-V-CdSe nanocomposite. To facilitate the insight of this reduction in intensity, a detailed analysis of a specific region (150–650 cm−1) has been done and presented in figure 4(B). Raman spectra of rGO-V-CdSe composite significantly differ from that of rGO-CdSe nanocomposite. Intensities of longitudinal optical (first and second order, both) have significantly reduced and the signals from surface mode vibrations get vanished. As the CdSe QDs have been covered by V2O5 shell, these optical phonons get modified due to the heterogeneity of CdSe core and V2O5 shell, and result in the reduction of intensity of LO peaks [37]. Moreover, when the surface of CdSe gets wrapped by V2O5 shell, the contribution of phonons from the surface of CdSe QDs is completely screened off and therefore there is no signature of SM phonons in the spectra of the rGO-V-CdSe nanocomposite.

Figure 4. Raman spectra of rGO, rGO-CdSe, and rGO-V-CdSe nanocomposite (bottom to top).
Download figure:
Standard image High-resolution imageFurthermore, the integrated intensity ratio of the D-band to G-band (ID/IG) is assumed as an index to assess the graphitization degree which has greatly affected the dielectric loss of carbon-based materials. The ratio has found to be 0.73, 0.87, and 1.09 for rGO, rGO-CdSe and rGO-V-CdSe nanocomposite, respectively. This successive enhancement in ID/IG ratio clearly indicates more defective nature of QDs-rGO nanocomposite in comparison to rGO.
Figure 5 displays the high-resolution XPS spectra of the as-synthesized samples and the spectra fitted for C, O, V, Cd, and Se. Figure 5(A) depicts wide scan survey intensity over a function of binding energy for the rGO-V-CdSe sample in the range 0–800 eV. The deconvoluted peaks at 285, 532 and 402 eV, respectively, ascribed to C, O, and Cd, confirm them as the major constituents of the nanocomposite. Analysis of deconvoluted peaks of C1s (figure 5(B)) demonstrates that this peak (C1s) can be fitted into three peaks at positions 285.1, 286.9 and 288.1 eV and further assigned as C–C/C=C, C–O–C/C–O and C=O atom configurations, respectively [38].
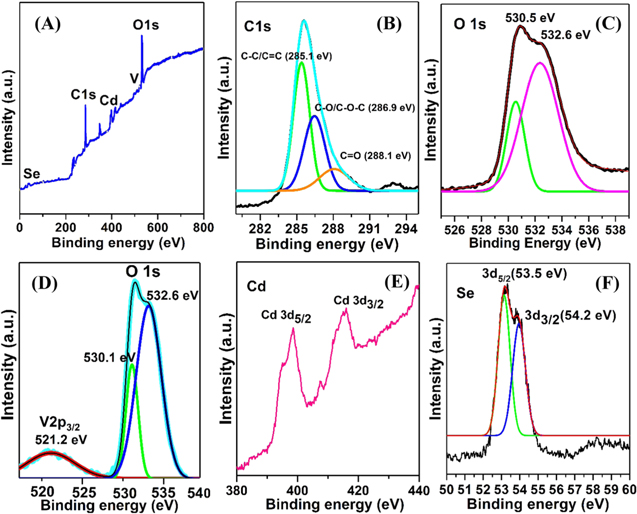
Figure 5. XPS spectra of the rGO-V-CdSe nanocomposite.
Download figure:
Standard image High-resolution imageInterestingly, the intensities of peaks corresponding to C–O–C and C=O bonding are quite low as compared to C–C bonded carbon atoms configuration which confirms the removal of oxygen from graphite oxide and the transformation of GO into rGO after solvothermal treatment [39]. The removal of the oxygen further produces defects and creates polarization centers for improved EMI shielding application of this material. Figure 5(C) represents the deconvoluted spectra of O1s, which exhibits two split peaks originated from different chemical bonding of oxygen atoms. Peaks centered at 530.5 and 532.6 eV, owe to V–O–V bonded atoms in V2O5 [40] and C=O/O–C=O configuration in rGO, respectively [41]. Figure 5(D) represents the combined spectra of V (v) and O confirming the formation of V2O5. 2p3/2 peak has its usual position at 521.2 eV with the deconvoluted peak of oxygen at 530.5 eV as reported in literature [42]. Figure 5(e) exhibits the doublet at 402.3 eV and 412.0 eV, correspond to Cd3d5/2 and Cd3d3/2, respectively [43, 44]. Figure 5(f) exemplifies the Se3d region of the CdSe QDs has a doublet with peaks at 53.5 eV (Se3d5/2) and 54.1 eV (Se3d3/2) which is typical for selenium in metal selenides [43]. Besides, the absence of some additional 3d peaks of Se–O in the range of 58–60 eV confirms that the surface of CdSe has completely been passivated by the V2O5 and rules out the formation of oxides of Se or Cd.
To demonstrate the potential of the as-synthesized samples for EMI shielding, the EMI SE and shielding mechanism of the composite have been investigated and discussed.
Figure 6 displays the frequency dependence of the real and imaginary parts of complex permittivity of all the three as-synthesized samples. It is clear that the real part of complex permittivity has a very high value (average ε' ∼ 70) for rGO-V-CdSe nanocomposite as compared to the other two synthesized samples. This high ε' can be ascribed to the increased conductivity of the rGO-V-CdSe nanocomposite due to electron transfer between rGO and CdSe/V2O5 core–shell interface. To understand the mechanism of charge generation in CdSe/V2O5 core–shell heterostructure, various experiments have been performed elsewhere (not discussed here) [45]. Basically, CdSe/V2O5 core–shell heterostructure is a quasi-type II system in which electronic wave function is delocalized towards surrounding core–shell and hole confined into the core due to their isotropic strain and bulk band alignment [46, 47]. The lattice mismatch between CdSe core and V2O5 and thus the band alignment results in a charge separation of electrons and holes of core [48]. Figure 7(A) depicts the band structure of CdSe core and V2O5 shell, n-type semiconductors, having a band gap of 1.7 and 2.8 eV, respectively. It is apparent from the band structure that conduction band of V2O5 lies very close to the valence band of CdSe core and therefore, the valence electron generated from the charge separation of electrons and holes, migrates to the conduction band of V2O5 shell. At the interface of the core–shell heterostructure, a potential barrier gets established, which prevents the redistribution of electrons to the core. This process enhances the carrier concentration and mobility which automatically results in the improved conductivity. The charge transfer process in core–shell takes place very fast and as it is known that graphene, being an excellent sink for electrons, easily captures electrons. Graphene possesses a linear dispersion relation at K-Point of the Brillion zone and provides quasi-relativistic velocity to the electron to move in 2D sheet [49, 50]. This complex mechanism of generation of charges at the interface of V-CdSe core–shell and capture of electrons by rGO provide a boost to the conductivity of the rGO-V-CdSe nanocomposite, which results in enhanced permittivity (ε'). The real part of permittivity defines the storage of electric energy and so a higher value of ε' makes the materials viable for excellent EMI shielding. The imaginary part represents the dissipation capabilities of electric energy, and according to the Debye theory [51], it can be expressed as

where  defines the static permittivity
  describes the relative permittivity, σ, ω and τ are the conductivity, angular frequency and polarization relaxation time, respectively.

Figure 6. Variation of (A) real permittivity (B) imaginary permittivity and (C) Dielectric loss with Frequency.
Download figure:
Standard image High-resolution image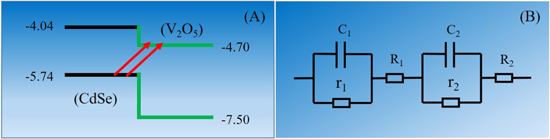
Figure 7. (A) Energy levels of CdSe and V2O5 (B) equivalent impedance of multi heterostructure.
Download figure:
Standard image High-resolution imageThe imaginary part of permittivity i.e. dielectric loss consists of both polarization loss and the conductivity loss of the material. Graphene provides a conducting pathway to the electrons generated through charge separation mechanism in V-CdSe core/shell heterostructure, as discussed above, and thus lead ε'' to have a high value for rGO-V-CdSe nanocomposite.
Furthermore, the polarizations include the interfacial polarization caused due to the interfaces of V2O5 shell with CdSe core and rGO with V-CdSe core–shell QDs, as well as the dipole polarization caused by the functional groups and defects on the surface of rGO. Moreover, dipoles are not evenly distributed on the network of rGO and are indexed to the orientational polarization leading to relaxation loss in the electromagnetic field. When EM waves fall on the rGO-V-CdSe nanocomposite, there also arises heterojunction capacitance due to the interfaces between rGO and CdSe/V2O5 core–shell QDs. The equivalent circuit scheme at the interfaces has been shown in figure 7(b). In view of this, the complex permittivity can be rewritten as [52]

Here, C0 represents heterostructure capacitance with empty space and Z* defines the complex impedance of the nanocomposite.
Further, R1 and R2 represent the equivalent resistance of V2O5/CdSe QDs and rGO with quantum dot heterostructures, r1 and r2 are the resistances due to the dipoles at the interfaces of the heterostructures and C1 and C2 denote equivalent capacitances at the heterostructures. The equivalent impedance can be represented as

The heterojunction capacitance generated at the interfaces contributes to the polarization in the electromagnetic field and infers the resonating behavior of complex permittivity for rGO-V-CdSe nanocomposite. These interfaces play a vital role in producing interfacial polarization leading to high ε''. So the conductivity and relaxation have a synergistic effect on the imaginary permittivity and high value of ε'' refers to a better dielectric loss mechanism by the as-synthesized nanocomposite [53, 54].
A common understanding of magnetic loss tells that it is a result of exchange resonance, natural resonance and eddy current effect [55]. A careful observation of figures 8(A) and (B) demonstrates that the real permeability for rGO-V-CdSe nanocomposite is minimum whereas imaginary permeability has a maximum value at the same frequency. This infers that rGO-V-CdSe nanocomposite has high dielectric loss due to which impedance matching characteristic of nanocomposite gets improved and results in better EMI shielding characteristics.
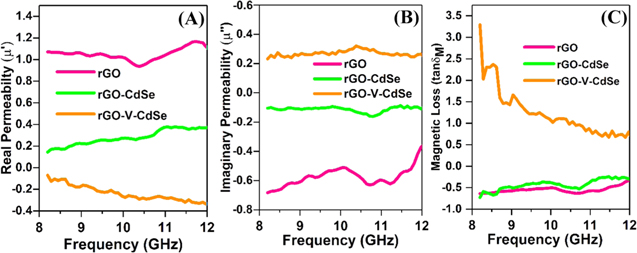
Figure 8. Variation of (A) real permittivity (B) imaginary permittivity (C) magnetic loss with frequency.
Download figure:
Standard image High-resolution imageIn order to elucidate the EMI shielding performance of as-synthesized nanocomposites, scattering parameters, S11, S12, S21 and S22 have been obtained to evaluate reflection (R), absorption (A) and transmission (T) coefficients, through a two-port vector network analyzer in the X-band frequency range.
The shielding effectiveness of the material is usually defined as the logarithmic of output to the input power ratio and given as

Here, PI and PT define the incident power and transmitted power, respectively. It is well known fact that the attenuation of electromagnetic waves occurs by three different mechanisms; reflection, absorption and multiple reflections, so the total shielding effectiveness SET is cumulative of all the three terms and can be reconstructed as

SEA, SER, and SEM represent the contribution of absorption, reflection and multiple reflections, respectively, in total shielding effectiveness (SET). SEA is primarily related to the conductivity of shielding materials whereas SER arises due to impedance matching characteristics of material. When EM waves incident on two or more interfaces of the shielding material, it dissipates energy. This dissipation of energy at the interfaces of materials is primarily responsible for the origin of SEM. If the sample is thick enough to overcome skin depth, the contribution due to multiple reflections must be shrugged off [56] and equation (5) turns as

In addition, the expression for reflectance (R) and transmission (T) coefficients can be written as


whereas

As we know, if the major contribution in total shielding effectiveness (SET) is due to SEA, multiple reflection terms become negligibly small and hence effective absorbance can be expressed as

If an electromagnetic wave falls on the surface of a conducting material and penetrates only the near surface section of the material, the phenomenon is known as skin effect and it is defined as the distance to which the intensity of transmitted EM wave reduced to (1/e) factor of the incident EM radiation. Shielding effectiveness due to absorption is related to the skin effect by the equation [57].
and

where ω defines the angular frequency (2πf) of EM wave, σ represents a.c. conductivity and δ is the skin depth. The a.c. conductivity σ is related to the dielectric response of materials as 
The frequency dependency on various scattering parameters SER, SEA and SET for as-synthesized samples has been shown in figure 9. It shows that bare rGO has the lowest SER value among all the three samples under consideration and oscillates between 6 and 7 dB over the entire frequency range. The SER for rGO-V-CdSe nanocomposite is less than that for rGO-CdSe nanocomposite. It signifies that shielding through reflection has less contribution in total shielding as compared to shielding due to absorption in the rGO-V-CdSe nanocomposite, which makes it a suitable candidate for the stealth technology.
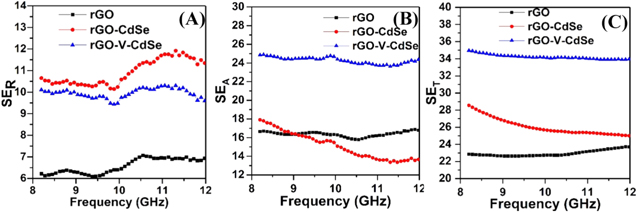
Figure 9. Variation of (A) SER, (B) SEA and (C) SET, as a function of frequency.
Download figure:
Standard image High-resolution imageFigure 9(B) represents the dependence of the SEA on the frequency in the GHz range. It is apparent that the average SEA for rGO and rGO-V-CdSe nanocomposites has the values around 16 dB and 25 dB, respectively and remain almost constant over the entire frequency spectrum. However, SEA for rGO-CdSe composite decreases with frequency changes to a higher side and has the minimum value of 14 dB. It is evident that there is a huge difference in SEA value for rGO-CdSe and rGO-V-CdSe nanocomposite, which is related to their permittivity behaviors. Apparently, we can see that there is a sufficiently large difference in ε' and ε'' values of these materials. Since ε' is directly related to the dielectric loss of the materials, a high value of the same provides better dielectric loss properties to the rGO-V-CdSe nanocomposite. Further, contribution to the dielectric loss is also because of the additional interfaces generated due to the core/shell heterostructure, provides more interfacial polarization and improved dielectric loss.
Figure 9(C) displays the variation of SET, total sum of SER and SEA, of rGO-V-CdSe nanocomposite and shows excellent shielding effectiveness as compared to rGO and rGO-CdSe nanocomposites. Further, it can be analyzed from the graphs that the main contribution in total shielding is due to absorption rather than reflection. Presence of CdSe/V2O5 heterostructure over the surface of rGO produces strong skin effect and can be seen from the figure 10(A). The index of skin depth is almost constant for rGO and rGO-V-CdSe nanocomposite with an average value of 0.52 mm and 0.22 mm, respectively. However, for rGO-CdSe nanocomposite has an increasing trend and possesses the values 0.49 mm and 0.64 mm, respectively at both the extreme ends of the frequency. Enhanced dipolar and interfacial polarization along with cross-linking makes it possible for rGO-V-CdSe nanocomposite to possess such a low value [58].

Figure 10. Variation of (A) skin depth, (B) a.c. conductivity with frequency.
Download figure:
Standard image High-resolution imageLow skin depth for rGO-V-CdSe nanocomposite has significant technological advantage over the other as-synthesized samples since it allows EM to penetrate up to such a short distance and persuade wave to lose its energy significantly on the surface and therefore, the possibility of reflection and multiple reflections could be minimized. Further, the conductivity of rGO-V-CdSe nanocomposite is very high as compared to the other as-synthesized samples and hence contributes to better EMI shielding characteristics.
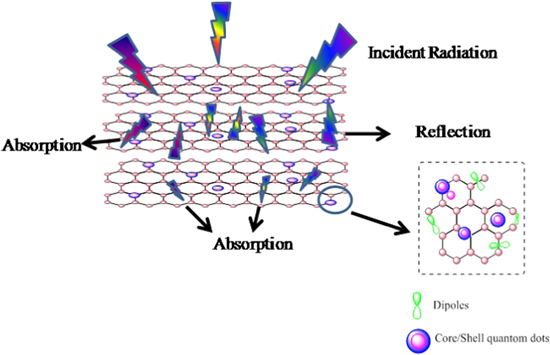
The above-mentioned discussion dealing with the enhanced EM wave shielding performance of rGO-V-CdSe core–shell nanocomposite can be perceived easily by the aspect illustrated in the figure 11. The synergistic effect of conductivity and relaxation loss arising due to the conductive path provided by rGO and dipoles due to different reasons, respectively, endows the nanocomposite with high dielectric loss. The relaxation loss appears due to dipolar polarization arises due to several functional groups and defects in rGO and interfacial polarizations because of heterojunction capacitances at abundant interfaces arising due to different heterostructures. The interfacial polarization and interconnection of the nanocomposite material, also lead to a decrease of the skin depth, which modifies the permittivity and shows strong ability to absorb EM waves.
Figure 11. A schematic illustration of EMI shielding mechanism.
Download figure:
Standard image High-resolution image
Conclusion
In summary, this study shows that CdSe-V-rGO nanocomposite based on core–shell quantum dots have been fabricated successfully by a simplistic solvothermal route. The structural and morphological aspects have been analyzed by XRD, TEM and Raman spectroscopy. The surface composition and chemical environment of the as-synthesized sample have been studied by x-ray photospectroscopy. The as-synthesized nanocomposite clearly demonstrates the growth of core–shell interfaces with rGO nanosheets, favors the creation of an excellent EM absorber. The CdSe-V2O5 core–shell QDs on rGO surfaces have a notable impression on the EMI shielding properties and possess shielding effectiveness as total shielding effectiveness with an average of 38 dB. rGO-V-CdSe nanocomposite shows higher EMI shielding values as compared to pristine rGO NSs and rGO-CdSe nanocomposite. The presence of CdSe-V2O5 heterostructure over the surface of rGO NSs produces strong skin effect which remains almost constant with an average value of 0.22 mm. Low skin depth has significant technological advantages; therefore the possibility of multiple reflections could be minimized. Further, it has been analyzed that the main contribution in total shielding is due to absorption rather than reflection.
The results exemplify that the nanocomposite rGO-V-CdSe exhibits excellent EMI shielding properties in a frequency range 8.4–12.0 GHz and henceforth, has a prospect as a new type of EMI shielding material to be used in X-band frequency range for various applications.
Acknowledgments
Authors are thankful to AIRF-JNU for TEM and Raman studies. AKS recognizes CNPq Brazil and UGC India for providing research fellowship in the form of PDF.
Declaration
Authors declare no competing interest.