

Abstract
A method for fabricating surface-enhanced Raman scattering (SERS)-active substrates by immersion deposition of silver on a macroporous silicon (macro-PS) template with pore diameters and depth ranging from 500–1000 nm is developed. The procedure for the formation of nanostructured silver films in the layers of macro-PS was optimized. Silver particles of dimensions in the nano- and submicron-scale were formed on the external surface of the macro-PS immersed in the water–ethanol solution of AgNO3, while the inner pore walls were covered by smaller, 10–30 nm diameter, silver nanoparticles. Upon introducing the hydrofluoric acid to the reaction mixture, the size of nanoparticles grown on the pore walls increased up to 100–150 nm. Such nanostructures were found to yield SERS-signal intensities from CuTMpyP4 analyte molecules of the same order to those obtained from silvered mesoporous silicon reported previously. The tested storage stability for the silvered macro-PS-based samples reached up to 8 months. However, degradation of the SERS intensity under illumination by the laser beam during spectral measurements was observed. To improve the stability of the SERS-signal a hybrid structure involving graphene oxide deposited on the top of analyte molecules adsorbed on the Ag/macro-PS was formed. A systematic observation of the time evolution of the characteristic peak at 1365 cm−1 showed that the addition of the oxidized graphene layer over the analyte results in ∼2 times slower decay of the Raman intensity, indicating that the graphene coating can be used to enhance the stability of the SERS-signal from the CuTMpyP4 molecules.
Export citation and abstract BibTeX RIS
1. Introduction
Surface-enhanced Raman scattering (SERS) is of great interest since it is an extremely sensitive technique for wide applications in analytical chemistry, environmental monitoring, biomedicine, etc [1–4]. The most significant enhancement of Raman signal takes a place for analyte molecules located in the 2–10 nm gaps between nanostructures of the noble metals so-called 'hot spots', where local light field strength can exceed the incident field by many orders of magnitude [5–7]. The engineering of inexpensive nanostructures for SERS with advanced properties, such as high sensitivity and long-term stability remains an important task for experimentalists.
Silver nanostructures are the most widespread SERS-active substrates because of their superior Raman signal enhancement in comparison to other noble metals when excited in the visible region. Among them nanocomposites based on silver coated porous silicon (PS) have been of intensive interest for more than a decade due to high SERS-activity while being easy to manufacture [8, 9]. The PS is an attractive template for SERS substrate preparation due to several reasons: developed surface area contributed by both its external and internal surfaces, the pore diameter and depth can be readily controlled by the regimes of PS fabrication covering ranges of micro-, meso- and macroporous materials [10]. Microporous silicon represents highly porous silicon sponges in which the pores are less than 2 nm in diameter. Mesoporous silicon (meso-PS) is characterized by its 2–50 nm pore diameter while its porosity (the fraction of voids in the layer) can reach 85%–90%. The pore diameter of macroporous silicon (macro-PS) varies in the range of several microns. The feature of this material is in the parallel cylindrical pores which are well-ordered. The porosity of macroporous silicon is rather low and typically does not exceed 20%.
Mesoporous silicon is the first material that was used to obtain SERS-active substrates by silver deposition on the internal surface of meso-pores by thermal decomposition method [8]. In this method, meso-PS was soaked in a silver nitrate solution after exposure to a procedure of plasma oxidation to prevent the spontaneous immersion coating of the silicon surface. The excess of the AgNO3 solution was removed from the pores and the sample was then dried. Finally, the silver nitrate was thermally decomposed to silver metal and gases.
Later the attention was directed to the formation of silver nanostructures on the external surface of meso-PS by the immersion plating method [9]. Immersion deposition occupies a special place among the wet metal deposition techniques as it allows the formation of metallic nanoparticles on the substrate without applying external potential or additional reducing agents. The works of Giorgis et al [11–13], our team [14–16] and other groups [17–20] reported fabrication of quasi-ordered silver nanoarrays over meso-pores which demonstrated a high level of SERS-activity and the detection limits down to 10−15 M. Several studies of the SERS-active gold nanostructures deposited on the surface of meso-PS have also been reported [21, 22].
It should be noted that in almost all the cases mentioned above for meso-PS the metal deposition occurred on the top of the porous layer occluding the pores. At the same time, there was an intention to increase SERS-activity through contributions of both external and internal surfaces of PS. For this purpose, a suitable template is macroporous silicon. Several authors reported macro-PS based plasmonic structures for the generation of SERS-signal [23–26]. For example, sputtered gold nanoparticles (NPs) provided micromolar limit of detection for thiol molecules [23]. Gold nanothorns grown on macro-PS by the reduction from Au chloride solution were shown to demonstrate femtomolar detection limit of crystal violet [24]. The same order of detection limit of rhodamine 6G was achieved with the tightly packed film of Ag NPs [25]. Original SERS substrate was prepared by Kosović et al [27] from silvered macro–mesoporous silicon templates. They showed high SERS sensitivity that enabled ultralow concentration detection of R6G dye molecules down to 10−15 M. It should be noted that the thickness of the macroporous layer in the above-mentioned studies was several times more than the pore diameters. Thus, authors considered SERS-activity contributed only by the metallic nanostructures on the external surface of macro-PS.
In this paper, we develop the method of immersion deposition of silver NPs on the walls of macropores. In principle such kind of silvered macro-PS can be considered as a system of nanovoids ('antinanoparticles' [28]). Metallic nanovoids are of interest for SERS-spectroscopy because in contrast to NPs they provide an additional enhancement of Raman signal due to localized plasmon mode of strong rim component around the nanovoid mouth and contributions from the multiple reflections inside the voids [29]. Such nanovoids should have 0.5–2 μm diameter and can be formed by several techniques, such as the nanosphere lithography [30], its combination with additional processing steps [31–33], silver films deposition on the alumina protrusion arrays [34] and other.
We propose an approach for the simple and cheap formation of plasmonic structures on the surface and into the pores of macro-PS, including etching of macropores in silicon wafers followed by immersion deposition of silver films onto the macro-PS surface. This work was initiated in [35] but we were not successful in complete pore walls covering with silver NPs at the experimental conditions used. However in the current study we optimized the regimes of silver deposition by varying the composition of the reaction mixture that allowed covering not only external surface between macropores but pore walls. The SERS-activity of the obtained silver nanostructures was tested with cationic water-soluble porphyrin CuTMPyP4 molecules and compared with the results for substrates based on the silvered meso-PS reported before [15].
Moreover we have modified Ag/macro-PS structures with thin 2D graphene oxide (GO) protective films and studied their SERS intensity behavior. While providing an excellent electromagnetic enhancement factor, some plasmonic materials (e.g. silver) are known to be chemically unstable, easily oxidizing and degrading in time, thus influencing adversely the performance of optical devices. The stability of the plasmonic nanostructures can be improved by adding a layer of graphene over the metal deposit. Experimental results suggest that the thin inert graphene layer can be used as a shield to gases, liquid and other corrosive agents. Recently Kravets et al showed that coating of graphene over copper and silver can protect them against oxidation and degradation [36]. In the work [37] the stability in air of devices constituted by gold and silver thin films was enhanced or by the thin layer of graphene over the plasmonic nanostructure.
Due to the volatility of the silver surface, various physical or chemical changes may occur at the metal-dielectric or metal-analyte interface, especially when illuminated by a laser beam, leading to the loss of the SERS-signal intensity. It is suggested that graphene-containing layers can also protect analyte molecules from photo-induced damage. Recently the significant role of graphene in improving the stability of the SERS substrate, either in storage or usage, has been demonstrated [38–40]. In the current work composite structures GO/CuTMPyP4/Ag/macro-PS and GO/CuTMPyP4/GO/Ag/macro-PS were fabricated and the influence of graphene oxide on the SERS performance has been studied using micro-Raman system at high power density of laser illumination. The time evolution of the characteristic peak for CuTMPyP4 at 1365 cm−1 showed that the layer of oxidized graphene over the analyte molecules results in nearly two times increase of the SERS-signal stability.
2. Experimental
2.1. Chemicals and synthesis of the oxidized graphene
All chemicals (silver nitrate AgNO3 (99.9999%), hydrofluoric acid HF (45%) and hydrochloric acid HCl, ethanol C2H5OH, hydrogen peroxide H2O2, ammonium hydroxide solution NH4OH, dimethyl sulfoxide DMSO) were purchased from Sigma-Aldrich Co. and used without additional purification. To synthesize graphene nanoparticles, artificial graphite produced by Alfa Aesar with a particle size of 7–11 µm was used. Distilled water was used for preparation of all solutions.
Oxidized graphene was prepared using a modified procedure of Hummers [41] by chemical oxidation of synthetic graphite in three stages. At the first stage the pre-oxidized graphene was formed. Then graphene samples obtained were oxidized. At the third stage GO was isolated from the synthesis medium. Using the method of dynamic light scattering with the Zetasizer Nano SZ90 (Malvern Panalytical Ltd, UK), the average GO particle size is found to be around 130 nm.
2.2. Fabrication of porous silicon
Monocrystalline p-type silicon wafers of 12 Ω cm resistivity and (100) orientation (JSC 'Integral', Belarus) were used as initial substrates. They were cut from the silicon ingot fabricated by the Czochralski method. Prior to macro-PS formation the wafers were cleaned in a solution of NH4OH, H2O2 and H2O mixed in a volume ratio of 1:1:4. The native SiO2 layer was removed from wafers by rinsing in 4.5% HF solution. The front face of the silicon wafers was then rendered porous to a depth of 1 μm by an electrochemical anodization in a solution of HF (45%) and DMSO mixed at the 10:46 volume ratio. The potentiostat/galvanostat AUTOLAB PGSTAT302n (Metrohm Autolab B.V., Netherlands) was used to provide anodization at galvanostatic regime at a current density of 8 mA cm−2. After anodization the wafers were rinsed with deionized water and spun dry. With the above procedure macroporous silicon of pore diameters and depth varied from 0.5 to 1 μm was obtained. Meso-PS samples were formed in the same manner as it was reported elsewhere [15].
2.3. Silver deposition on porous silicon
Silver was deposited on the meso- and macro-PS by immersion technique. Freshly etched meso-PS samples were immersed in a 3 mM AgNO3 solution in distilled water with dipping time from 10 to 60 min. The procedure of silver deposition on macro-PS was optimized by varying composition of solution (content of water, ethanol, hydrofluoric acid, AgNO3) and reaction duration for 20–200 min. The silvered PS samples were rinsed with deionized water and then air-dried. After that the wafers were diced into rectangular samples with the 0.75 cm2 surface area. To eliminate contaminants adsorbed on the high surface area of the Ag film, which give rise to strong SERS background, Ag NPs substrates were rinsed out in the 10 mM HCl solution for several seconds.
2.4. Preparation of samples for SERS
The SERS-activity of the silvered PS was studied using water-soluble cationic Cu(II)-tetrakis(4-N-methylpyridyl) porphyrin (CuTMpyP4). The samples for SERS measurements were prepared in two ways. In the first case silvered PS samples were incubated for two hours in the aqueous solution of 10−6 M CuTMpyP4. The GO-based composites were obtained by drop casting procedure: GO/CuTMPyP4/Ag NPs/macro-PS sample was precipitated from 40 μl of a drop of the CuTMpyP4 solution onto a silvered surface of macro-PS plate with the surface area ∼40 mm2 and allowed to air-dry, then 40 μl GO solution was added and dried. In the case of GO/CuTMPyP4/GO/Ag NPs/macro-PS composite an additional procedure of 40 μl GO drop casting preceded the CuTMPyP4 deposition.
To study the storage stability of the silvered macro-PS each sample with analyte was placed in a plastic zipper bag and kept at 21 °C for 1, 3 and 8 months. The air was sucked out of the bag before zipping.
2.5. Measurements
The morphology of the samples was studied by the scanning electron microscope (SEM) S-4800 (Hitachi High-Technologies Corporation, Japan) that provided 1 nm resolution.
SERS spectra of CuTMPyP4/AgNPs/macro-PS samples were recorded with a 90° scattering geometry by using DM160-MS3504I (Solar TII, Belarus) spectrometer equipped with a CCD detector SPEC10:256E (Roper Scientific, USA) cooled down to 153 K with liquid nitrogen. Wavelength of 441.6 nm was provided by He–Cd laser (JSC ≪PLASMA≫, Russia). The laser power used was typically of 8 ÷ 10 mW.
Measurements of the SERS spectra kinetics for GO-based composites were carried out by using a scanning probe Raman microscope 'NanoFlex' (Solar LS, Belarus). The source of excitation at 488.0 nm was an argon laser (Melles Griot, USA). Excitation and registration of Raman scattering was carried out through 100× objective with CCD camera Newton 970 EMCCD DU970P-BV (Andor Technology Ltd, UK).
3. Results and discussion
3.1. Morphology of the silver nanostructures
In the present work, we used anodizing regimes that provided formation of the macro-PS layers with pore diameters and depth varying in the range of 0.5–1 μm. Such dimensions are typical for the SERS-active nanovoids obtained by the traditional nanoengineering techniques [29, 42]. To form silver films on internal surface of PS as well as on the walls of macropores with suitable parameters, we carried out the immersion plating in the water–ethanol AgNO3 solutions without of HF and in its presence gradually increasing the deposition time from 20 up to 200 min.
3.1.1. Water–ethanol (1:1) 1 mM AgNO3 solution
The typical morphology of three samples of macro-PS formed at the Ag deposition times of 40, 120 and 200 min is shown in figure 1. SEM images for the same Ag/macro-PS samples obtained at lower magnification are shown in figure S1 in the supporting information, which is available online at stacks.iop.org/NANO/29/395708/mmedia. These samples were chosen since they demonstrated quite different SERS-activity. A top view images (figures 1(a), (c) and (e)) show that silver particles of nano- and submicron sizes are observed on the silicon surface between pores while they are hardly recognized on the pore walls. Cross-sectional SEM images (figures 1(b), (d) and (f)) clearly show that pore walls are also covered with Ag particles but their sizes belong to the nanoscaled range. An increase in silver deposition time led to the growth of the external silver NPs size while internal particles remained with nearly the same diameter (figures 1(c)–(f)). This is proved by size distribution histograms of silver particles presented in figure 2. The external surface of the macro-PS after 40 min deposition is covered with Ag particles of diameters ranging from a few to 80 nm where NPs smaller than 20 nm are prevalent. Immersion for 120 min led to an increase of Ag NPs diameters on the external surface of macro-PS up to 140 nm and shift of the prevalent size range to 20–40 nm. Further deposition resulted in bimodal size distribution of Ag NPs to the nanometer (less than 100 nm) and submicron (140–200 nm) ranges. The dominated sizes of Ag NPs were between a few to 20 nm.
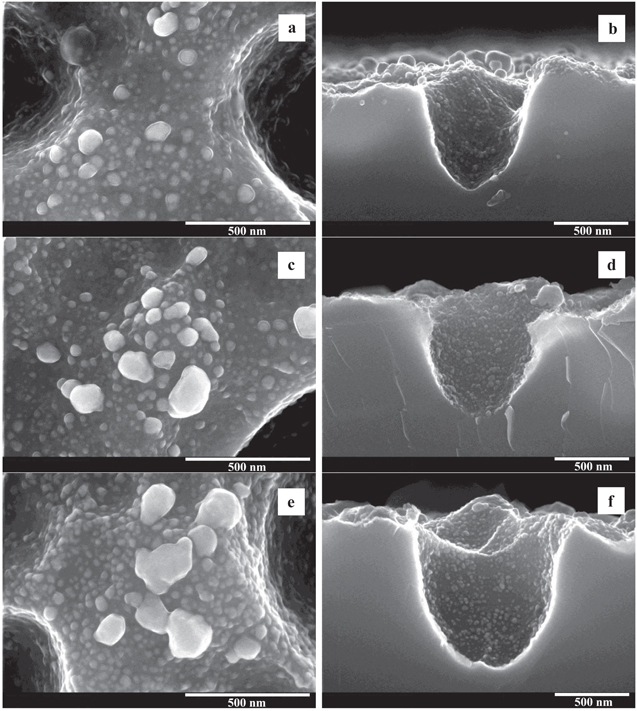
Figure 1. SEM images of (a), (c), (e) top and (b), (d), (f) cross-sectional views of the Ag/macro-PS samples formed by the silver immersion deposition from water–ethanol solution of 1 mM AgNO3 for 40 (a), (b), 120 (c), (d) and 200 (e), (f) min.
Download figure:
Standard image High-resolution image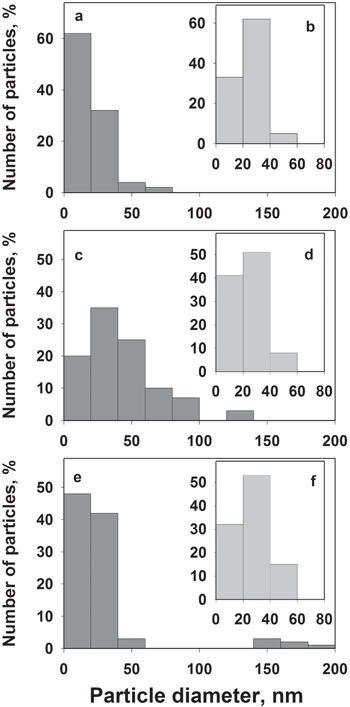
Figure 2. Size distribution histograms of Ag NPs on the silicon surface between the macropores (a), (c), (e) and on the internal surface of the macropores (b), (d), (f). Silver was deposited from water–ethanol solution of 1 mM AgNO3 for 40 (a), (b), 120 (c), (d) and 200 min (e), (f).
Download figure:
Standard image High-resolution imageThe evaluation of Ag NPs density on the external and internal surfaces of macro-PS showed that the number of external particles deposited for 40 min is maximal and reaches 6 × 1010 cm−2, while density of the internal NPs is twice less (3.3 × 1010 cm−2). The last value is roughly saved for the both external and internal surfaces for the samples formed for 200 min when bimodal size distribution of the Ag particles takes a place. Almost twofold decrease in the whole number of NPs can be due to the coalescence of the initially growth nanoparticles. This also results in the extension of the size range to submicron-scale and its splitting to the bimodal view.
Therefore, with increase of the deposition time Ag NPs continue to coalesce while the reopened silicon surface is covered with newly nucleated particles. Therefore, with increase of the deposition time Ag NPs continue to coalesce while the reopened silicon surface is covered with newly nucleated particles. This kind of process is typical for the following conditions: (i) a flat substrate, (ii) significant mismatch of the lattice parameters of the substrate and depositing material and (iii) weak wetting of the substrate with the depositing material [43]. Indeed, the surface between pores is flat enough and the difference in the lattice parameters of the silicon and silver is of 25%. Moreover, the wetting of the substrate decreases due to oxidation of the silicon surface during the silver deposition procedure [44].
On the other hand, the sizes of Ag NPs on the pore walls are approximately constant for all stages of deposition and particles of 20–40 nm diameters are dominated (figures 2(b), (d) and (f)). The number of the internal Ag NPs was not significantly changed during the deposition process. It is also observed that an amount of silver on the pore walls is smaller than that outside the pores because the thin mesoporous layer is quickly oxidized during Ag deposition limiting supply of electrons to the silver ions for their further reduction.
We obtained the samples Ag/macro-PS by silver immersion deposition during different time using solution with concentration of 10 mM of AgNO3 without HF. The SEM images of the samples obtained for 5, 15 and 45 min are shown in figure S2. It can be seen that even higher silver nitrate concentration in comparison to above discussed case (1 mM of AgNO3) does not result in silver deposition into macropores.
3.1.2. Water–ethanol mixture with addition of hydrofluoric acid
It is known that the presence of HF in the reaction solution in which silver precipitation takes place promotes the growth of silver NPs on the silicon surface [45]. The influence of the concentration of HF on the deposition rate, the shape of silver particles and their dimensions was studied in [46]. It was shown that the higher the concentration of HF, the faster silver deposition occurs, and the larger the average diameter the silver particles will have.
Therefore, we have decided to add hydrofluoric acid to the reaction solution for the immersion plating of silver into macropores. Thus the macro-PS samples were immersed in the mixture of deionized water, 1 M ethanol and 0.5 M HF. Moreover, a higher (in comparison with water–ethanol solution) concentration of AgNO3 equal to 10 mM was used. Figure 3 shows SEM images of the Ag/macro-PS samples formed for 15, 25 and 35 min. SEM images for the same samples obtained at lower magnification are shown in figure 3S in supporting information. These samples demonstrated minimum/maximum/minimum SERS-activity, respectively (see below SERS data which are shown in figure 6(D) and section 3.2). When samples of macro-PS impregnated in silver nitrate solution for 15 min the external surface was covered with nanostructured silver film of densely close-packed particles with a diameter of 100–700 nm, i.e., almost comparable to the pore diameter. At the same time, the mouths of the pores remained open. The shape of Ag NPs is irregular. Evidently it is impossible evaluate their density on the Si surface cause Ag NPs are layered on each other. There are individual particles with an average size of 200 nm on the pore walls. With increasing deposition time to 25 and 35 min much bigger silver NPs with broad size distribution and irregular shapes on the interpore surface are formed (figures 3(c)–(f)). In most cases the particles are partially coalesced, forming a fractal-like network of large islands of silver reaching sizes up to 1–1.5 μm. The number and size of silver particles inside the pores slightly increased. As can be seen from cross-sectional image for the sample obtained in 35 min, a fairly uniform film of silver particles with a diameter of about 200 nm is formed on the walls of the pores.
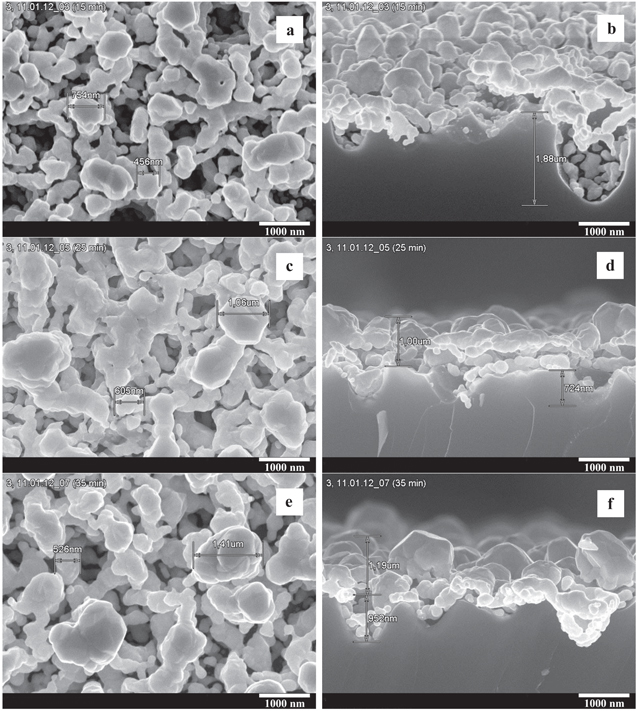
Figure 3. Plain view SEM (a), (c), (e) top and (b), (d), (f) cross-sectional images of the Ag/macro-PS samples formed by the silver immersion deposition for 15 (a), (b), 25 (c), (d) and 35 min (e), (f) in water–ethanol-HF solution of AgNO3 at 10 mM concentration.
Download figure:
Standard image High-resolution imageThus, the addition of hydrofluoric acid into reaction solution greatly effects the process of silver deposition on macro-PS that manifests itself in accelerating of the deposition speed and increasing the size and density of the Ag NPs, in particular in the formation of silver film on the pore walls, i.e. the particles decorate the inner surface of the pores in contrast to the HF-free solution.
3.2. SERS-activity of the silvered macro-PS
We examined Ag coated macro-PS samples for their SERS-activity using chromophore CuTMpyP4 with characteristic Raman spectrum at the concentration 10−6 M. The excitation wavelength was 441.6 nm, which is highly suitable for measurements since both porphyrin absorption and plasmon extinction of silver substrate are in resonance. This can be seen from figure 4 where a typical reflection spectrum of the Ag/macro-PS sample formed by the silver immersion deposition in AgNO3 solution is characterized by a broad dip around 410 nm which can be ascribed to surface plasmon resonance of Ag NPs. The dip is broadened due to the particle polydispersity covering the excitation range. The excitation wavelength (441.6 nm), indicated by the dashed arrow, is seen to match the intense 425 nm Soret band of the CuTMpyP4 absorption spectrum. The significance of the Ag NPs plasmon resonance for the observed SERS-activity is demonstrated by the fact that no Raman signal was observed for flat silicon wafers soaked in the 10−6 M solution of CuTMpyP4, while all silvered macro-PS samples exhibited SERS-activity.
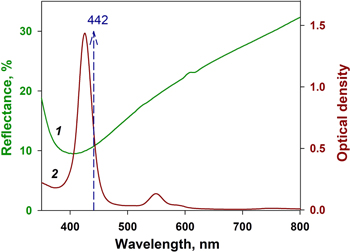
Figure 4. Reflection spectrum of the Ag/macro-PS sample formed by the silver immersion deposition for 25 min) in water–ethanol-HF solution of AgNO3 at 1 mM concentration (1), absorption spectrum of CuTMpyP4 in water solution (2).
Download figure:
Standard image High-resolution imageIt is important that for a correct measurement of the spectral intensities it is necessary to pay special attention to the Raman setup. This is due to the morphology of the substrate surfaces, following silver deposition, is rather inhomogeneous. This is seen in the SEM images presented in figures 1 and 3. Consequently, the observed SERS intensity across the surface can exhibit significant variations. In order to avoid errors in the determination of SERS-activity, we performed measurements with experimental setup showed in figure 5. The cylindrical lens focused the beam at the sample's surface as a spot in the form of a line of approximately 4 mm. During measurements the sample was continuously rotated. Thus obtained SERS intensity corresponds to averaged scattering of analyte molecules located within the circle of ∼15 mm2 area. Moreover, the rotating sample is less susceptible to local heating, hence the degradation of the Raman signal during the measurement is decreased.
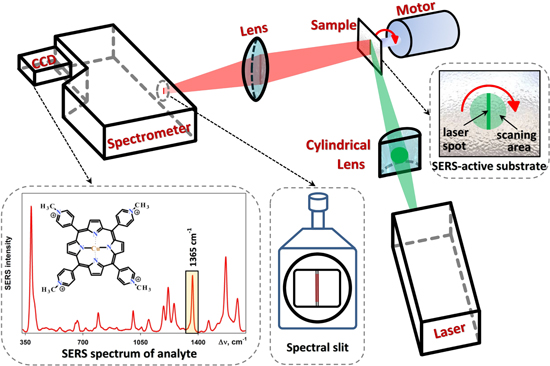
Figure 5. Schematics of the experimental setup and Raman spectrum of CuTMpyP4.
Download figure:
Standard image High-resolution imageThe SERS spectra for a series of Ag/macro-PS samples of increasing time of silver film formation from different reaction mixture and concentrations of AgNO3 were measured to reveal optimal deposition regime. Figure 6 shows the dependences of the SERS intensity on the Ag deposition time which were estimated from the amplitude of the bands at 1365 and 385 cm−1 in the spectrum of CuTMpyP4 adsorbed from the 10−6 M solution. For the samples obtained in solution that does not contain HF the SERS intensity is periodically varied depending on deposition stage at the wide time intervals scalable from 20 to 200 min (figure 6(A)). In this case the most intensive SERS spectrum was observed for the sample formed by silver deposition for 120 min. It is caused by the morphology changes of the silver deposit on the external surface of macro-PS (figures 1(c) and (d)). At the stage of the coalescence of primary particles the boundaries of Ag NPs are nearly connected causing a lot of hot spots. These spots are the gaps between closely spaced interacting metallic particles or NPs with sharp nanoscaled corners and edges where large enhancement of the electromagnetic field is present [47]. At the same time, only minor changes in the morphology of silver coverage on the pore walls in course of immersion are observed. Therefore, in general the variation of SERS-signal is rather small as it is presented in dependence on figure 5(A). It is well seen that the maximal intensity at 120 min is only at 1.1 times higher than the minimal level of other points.
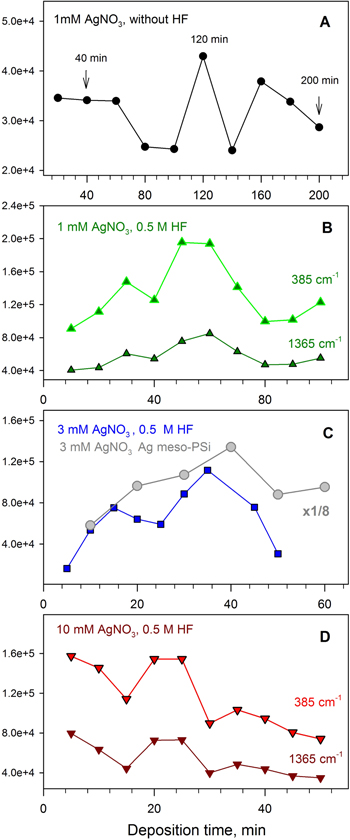
Figure 6. Dependences of the SERS intensity of the 1365 and 385 cm−1 bands in the spectra of 10−6 M CuTMpyP4 on the time of silver immersion deposition on macro-PS from 1 mM (A), (B), 3 mM (C) and 10 mM (D) AgNO3 solution without HF (A) and in the presence 0.5 M hydrofluoric acid (B)–(D). The similar dependence for Ag/meso-PS sample is showed in panel (C).
Download figure:
Standard image High-resolution imageIn the presence of HF in reaction mixture the highest SERS-signal is achieved faster, i.e. for the macro-PS immersed in AgNO3 with the 1 mM concentration maximal band intensity is observed for 60 min (figure 6(B)). When the concentration of silver nitrate increased to 3 mM the maximum of SERS enhancement reached even faster for 40 min (figure 6(C)). It is remarkable, that in both these cases time dependences demonstrate two-peak character. The maxima of the SERS-signal intensity for the samples formed in 3 mM AgNO3 solution are related to the deposition during 15 and 35 min, while in a case of the 1 mM AgNO3 solution they can be found at 30 and 60 min (under the same HF content). The first maximum is less intensive. This might mean that two layers of Ag NPs are formed and that SERS depends in greater extent on the growth of silver agglomerates in the second layer and the creation abundance of channels between them where the scattering cross-section of the analyte's molecules drastically increases.
It should be noted that two-peak time dependences we also observed earlier for the silvered samples prepared on the base of n-type meso-PS substrates [16]. These peculiarities were connected with two stages of the Ag deposition process. A special parameter effective time has been proposed: a product of the silver salt concentration on the immersion deposition time. For different time/concentration combinations the value of effective time was just about constant. Silver immersion deposition in the case of macro-PS proceeded according to a slightly different way in contrast to meso-PS because we used HF additive which promoted continuous removing of passivating SiO2 and resulting supply of the great number of electrons for the silver reduction.
Figure 6(D) shows the dependence of the SERS-signal intensity of 10−6 M CuTMpyP4 on the time of macro-PS plates soaking in 10 mM silver nitrate solution. It is seen that SERS intensity is maximal at the first 5 min. Increasing the time of AgNO3 incubation to 15 min gradually decreases the spectral signal following the maximum at 20–25 min, and then SERS-activity again falls. The morphology of substrates formed at 15, 25 and 35 min exhibited coalesced NPs with highly irregular shapes and facetted forms with sharp edges that could indicate a higher probability of hot spot appearance (figure 3). The existence of many almost touching particles at the external surface and coverage by AgNPs of 150–200 nm size pore walls result in rather high level of SERS-activity for the samples prepared during 20–25 min. However, the large size of clusters due to the multitude of closely located big particles up to 1.5 µm significantly weaken the SERS effect for 35 min sample since they almost overlay macropores (figures 3 and S3(c)).
It is known that for a given excitation λex the largest SERS intensity is reached when the SPR position is located at the middle between the excitation λex and the wavelengths of Raman scattering, e.g. [48, 49]. Thus, in principle one could expect a somewhat different dependence of SERS intensity for different modes of CuTMpyP4. Figure 6 shows the SERS intensity variation of two CuTMpyP4 Raman bands (385 and 1365 cm−1) as a function of the time of silver immersion deposition on macro-PS from 1 mM (figure 6(B)), and 10 mM (figure 6(D)) AgNO3 solution. The intensity variation of both the 1365 and the 385 cm−1 band are found to exhibit the same tendency. This result can be explained taking into account the very broad contour of SPR band (figure 4).
Comparative analysis of spectral data for all studied Ag/macro-PS samples reveals nearly the same order of the SERS-activity (figure 6). The most intensive SERS-signal was observed in the case of silvered nanostructure on macro-PS formed in 3 mM AgNO3 solution in the presence of 0.5 M HF (figure 5(C)). We also compared the level of SERS enhancement by this Ag/macro-PS sample with that for Ag/meso-PS based substrate. Figure 5(C) shows the dependence of the intensity of CuTMpyP4 band at 1365 cm−1 on the time of silver immersion deposition on meso-PS. One can see that the obtained results for both types of substrates are comparable in terms of enhancement efficiency. However the SERS intensity from the sample based on the silvered macro-PS is lower in comparison with the silvered meso-PS. We estimated the detection limit for macro-PS based SERS-active substrates at the level of 10−10 M (see figure S4 in supporting information), while for the meso-PS samples it was evaluated as 10−11 M [16].
Finally, the storage stability of the SERS-active substrates formed by Ag deposition on the macro-PS for 120 min was studied. The silvered PS samples stored for 1, 3 and 8 months were rinsed in diluted HCl (HCl:H2O = 1:9), immersed in aqueous solution of 10−7 M CuTMpyP4 for 2 h, then twice rinsed with distilled water and air-dried. As it can be seen from the figure S5 (see supporting information) the intensity of the SERS-signal was found to be nearly constant for the whole storage periods fulfilling the requirements for the SERS-active substrates application [50].
3.3. Effect of the oxidized graphene on SERS-signal degradation
Although silver nanostructures are known to have a high SERS-activity, a major part of intensity enhancement can be lost due to the plasmon induced heating effect [51]. This results in reduction of spectral intensity, particularly because of destruction of biological objects under analysis [52]. Moreover, silver NPs suffer from high chemical reactivity which can result in their degradation due to the reactions with atmospheric species. The decrease of the SERS performance will lower sensitivity and cause uncertainty of analysis. Therefore efforts aimed to protect silver nanostructures via depositing chemically inert layers are made [40, 53].
In principle SERS substrates based on silvered macro-PS meet with the same problem concerning the signal degradation. When testing the prepared samples, this problem was partially eliminated by using special experimental setup (figure 5). Nevertheless to improve the stability and repeatability of the SERS-signal we have prepared composite nanostructures by coating the silver film and analyte by graphene oxide as a protecting layer. The GO coating should provide chemical isolation of the nanoparticles from atmospheric species. Another thing, the high thermal conductivity of graphene allows swiftly dispersing the heat induced in plasmonic structure by laser excitation, thus protecting the analyte molecules from damage.
Two kinds of composite structures named as GO/CuTMPyP4/Ag/macro-PS (structure I) and GO/CuTMPyP4/GO/Ag/macro-PS (structure II) were fabricated. To study the influence of GO coating on the SERS performance the micro-Raman spectrometer was used since it gives high level of the power density from laser irradiation. While the slight detuning from the CuTMpyP4 Soret absorption band in our micro-Raman setup decreased the Raman cross-section, the SERS spectra of the fabricated samples (see figure S6 in the supporting information) was still very well resolved, thus allowing the quantitative analysis presented below. We repeatedly measured the SERS spectra at a fixed point on the substrate under laser excitation during 1 min with interval 5 s. Figure 7 shows that for the sample without graphene oxide an obvious weakening of SERS intensities (nearly three times) occurred with increasing aerobic light exposure duration. Under the same conditions, the SERS-signal on the graphene-shielded samples remained more stable. Figure 8 compares kinetics of SERS degradation for uncovered sample and for structures I and II containing GO. The data shown in figure 8 are obtained as an average over 9 spectra obtained from 3 samples measured under identical conditions at 3 randomly selected points. The time evolution of the characteristic peak for CuTMPyP4 at 1365 cm−1 show that the layer of the oxidized graphene over the analyte results in reducing the intensity degradation caused by photo-induced damage. For example, in the case of uncovered substrate the 1365 cm−1 peak intensity of CuTMpyP4 molecules within the 60 s measurement period fall off 3.2 times, while the same peak intensity for the structures I and II decreases of 2.5 and 1.4 times, respectively, as shown in figure 8. However, it should be noted, that GO coverage results in decrease of absolute level of initial SERS-signal of ∼1.5 times. This may be due to the fact, that (i) GO layer by itself can absorb a part excitation light, (ii) GO covering Ag layer can shift plasmon resonance position (for both structures) and (iii) in case of structures II, the intermediate GO layer prevents a direct contact between the analyte molecules and the plasmonic film, thus decreasing the electromagnetic enhancement.

Figure 7. Degradation of SERS-signal for CuTMpyP4 at the Ag/macro-PS substrate without graphene oxide in the process of spectral measurements.
Download figure:
Standard image High-resolution image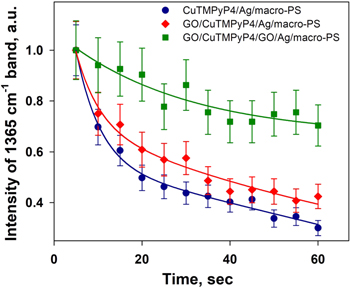
Figure 8. Normalized SERS intensity decay of CuTMpyP4 (1365 cm−1 peak) for three different nanostructures: CuTMPyP4/Ag/macro-PS (1), GO/CuTMPyP4/Ag/macro-PS (2) and GO/CuTMPyP4/GO/Ag/macro-PS (3).
Download figure:
Standard image High-resolution image
Altogether, we can conclude that GO passivation layer on the SERS substrate based on silvered macro-PS has a positive impact on its properties. It provided a chemically inert surface for the substrate to prevent photo-induced SERS-signal degradation.
4. Conclusions
In this paper we have proposed a simple technique for the preparation of sensitive SERS-active substrates based on silvered macroporous silicon. By electrochemical etching of low doped p-type silicon wafers macro-PS templates with pore diameters and depth varying from 500–1000 nm were formed. Silver nanoparticles were deposited by the immersion plating method yielding a layer of big (up to 1500 nm) silver aggregates on the external surface of the macro-PS and a layer of nanoscale silver particles on the walls of the pores. The SERS performance of the obtained substrates was tested by using water-soluble porphyrin CuTMpyP4. The maximal activity was found for the samples formed by Ag deposition in the water–ethanol mixture with the addition of hydrofluoric acid. It is shown that the SERS intensity provided by the silvered macro-PS was nearly the same order as for the silvered meso-PS that we investigated earlier. A notable SERS-signal stability improvement was observed in samples with a single film of oxidized graphene deposited on top of the analyte molecules attached to the Ag/macro-PS surface. However, a further and perhaps even stronger protection against the laser-induced SERS degradation is found in samples featuring the intermediate film of GO placed between the analyte and the silver NPs.
Acknowledgments
This work has been supported in parts by the Belarusian State Research Program 'Photonics, opto- and microelectronics' (task № 1.4.01), the Belarusian Republican Foundations for Fundamental Research (grants № F16SRBG-002). GI acknowledges funding from the Serbian MESTD through project ON171005. We would like to express our thanks to B V Ranishenka for providing with GO samples and helpful discussions.